
As of January 10, 2026, Bitcoin is navigating a strategic consolidation phase around $90,500, evolving within a complex macroeconomic context marked by geopolitical tensions and restrictive U.S. monetary policy. The Fear & Greed Index has plummeted to 25/100, signaling extreme fear in the market, while BTC’s market capitalization remains substantial at $1.79 trillion with 56.92% market dominance.
Macroeconomic Context: Between Disappointing NFP and Geopolitical Tensions
The NFP (Non-Farm Payrolls) report released on January 9 revealed only 50,000 job creations (versus 60-70k expected), paradoxically accompanied by a decrease in the unemployment rate to 4.4% and a wage increase of +0.3%. This configuration places the Federal Reserve in a delicate situation: unable to lower rates aggressively without risking reigniting inflation.
The resulting strengthening of the U.S. dollar exerts mechanical downward pressure on Bitcoin. Institutional investors temporarily prefer the safety of Treasury bonds over risky assets.
Geopolitically, the Venezuelan crisis and the arrest of Nicolás Maduro have triggered concerns about the possibility of Bitcoin reserves being seized by the United States, challenging BTC’s fundamental value proposition as a censorship-resistant asset. Meanwhile, unrest in Iran threatens the global hashrate, as this country has historically been a major mining center.
Institutional Flows: Continued Accumulation Despite Volatility
A major bullish signal comes from MicroStrategy (now « Strategy »), which acquired an additional 1,283 BTC between January 1 and 4, 2026, for $116 million. This aggressive accumulation demonstrates that corporate players are not frightened by the current consolidation and are taking advantage of prices below $100,000 to strengthen their positions.
Bitcoin Spot ETFs show a mixed picture with modest outflows of $243 million after massive inflows of $1.2 billion, indicating tactical profit-taking. However, « accumulation » addresses have increased their holdings from 249,000 to 310,000 BTC in one week, while exchange supply has dropped to 13.7% – a historically low level since 2018.
Technical Analysis: A Fragile Structure in Compression
Daily Chart: The Battle for $90,000
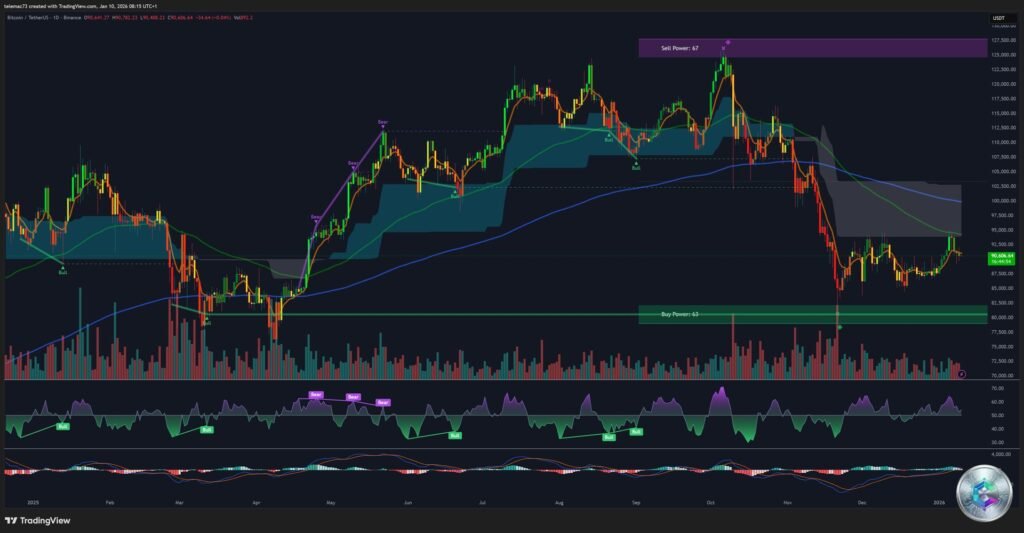
Bitcoin is evolving within a well-defined consolidation rectangle:
- Upper Resistance: $94,500 – $95,000, a zone corresponding to recent local highs and a strong concentration of selling liquidity
- Lower Support: $87,500 – $88,000, the floor of the current consolidation whose break would invalidate the bullish thesis
Technical indicators confirm growing fragility:
- RSI (14): 44.72 – in neutral-low zone, signaling slightly bearish momentum with room to descend further
- MACD: -12.23 in negative territory, confirming that momentum is currently in the hands of sellers
- 200 Moving Average: ~$90,664, with price oscillating around this critical level. A clean close below would confirm a market regime change
4-Hour Chart: Local Downtrend Confirmed
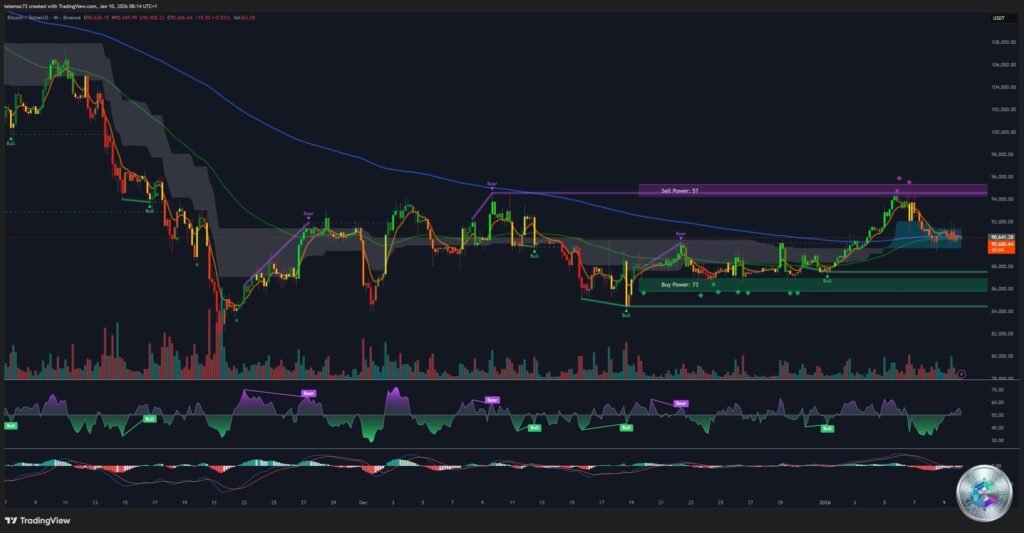
The H4 timeframe reveals a series of descending highs (Lower Highs) since the peak at $94,295, confirming a local downtrend. The price has broken below the EMA 50, which now acts as dynamic resistance around $92,000. The Supertrend has turned red (bearish), indicating that trend-following algorithms are positioned for selling.
Key H4 levels: Resistance at $91,500 (former support turned resistance) and support at $89,200 (week’s low).
15-Minute Chart: Intraday Compression
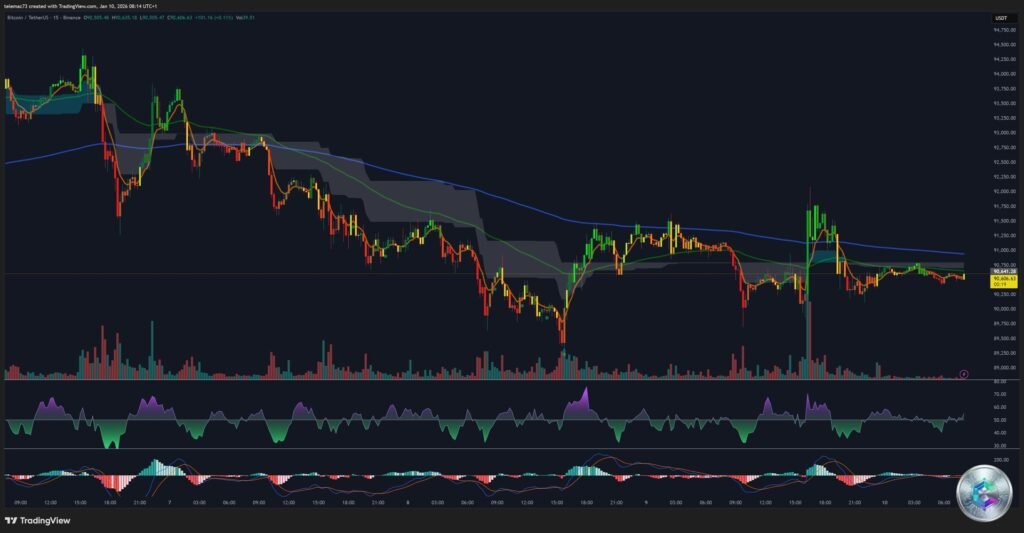
The market is compressed in a micro-range between $89,900 and $91,300 with numerous wicks on both sides, typical of a « choppy » environment where algorithms hunt liquidity. Declining volumes form a compression triangle, announcing imminent volatility expansion.
Liquidation Heatmap: The Key to the Next Move
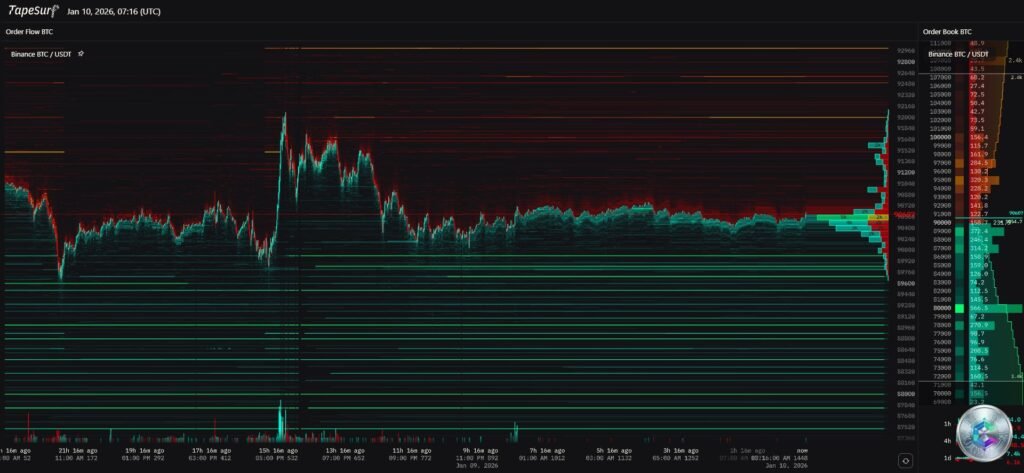
Liquidation analysis reveals two massive clusters that will act as magnets for price:
- Support Cluster ($88,000 – $90,000): Dense zone of long liquidations representing stop-losses from traders who bought the psychological support at $90,000. The likely scenario is a « Liquidity Sweep » where market makers would push the price toward $87,800 – $88,500 to trigger these forced sales and buy cheaply before pushing the price back up.
- Resistance Cluster ($95,000 – $96,850): Massive accumulation of short positions betting on a double top. If the price survives the $88k test and climbs above $93,000, acceleration toward $96,000 will be violent via a short squeeze.
A passive « buy wall » is identified around $89,000, representing real buyers ready to absorb selling. The confrontation between this wall and cascading liquidations will determine if support holds.
Probabilistic Scenarios and Trading Plan
Primary Scenario: « Stop Hunt » (Probability 60%)
BTC gently breaks $90,000, accelerates toward $88,200 – $88,500 to liquidate late long positions. The buy wall at $88k absorbs the selling, creating a significant low wick followed by a V-shaped recovery. Action: Staggered buy orders between $88,000 and $88,800 with stop loss below $87,000.
Bearish Scenario: Structural Break (Probability 25%)
Daily close below $87,500, confirming the Death Cross. Drop toward the deep liquidity zone at $82,000 – $84,000. Action: Cut all long positions if $87,000 gives way on close.
Bullish Scenario: Surprise Bounce (Probability 15%)
Positive news (tariff cancellation), reclaiming $92,000 with strong volume. Rally toward $95,000 then $98,000 via short squeeze. Action: Buy the breakout above $92,200.
Conclusion
Bitcoin is in a defensive compression phase. While the long-term underlying trend remains bullish due to institutional adoption, short-term technical and macroeconomic signals are bearish to neutral. The market is a minefield for impatient traders.
The presence of massive liquidity just below the current price suggests a high probability of tactical correction to clean the market before any sustainable recovery. Caution is warranted: avoid the $89,500 – $91,500 zone and favor extremes (buy on bounce $87,500 – $88,500 or on confirmed breakout above $92,500).
Disclaimer: This article is produced for educational and informational purposes only. It does not constitute personalized financial advice or investment recommendation in any way. Crypto-asset markets are highly volatile and carry significant risk of capital loss. Always conduct your own research (DYOR) and consult a qualified financial advisor before making any investment decision.