
Bitcoin is currently navigating a critical phase in its evolution, oscillating between $68,000 and $70,000 after a 38% retracement from its all-time high of $126,296 reached in October 2025. This in-depth analysis decodes the technical and macroeconomic dynamics shaping the market in early 2026.
Macroeconomic Context: Between Uncertainty and Vigilance
The macroeconomic environment of February 2026 is marked by growing uncertainty. Bitcoin, historically perceived as a hedge against inflation, now behaves more like a risk asset, closely correlated with growth technology stocks.
The Federal Reserve and the Kevin Warsh Factor
At its January 28, 2026 meeting, the Federal Reserve chose to maintain its policy rate in a range of 3.50% to 3.75%, after three consecutive 25 basis point cuts in 2025. This pause comes in a context of stubborn inflation at 2.7%, still above the 2% target.
The nomination of Kevin Warsh to succeed Jerome Powell has introduced additional volatility to the markets. Perceived as a less accommodative profile, this change has strengthened the dollar index and exerted downward pressure on Bitcoin.

Geopolitical Tensions and Economic Data
The market nervously awaits the release of non-farm payroll data and the consumer price index scheduled for the end of the week. These reports will be decisive for the future trajectory of interest rates.
At the same time, negotiations between the United States and Iran in Oman have led to a drop in oil prices towards $63, reducing inflationary pressures but also diminishing Bitcoin’s appeal as a safe haven.
| Macroeconomic Indicator | Current Value | Impact on BTC |
|---|---|---|
| Fed Funds Rate | 3.50% – 3.75% | Neutral to Bearish |
| Inflation (CPI) | 2.7% | Bearish |
| Dollar Index (DXY) | Highest since Oct. 2025 | Bearish |
| 10-Year Treasury Yield | 4.22% | Bearish |
| Oil Price (WTI) | $63.13 | Disinflationary |
Multi-Timeframe Technical Analysis
Technical analysis reveals a market in search of a bottom after a significant correction. Let’s examine the different timeframes to understand the current structure.
Daily View: The Battle for $70,000

On the daily chart, Bitcoin is consolidating around the crucial pivot level of $70,000. This zone represents a balance point between buyers and sellers, with major implications for the market’s future direction.
Support Levels:
- $68,300 (S1): First immediate defensive barrier
- $66,700 (S2): Critical intermediate support zone
- $63,700 (S3): Last level before a deeper correction
Resistance Levels:
- $71,900 (R1): First psychological barrier
- $73,600 (R2): Intermediate resistance zone
- $76,300 (R3): Major bullish target
4-Hour View: Consolidation and Indecision

The 4-hour chart reveals a consolidation phase characterized by sideways movements and moderate volatility. The market is testing traders’ resolve in the face of macroeconomic uncertainty.
Key levels on this timeframe:
- Immediate support: $68,900 – Short-term defense zone
- Immediate resistance: $70,800 – Level to break to confirm recovery
15-Minute View: Intraday Tactics
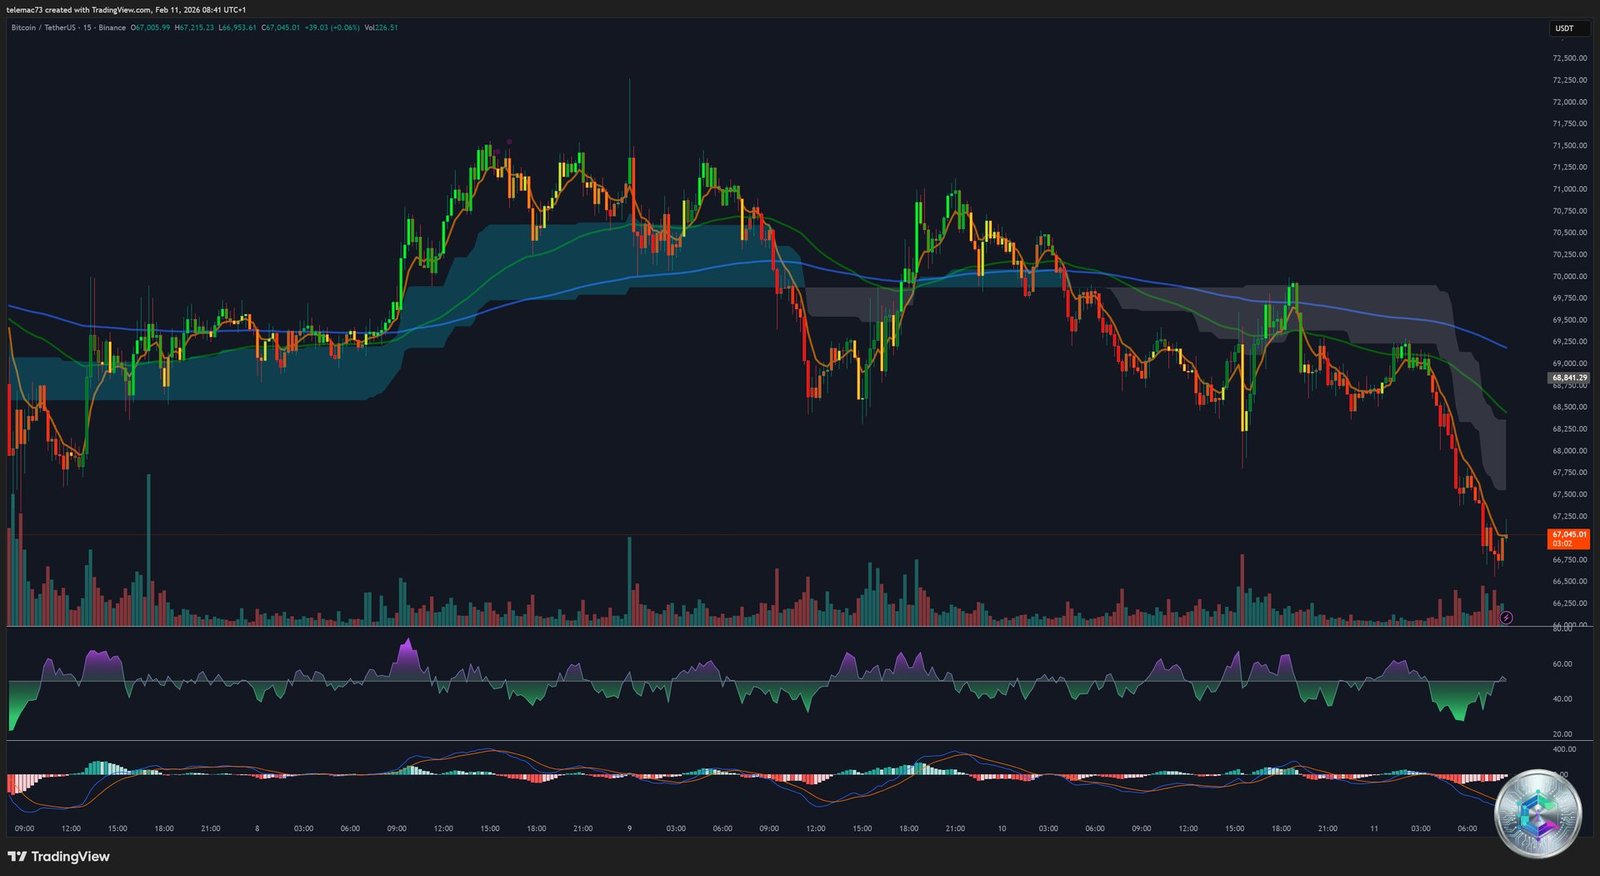
On the 15-minute scale, we observe increased intraday volatility with rapid movements around pivot levels. This timeframe is particularly relevant for short-term traders looking to exploit micro-trends.
The current range of $68,000 to $70,000 defines operational limits for intraday trading, with buying opportunities near supports and selling opportunities near resistances.
Market Sentiment: Extreme Fear
The Fear & Greed Index shows a score of 17/100, indicating extreme fear in the market. Historically, these capitulation levels have often marked accumulation opportunities for long-term investors.
Bitcoin ETF flows, however, show signs of improvement with consecutive inflows after the mid-January outflow wave, suggesting a gradual return of institutional confidence.
Forward-Looking Scenarios
Bullish Scenario
A confirmed break above $71,900 with volume could trigger a rally towards $73,600 and then $76,300. This scenario would be favored by favorable economic data and a dovish Fed pivot.
Bearish Scenario
Failure to maintain support at $68,300 would expose Bitcoin to a correction towards $66,700, or even $63,700 in case of widespread panic. This scenario would be exacerbated by a surprise inflation increase or hawkish Fed rhetoric.
Neutral Scenario
Continued consolidation between $68,000 and $72,000 remains the most likely scenario in the short term, as the market awaits clear catalysts before taking a firm direction.
Conclusion
Bitcoin stands at a critical inflection point where macroeconomic and technical forces converge. The $68,000 – $70,000 zone represents a decisive battleground between bulls and bears. The coming days, with the release of crucial economic data, will be determinant for the medium-term trajectory of the cryptocurrency.
Savvy investors will closely monitor the identified support and resistance levels, while staying attentive to macroeconomic developments and on-chain signals that could precede the market’s next significant move.
Disclaimer: This article is provided for informational and educational purposes only. It does not constitute financial, investment, or trading advice in any way. Cryptocurrency markets are highly volatile and carry significant risks. Always conduct your own research and consult a qualified financial advisor before making any investment decision.