
Introduction: Bitcoin at a Historic Crossroads
As April 2026 begins, Bitcoin (BTC) stands at a historically complex structural crossroads. The market has definitively transcended the speculative phase that defined previous cycles — notably the 2021 euphoria fueled by retail liquidity injections and FOMO (Fear Of Missing Out). The current landscape is now governed by deep institutional maturity, built upon three structural pillars: the dominance of Spot ETFs, adoption by sovereign entities, and the emergence of enterprise-grade DeFi.
Despite this robust foundation, Bitcoin’s price action remains subject to macroeconomic and geopolitical forces of rare intensity. The market evolves under the shadow of global uncertainty exacerbated by tensions between the United States, Israel, and Iran. WTI crude oil holding above $103/barrel sustains persistent inflationary fears, with the probability of a Fed rate hold now assessed at 98%.
🔥 Liquidity Architecture: Reading the Order Book Heatmap
The TapeSurf heatmap for the BTC/USDT pair on Binance reveals a pronounced asymmetry between supply and demand, mapping the major friction zones where institutions and market makers have deployed their capital.
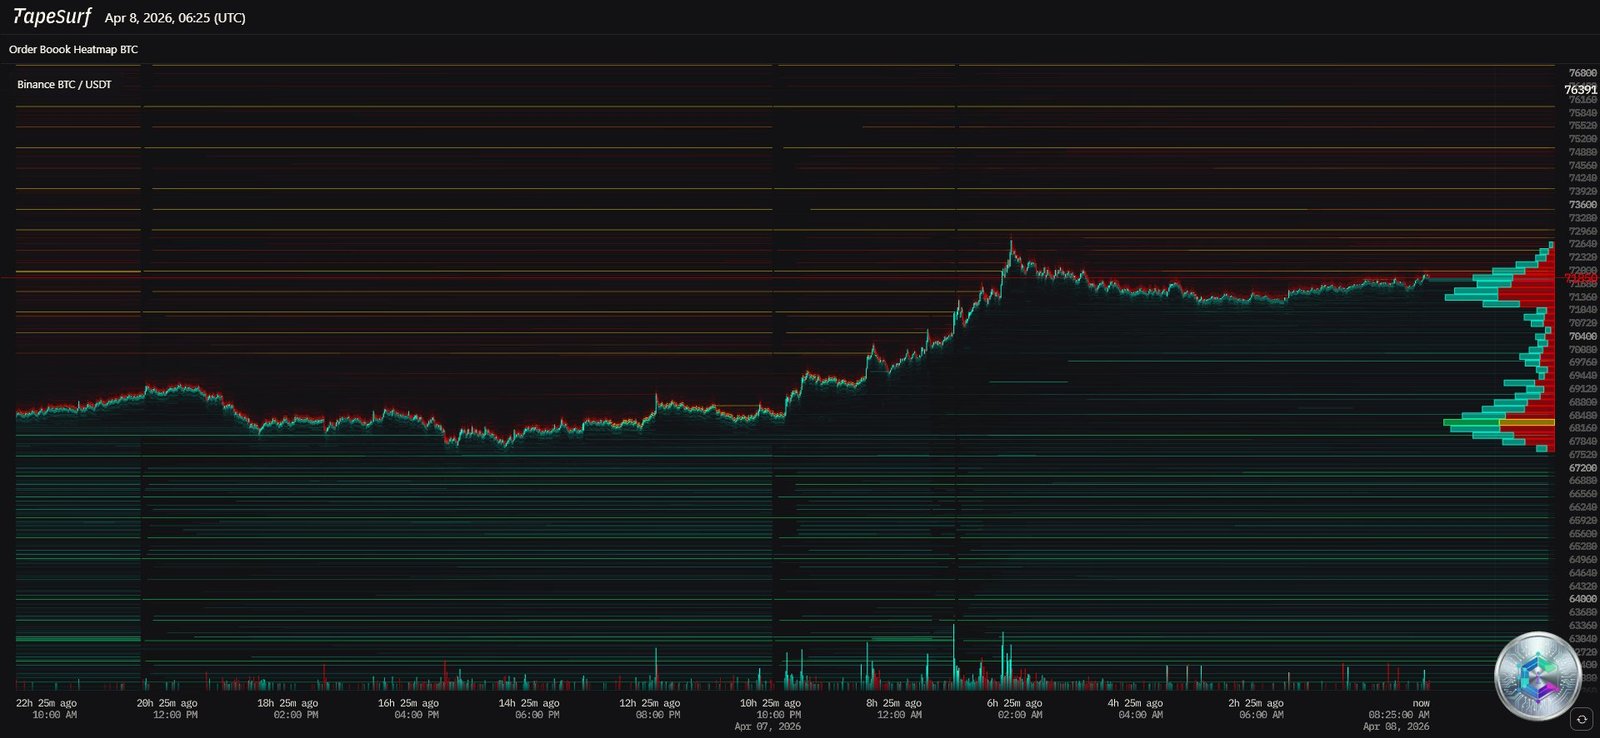
Supply Overhead: The Selling Wall
The upper portion of the heatmap is characterized by an exceptionally dense concentration of sell orders starting around $72,000 and peaking in a massive scarlet band between $74,000 and $76,000. This liquidity wall represents a major structural resistance, illustrating the presence of passive sellers — likely large whales and institutional distribution algorithms looking to reduce exposure as price approaches recent highs.
Any bullish breakout attempt requires colossal absorption by market buy orders. The sheer thickness of this zone explains the repeated rejections seen during previous attempts to break above $70,000.
Demand Pools: The Absorption Infrastructure
The lower hemisphere of the heatmap depicts the market’s support infrastructure. A first notable buy liquidity layer sits between $67,000 and $68,000, acting as an immediate safety net. The true demand wall lies lower, with a significant accumulation of green orders extending from $65,000 down to the psychological threshold of $60,000. These massive orders mechanically brake panic sell-offs, acting as a shock absorber against geopolitically-driven bearish volatility.
The Liquidity Void and Explosive Volatility
The range between $68,000 and $71,000 features a relatively thin order book profile — a liquidity void. When equilibrium is broken by a sudden news flow (such as Iran ceasefire rumors), price traverses this zone with lightning speed. This microstructure explains the massive short liquidations (short squeezes) reaching $255 million during recent bounces.
📊 Daily Chart Analysis (1D): The Macro View
Trend Structure: From All-Time High to Consolidation
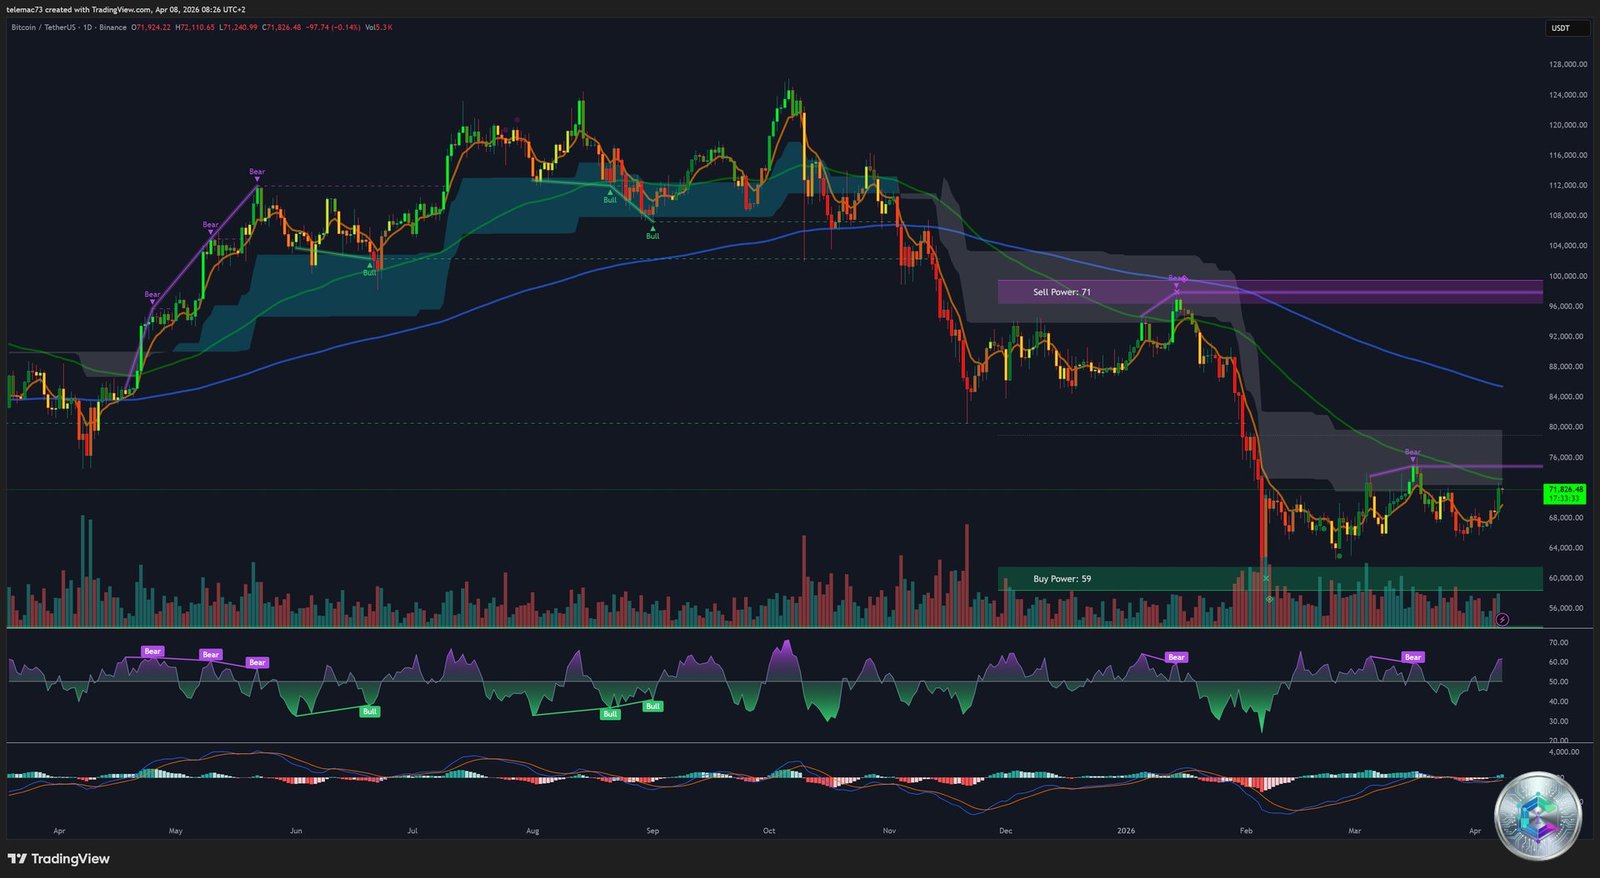
The daily chart spectacularly illustrates the paradigm shift of recent months. Bitcoin reached a historic All-Time High of $126,198 on October 7, 2025, before suffering a brutal ~52% correction, establishing a capitulation floor around $60,000.
Since then, BTC has entered a prolonged consolidation phase forming a wide rectangular pattern. Institutional algorithms define two extreme polarity zones: an upper rectangle labeled « Sell Power: 71 » above $90,000–$100,000 (absolute distribution zone) and a lower rectangle « Buy Power: 59 » centered around $60,000 (historical accumulation zone).
The Death Cross: A Major Warning Signal
The daily chart reveals a critical bearish confirmation event: a Death Cross. This phenomenon — characterized by the 50-day EMA crossing below the 200-day EMA — signals a transition toward a deep correction regime. The slow moving average now acts as an overwhelming dynamic resistance, systematically rejecting bullish recovery attempts and confirming seller control over long-term directionality.
Daily RSI and MACD: Hesitant Convalescence
The 14-period RSI oscillates around 44 — recovering from correction lows but still below the neutrality line of 50. Bearish momentum is no longer in panic acceleration mode, but buyers haven’t yet accumulated enough strength to reverse momentum.
The MACD reads -9.3, confirming pronounced negative territory. However, an encouraging signal emerges: histogram bars are gradually becoming less deep, suggesting diminishing marginal selling pressure and an attempt to kindle a reversal — though the overall structure remains fragile.
⏱️ 4-Hour Chart Analysis (4H): The Tactical View
Symmetrical Triangle: Compression Before the Explosion
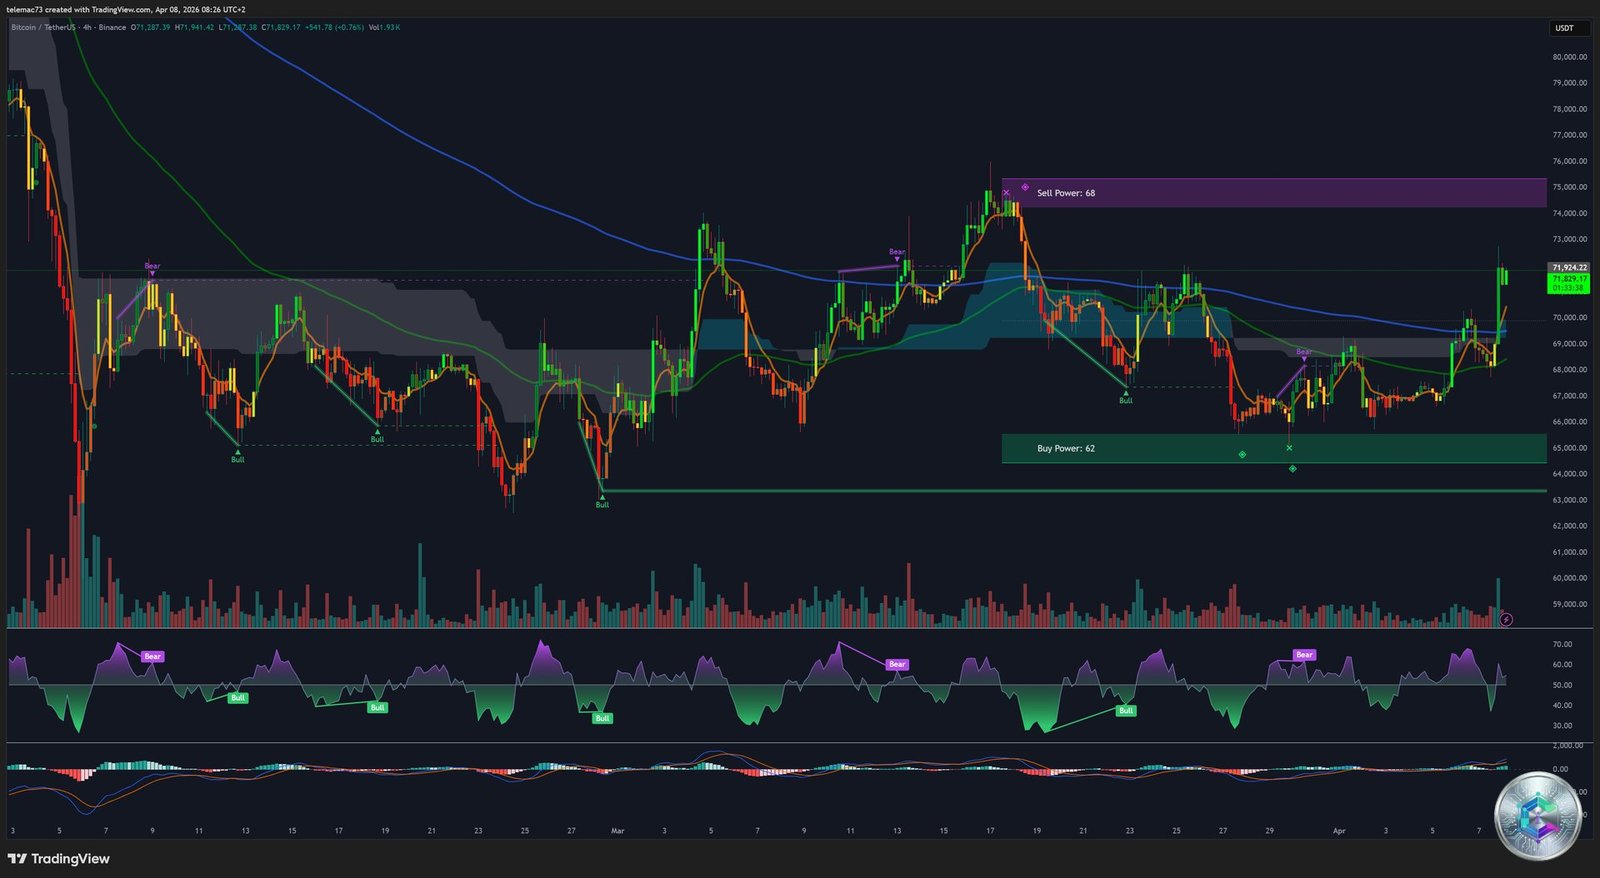
On the 4H chart, Bitcoin is locked in an increasingly narrow consolidation structure: a symmetrical compression triangle. Converging trendlines connect progressively lower highs and higher lows, expressing perfect market indecision.
Volume contracts inexorably as price approaches the triangle’s apex — a classic signal heralding an imminent and explosive directional breakout. The accumulated kinetic energy will release abruptly once one of the trendlines is breached with sustained volume.
Bear Flags: The Mechanics of Bearish Continuation
The recent 4H history is dotted with multiple bear flags. Repeatedly, a sharp decline (the flagpole, catalyzed by adverse macro announcements) was followed by a slow upward drift within a narrow parallel channel with anemic volumes. These corrective bounces offered the illusion of recovery, but the absence of institutional participation betrayed their fragility — systematically resolving with breakdowns to the downside.
Key 4H Power Zones
| Zone | Level | Significance |
|---|---|---|
| Major resistance | $72,000 – $76,000 | Institutional selling wall |
| Intermediate resistance | $68,000 – $70,000 | 200 EMA 4H + former supports turned resistances |
| Immediate support | $67,000 – $68,000 | First safety net |
| Critical support | $60,000 – $65,000 | Major institutional accumulation zone |
⚡ 15-Minute Chart Analysis (15M): Intraday Trading
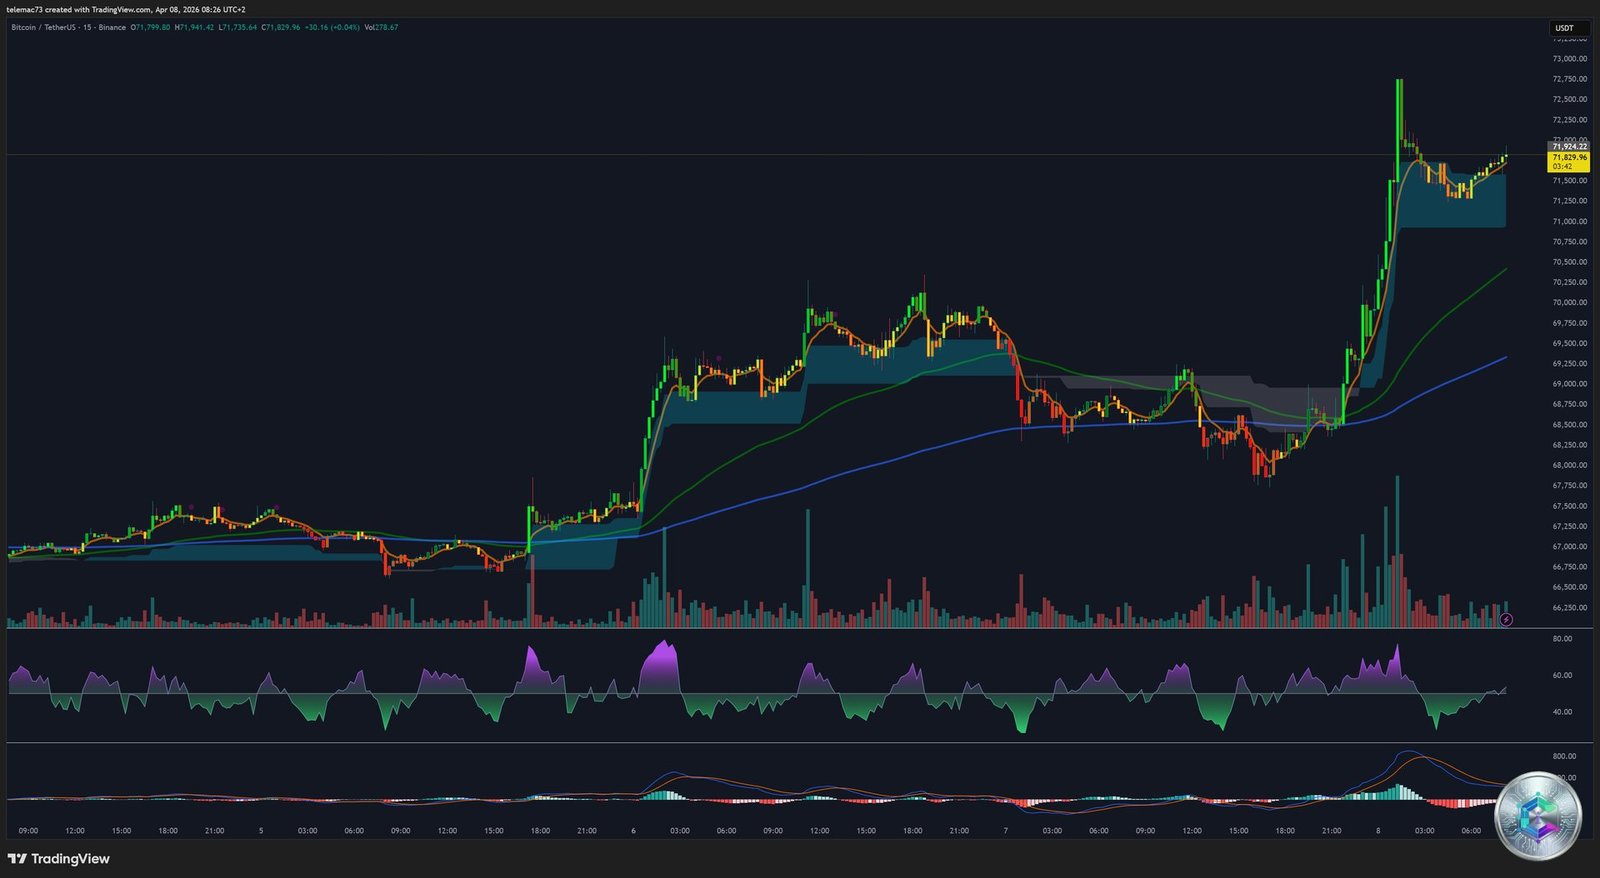
The 15-minute chart reveals Bitcoin’s intraday market microstructure, essential for active traders. Short-term oscillations faithfully reflect geopolitical and macroeconomic news shocks. Support levels identified on higher timeframe charts act as rapid reaction zones — allowing precise entry point identification for tactical positions.
On this timeframe, rejections at intraday resistances and bounces at key supports confirm the coherence of the market structure identified on higher timeframes. Institutional traders rely on these levels to execute their orders with precision.
🏦 ETF Flows and Institutional Demand: The Invisible Safety Net
Despite surface turbulence, on-chain data reveals institutional demand of remarkable robustness. Bitcoin Spot ETFs recorded $471 million in net inflows in a single day — the highest level since late February 2026. BlackRock (IBIT) and Fidelity (FBTC) captured the bulk of these flows, signaling unwavering long-term institutional conviction.
This ETF demand creates mechanical absorption of the daily mining supply (~450 BTC/day post-halving), structurally reducing available liquidity. Ethereum ETF outflows remain concerning ($770 million evaporated over three months), accentuating Bitcoin’s relative dominance in institutional allocation.
🏢 MicroStrategy (Strategy): Bitcoin’s Corporate Leverage Engine
MicroStrategy — now rebranded as Strategy — remains the most influential corporate actor in the Bitcoin market. The company now holds 766,970 BTC (approximately 4% of total circulating supply), acquired at a cumulative cost of $58.02 billion, translating to an average cost basis of $75,644 per BTC.
| Metric | Value (April 2026) |
|---|---|
| Total Bitcoin Holdings | 766,970 BTC |
| Cumulative Acquisition Value | $58.02 billion USD |
| Average Cost Basis | $75,644 USD / BTC |
| Share of Circulating Supply | ~4% |
| Recent Acquisitions (April 2026) | 4,871 BTC ($329.9M) |
| Unrealized Accounting Loss (Q1 2026) | -$14.46 billion USD |
Strategy finances its accumulation through the issuance of sophisticated hybrid capital (perpetual preferred shares STRC), raising over $329 million in spring 2026. Despite generating a massive unrealized accounting loss of $14.46 billion in Q1 2026, the company maintains $2.25 billion in liquid reserves to service its debt. Its continuous appetite for Bitcoin confers the $60,000–$65,000 zone the status of institutional buyer of last resort.
🧠 Market Psychology: The Fear/Greed Dissonance
The divergence between fundamental indicators and market sentiment is striking. On one hand, structural adoption aggregators show a score of 72 (Greed), reflecting the solidity of institutional infrastructure. On the other hand, short-term sentiment metrics (Alternative Data Index) have collapsed to 11 — Extreme Fear levels unseen since the FTX implosion.
Contrarian theory teaches that extreme fear levels are systematically the precursors of market bottoms. Psychological capitulation purges the market of weak hands and transfers the asset to strong institutional hands — insensitive to short-term fluctuations.
The Rotation Toward DeAI: The Major Emerging Trend
In this difficult macro environment, one super-sector is draining capital: Decentralized Artificial Intelligence (DeAI). Unlike past narrative bubbles, the 2026 DeAI thesis rests on verifiable on-chain revenue. Render (RENDER, +9.47%), Bittensor (TAO) — which completed the largest LLM training ever achieved on a peer-to-peer architecture — and Numeraire (NMR, +8.66%) illustrate this rotation toward real computational utility assets.
🎯 Strategic Synthesis and Outlook
Bitcoin evolves in a gravitational paradox: trapped between a technical bearish matrix (Death Cross, negative MACD, compression triangles) and institutional demand of historically unprecedented robustness.
- Major resistance: $72,000 – $76,000 (institutional selling wall)
- Critical support: $60,000 – $65,000 (buyer of last resort floor)
- Bullish catalysts: Geopolitical resolution (Iran), accelerating ETF flows, sovereign adoption
- Bearish catalysts: Geopolitical escalation, macro shock (hawkish Fed), forced institutional deleveraging
As long as the critical $60,000 fortress is not structurally breached — which would require systemic ETF capitulation or forced corporate treasury deleveraging — the current phase should be interpreted as a long and painful institutional re-accumulation. The volatility compression visible on the 4H chart guarantees that a cataclysmic directional breakout is taking shape. Statistical and fundamental probabilities continue to favor a macro-bullish resolution targeting the long-term reconquest of $100,000, even $240,000 according to some advanced analytical models, once geopolitical risk (Iran, global trade) is fully absorbed by order books.
⚠️ Disclaimer: This article is written for educational and informational purposes only. It does not constitute investment advice or a recommendation to buy or sell digital assets. Cryptocurrency markets are highly volatile and carry significant risk of capital loss. Please consult a licensed financial advisor before making any investment decisions.