
Introduction: A Market at a Crossroads
In early March 2026, Bitcoin (BTC) is navigating a period of structural transformation and heightened volatility. Having reached a breathtaking all-time high (ATH) of $126,272.76 on October 6, 2025, the flagship crypto asset entered a prolonged correction of more than 46%, recording five consecutive months of negative returns. As of March 6, 2026, Bitcoin trades around $68,131, caught between macroeconomic forces of rare intensity and complex microstructural dynamics.
The Iranian Geopolitical Shock: The Trigger Behind the Selloff
Price action has been violently dictated by a major geopolitical shock. US and Israeli strikes against Iran, leading to the strategic closure of the Strait of Hormuz, sent shockwaves across global commodity markets. Brent crude surged 13% toward $80/barrel, while gold spiked to $5,390–$5,400/oz.
Far from acting as « digital gold, » Bitcoin behaved as a high-beta risk asset. The energy price surge reset US inflation expectations, strengthening the dollar (DXY hitting a 5-week high of 99.4) and pushing BTC twice toward the critical $60,000–$62,500 support zone. The 30-day rolling correlation between BTC and the S&P 500 further reinforced this dynamic, rising from 0.50 in October 2025 to 0.55 by March 1, 2026.
The Regulatory Framework: An Institutional Tailwind
Simultaneously, the market is absorbing a dense flow of regulatory transformation. In the US, President Trump signed an executive order revoking the restrictive directives of the previous administration, establishing a working group within the National Economic Council tasked with evaluating the creation of a national strategic digital asset reserve while formally prohibiting any development of a US CBDC.
In Europe, the progressive implementation of the MiCA regulation continues to structure a more institutional environment, demanding full transparency and rigorous compliance from token issuers.
Bitcoin ETFs: The Institutional Counterweight
The most spectacular impact of this regulatory clarity is visible in US spot Bitcoin ETF flows. Over three consecutive days in early March, $1.145 billion poured in, including $462 million on March 4 alone. BlackRock’s IBIT ETF absorbed 66.2% of that volume ($306M) single-handedly.
In just 72 hours, these inflows erased 28.6% of the $4 billion outflow sequence observed over the prior five weeks. The return of the Coinbase Premium Index to positive territory confirms that US institutional entities are aggressively accumulating during market dips. Additionally, miner selling dropped from -4,718 BTC in early February to just -837 BTC by March 1, signaling strategic retention ahead of anticipated price appreciation.
Heatmap Analysis: The Invisible Walls of the Market
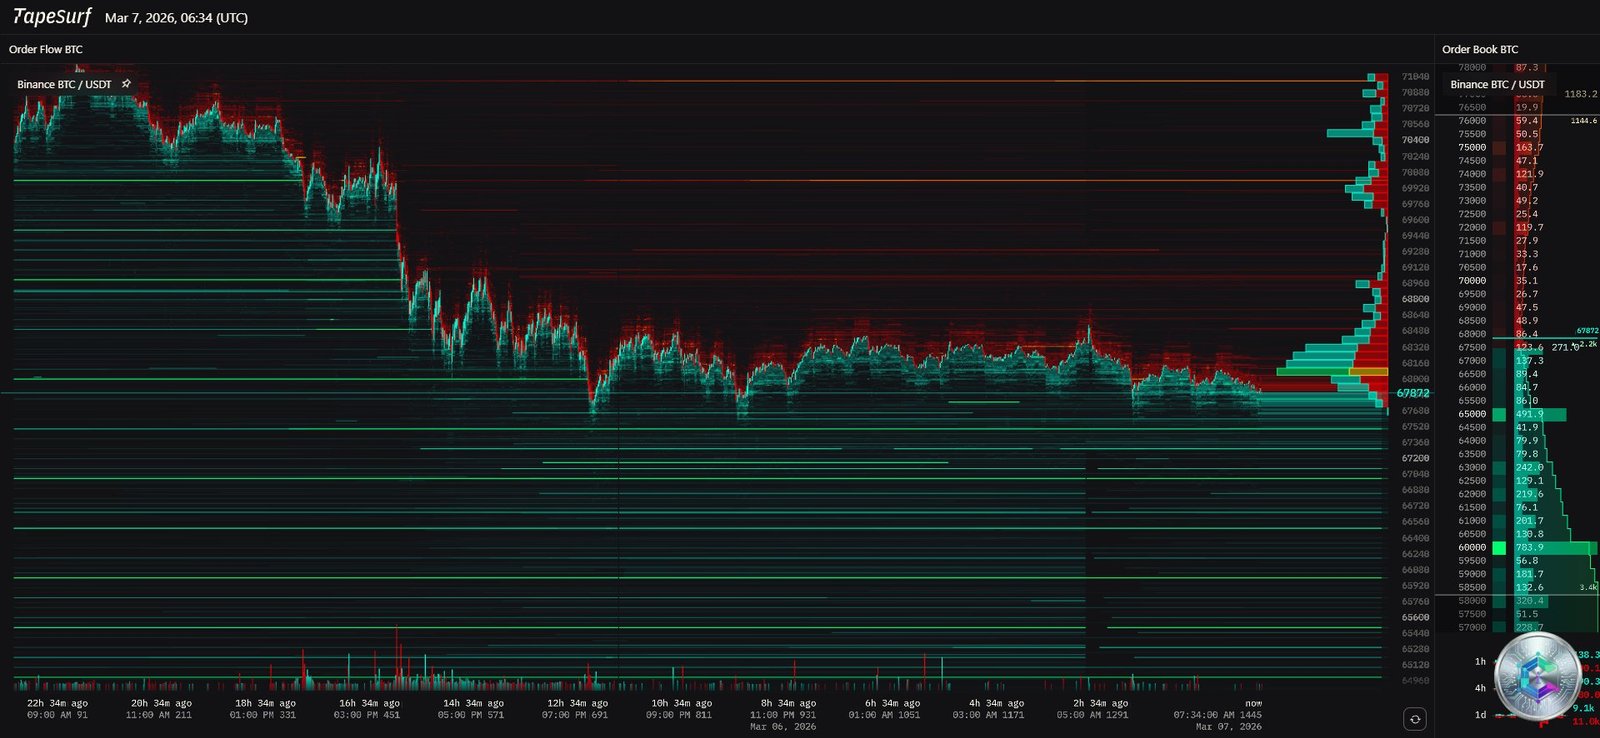
The order book heatmap adds an indispensable vectorial dimension to analysis. Extreme liquidity concentrations reveal:
- Supply Wall: $73,750 – $74,400 — This major resistance corridor has historically acted as a glass ceiling, absorbing post-ETF rally attempts (Q1 2024), slowing the descent from $100K (April 2025), and capping every current bounce. Institutions are using this zone to strategically distribute their holdings.
- Demand Wall: $60,000 – $62,500 — A layered foundation of buy limit orders validated during the recent Iranian crisis. This level represents a genuine trench defended by real capital ready to be deployed.
The early March short squeeze (forced liquidation of over $110 million in short positions in a single session) was catalyzed by the drying up of selling liquidity combined with ETF inflows, momentarily pushing Bitcoin to $71,890.
Options Market: A 3:1 Ratio Favoring the Bulls
CME Group data for the end-of-March 2026 expiry reveals a fascinating asymmetry:
| Parameter | Value | Interpretation |
|---|---|---|
| Call/Put Ratio (OI) | 3:1 | Structural institutional bullish bias |
| Calls Volume (notional) | $660M | Anticipation of a Q1 2026 structural rebound |
| Puts Volume (notional) | $240M | Downside hedging structured between $60K–$90K |
| IV Peak (Puts) | 95% (Feb. 2026) | Extreme risk premium during geopolitical shock |
| OTM Calls Concentration | $110,000 – $220,000 | Likely institutional call-overwriting strategies |
The $80,000 call strike remains the immediate battlefield focal point, acting as a « gamma magnet » for market makers who must hedge their exposures as price approaches that level.
Multi-Timeframe Technical Analysis
15-Minute Chart: Microstructure in Motion
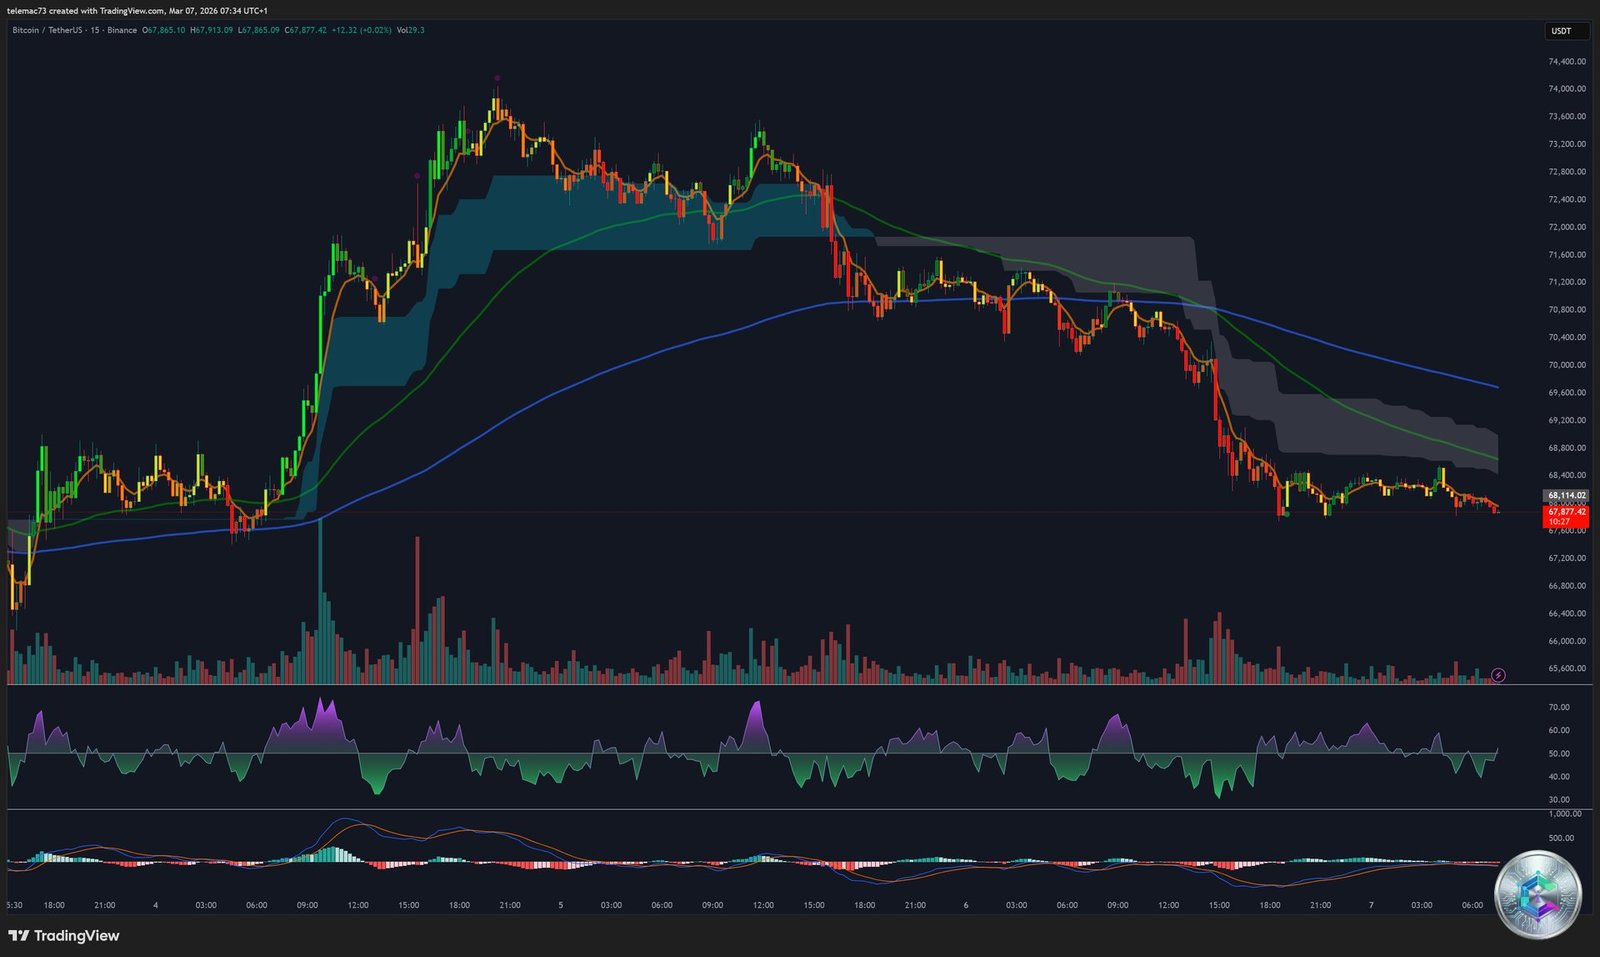
On the 15-minute timeframe, price action reveals choppy movements characteristic of algorithmic TWAP/VWAP execution. Symmetrical compression triangles materialize the precarious balance between supply and demand before directional breakouts driven by sudden volume spikes.
The RSI on this timeframe displays a nervous topography: peaks above 75 coincide with liquidity absorption wicks (buyer exhaustion), while plunges below 25 generate scalping opportunities for mean-reversion algorithms. The MACD below the zero line confirms that the intraday bias remains under seller control.
4-Hour Chart: Intermediate Trend Under Pressure
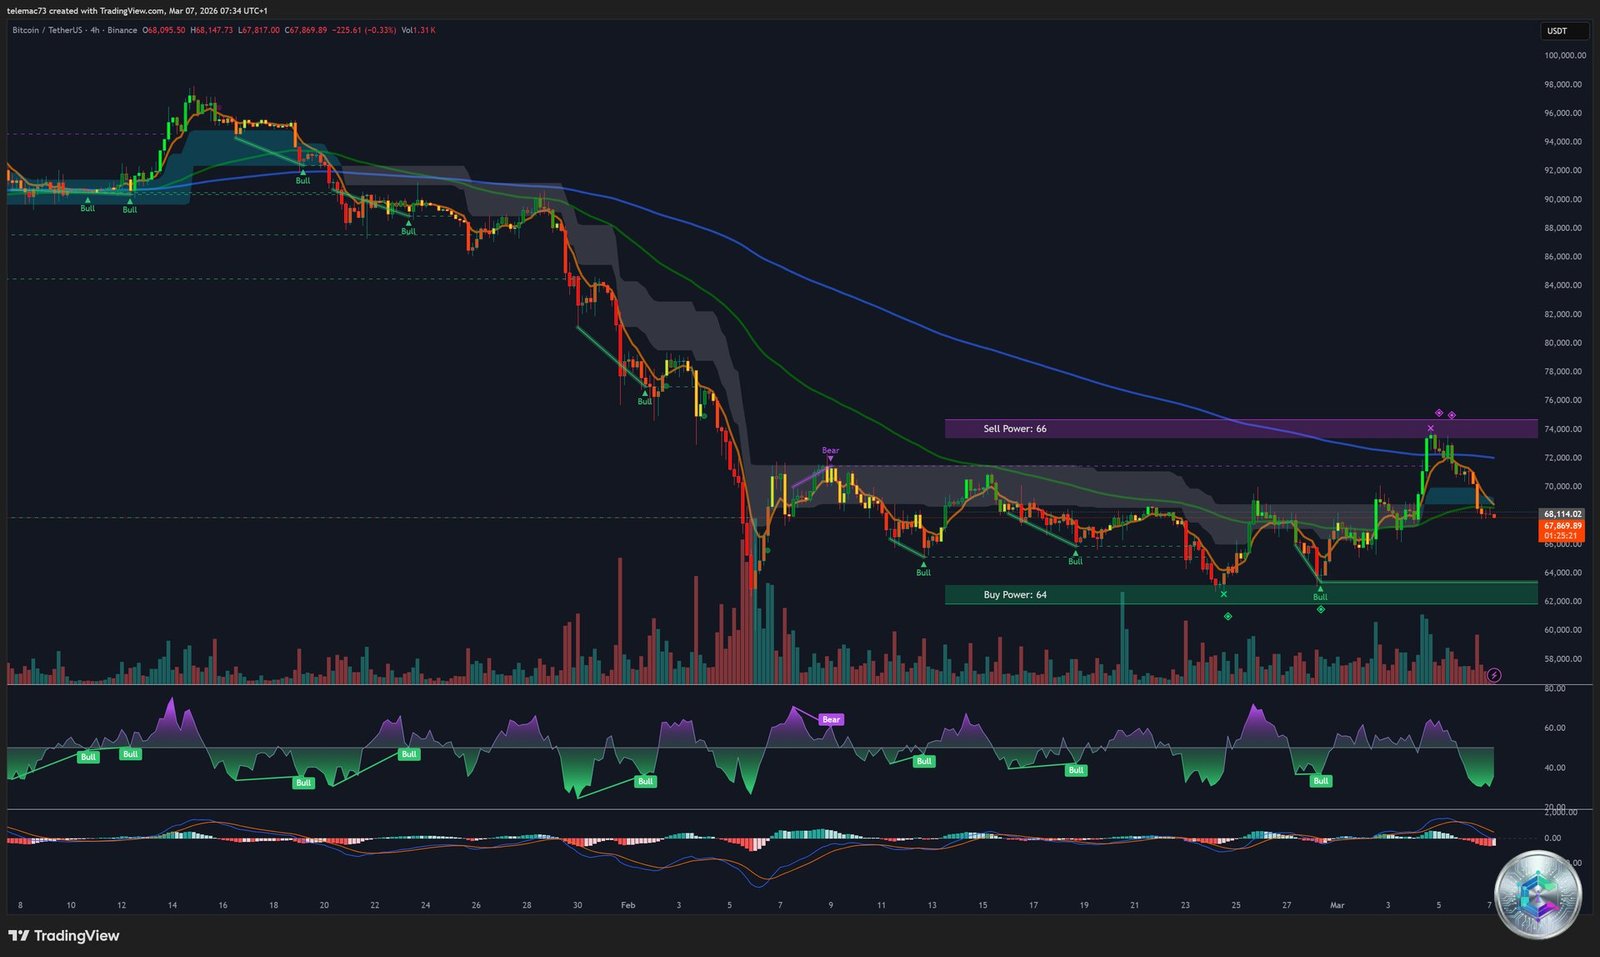
The 4H chart is dominated by erratic price action around the psychological $70,000 threshold. An ascent attempt toward $70,072 concluded with a long upper wick — a violent rejection demonstrating demand’s inability to absorb latent supply (a classic liquidity sweep).
The asset is precariously consolidating around its MA30 at $68,472. A sustained close below this pivot on the 4H chart would signal immediate deterioration of the intermediate bullish posture. The RSI oscillates near 50 (neutrality/digestion) while the MACD threatens a death cross, which would technically catalyze a rotation toward the lower bound of the current range.
Daily Chart: The Bear Flag and the Death Cross
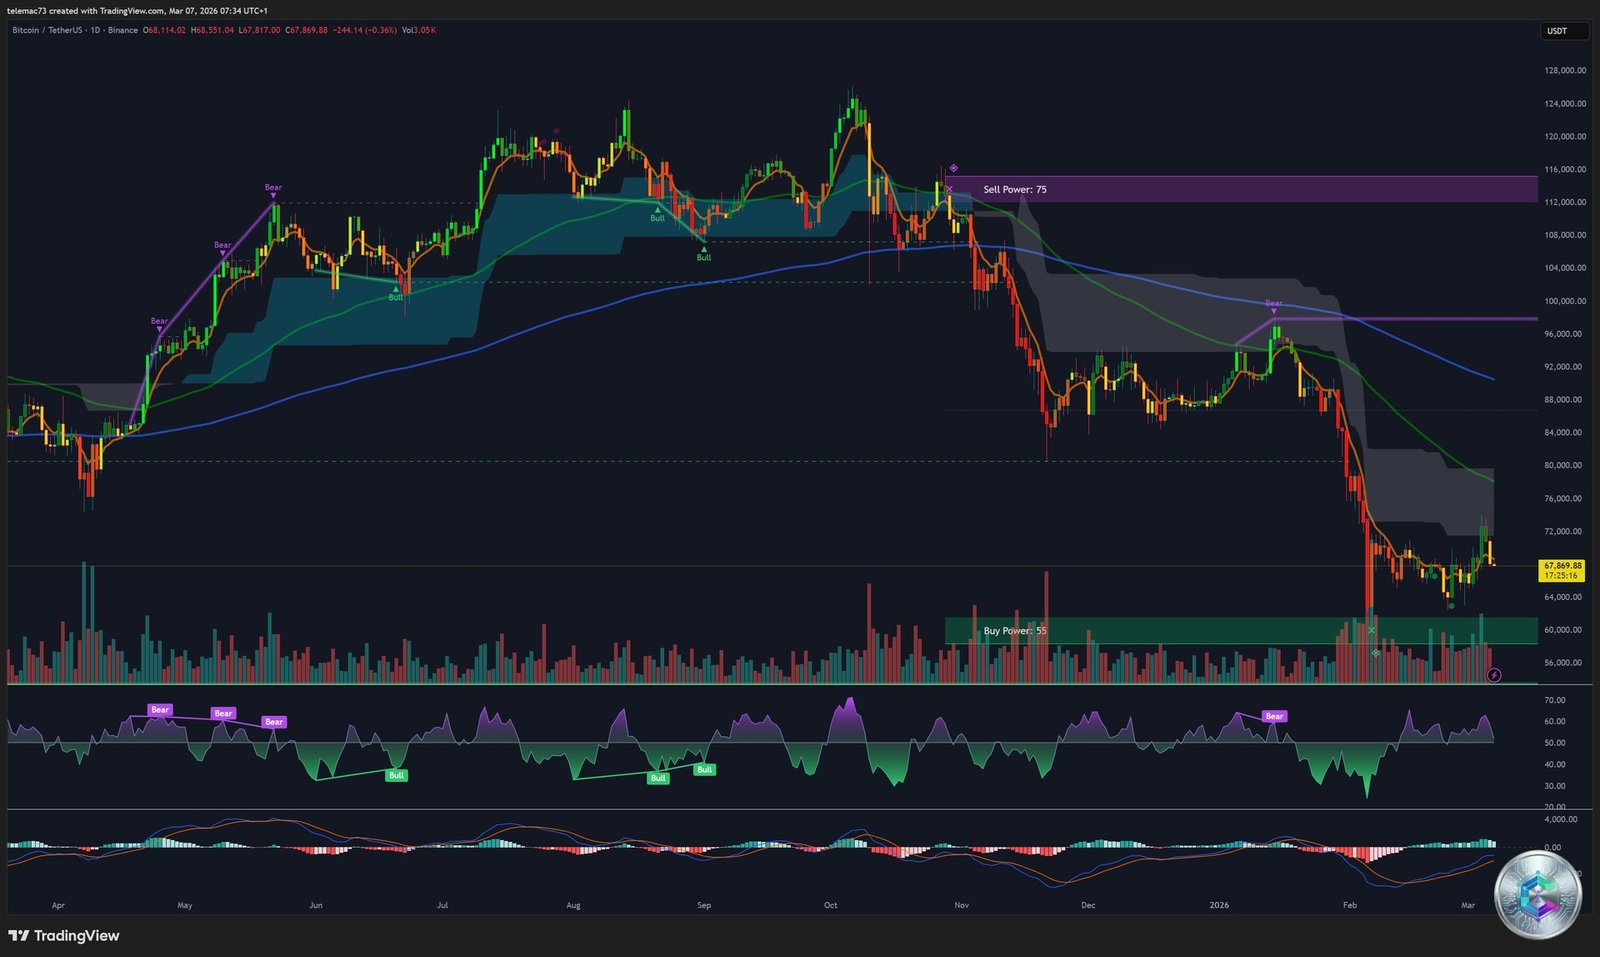
The daily chart paints the most concerning picture. Since its October 2025 ATH, Bitcoin has formed a massive bear flag: a pole created by the near-vertical plunge from the $90,000–$126,000 distribution zone, followed by an anemic corrective channel oscillating between $64,000 and $69,000.
A daily close below the floor at $62,300 would validate this bearish continuation pattern, projecting a theoretical target (measured move) toward $56,800, then $41,400–$45,000 in an extreme capitulation scenario.
The daily RSI at 46.14 (neutral zone) reveals a critical hidden bearish divergence: the asset forms lower highs in its macro trend while the RSI simultaneously prints higher highs — betraying severe structural weakness from buyers who are exhausting themselves without making new records.
⚠️ The Death Cross: March 2026’s Defining Technical Event
The most widely discussed event of early March 2026 is the confirmed formation of a Death Cross simultaneously on both the daily and 3-day charts — the SMA50 ($89,799) crossing below the SMA200 ($91,226), far above the current price (~$68,000), underscoring the severity of the disconnect from historical valuation averages.
Historical precedents speak for themselves:
| Bitcoin Cycle | Pre-Cross Decline | Post-Death Cross Decline | Capitulation Duration |
|---|---|---|---|
| 2014 | -72% | Additional -52% | Several months |
| 2017/2018 | -67% | Additional -50% | Extended Crypto Winter |
| 2019 | Intermediate correction | -49.8% | 167 days |
| 2022 | -58% | -49.5% (→ $15,000) | 314 days |
| March 2026 | -46% (→ $68,000) | Projected risk: -30% to -50% | Under evaluation |
Analysts (including CrypFlow) anticipate — if history repeats — a bottom around $50,000 by end of March 2026, with a potential incursion into the $30,000–$45,000 zone in the event of severe macroeconomic liquidity stress.
Key Level Mapping
| Classification | Price Zone (USD) | Justification |
|---|---|---|
| 🔴 Macro Resistance (Major Invalidation) | $79,000 | Total Bear Flag invalidation. Recapture above SMA50. |
| 🔴 Major Supply Wall | $73,750 – $74,400 | Most critical resistance corridor. Major historical rejection zones. |
| 🟠 Upper Pivot Breakout Level | $72,000 | Strict ceiling of current consolidation. Upper limit of valid Bear Flag. |
| 🟡 Dynamic Intraday Pivot (MA30) | $68,472 | Short-term attraction level on the 4H chart. |
| 🟢 Consolidation Support (Neckline) | $62,300 – $63,350 | Bear flag floor. Breakdown here validates the continuation pattern. |
| 🟢 Structural Support (Demand Wall) | $60,000 | Lower psychological boundary successfully defended during Iranian shock. |
| ⬇️ Primary Bearish Target (Fibonacci) | $56,800 | Base measured move projection if $62,300 breaks. |
| ⬇️ Ultimate Bearish Target / Capitulation | $41,400 – $50,000 | Full Bear Flag objective. Zone anticipated for end-of-cycle institutional accumulation. |
Two Scenarios for Late March 2026
📉 Structural Bearish Scenario (Dominant Technical Probability)
This scenario rests on the Bear Flag structure remaining intact below $72,000. Repeated rejection of the $70,000–$72,000 zone would validate the hidden RSI divergence. The loss of $62,300 would trigger a cascade of long liquidations, amplified by market makers’ gamma hedging on puts, propelling the market toward $56,800–$50,000 with a tail risk toward $41,400.
Imminent catalysts to watch: US Non-Farm Payrolls and the Fed decision on March 18, 2026. A stronger-than-expected jobs print would annihilate rate-cut hopes, strengthen the dollar, and crush risk assets.
📈 Bullish Invalidation Scenario (Institutional Flows)
For this scenario to prevail, Bitcoin must orchestrate a convincing daily close above $74,400. This would shatter the supply wall, force capitulation from structural short sellers, and propel the price toward the major invalidation level at $79,000.
Powered by a potential Fed dovish pivot (if NFP disappoints) and concrete adoption of the Clarity Act, the market would shake off the Death Cross signal — relegating it to the status of an epic « bear trap. » The massive open interest on $110,000+ calls attests to the latent — but very real — existence of these expectations for massive revaluation of the Bitcoin network.
Conclusion: The $74,400 Front Line
Bitcoin in March 2026 finds itself in a state of extreme compression. The toxic combination of a massive Bear Flag, persistent RSI divergence, and an implacable Death Cross paints a decidedly deteriorated medium-term technical picture. Yet the regulatory revolution (spot ETFs, MiCA, US executive orders) has forged institutional infrastructure of unprecedented robustness, capable of aggressively absorbing systemic shocks that, in 2018 or 2022, would have triggered immediate collapses.
The ultimate verdict belongs to $74,400: as long as this supply wall holds, probabilistic mathematics favor the completion of the bearish cycle toward $50,000. Its disintegration, however, would signal the unquestionable dawn of a new valuation regime for digital assets on a global scale.
⚠️ Disclaimer: This article is written for educational and informational purposes only. It does not constitute investment advice, a recommendation to buy or sell digital assets, or any other financial instrument. Cryptocurrencies are highly volatile and speculative assets. All investments carry risk, including the total loss of capital invested. Please consult a licensed financial advisor before making any investment decision.