
Executive Summary
In early April 2026, the global financial architecture is undergoing a period of seismic reconfiguration, placing Bitcoin (BTC) at the epicenter of a fierce battle between deteriorating macroeconomic conditions and unprecedented institutional accumulation. The market is evolving within a critical compression zone, with the price oscillating around the $66,500–$67,000 axis, attempting to consolidate a technical support base after enduring a correction of nearly 23% during Q1 2026 — the most severe quarterly decline since the crypto winter of 2018.
This pullback is unfolding against a backdrop of extreme global volatility, exacerbated by the resurgence of aggressive protectionist policies, persistent geopolitical conflicts in the Middle East, and an abrupt reassessment of US Federal Reserve monetary policy. Yet institutional fundamentals have never been stronger, creating a fascinating paradox for investors navigating these turbulent waters.
Macroeconomic Context: Three Headwinds
1. The « Liberation Day » Tariff Shock
The most immediate catalyst behind the recent contraction in risk asset valuations is the implementation of « Liberation Day » tariffs by the US administration, targeting over fifty sovereign nations with punitive rates ranging from 10% to 50%. This unilateral protectionist measure acts as a double poison: it abruptly curbs economic growth while simultaneously generating artificial inflationary pressure on imported goods — a stagflationary cocktail. The 150-day transitional period of prolonged uncertainty is pushing portfolio managers to drastically reduce risk exposure (de-risking).
2. The NFP Report and the Fed’s Grip
The release of the closely watched US jobs report (Nonfarm Payrolls) on April 3, 2026 fundamentally reconfigured the monetary policy landscape. The American economy generated 178,000 new jobs in March, with the unemployment rate falling to 4.3% from 4.4% in February — driven disproportionately by the healthcare sector (+76,000) and hospitality (+44,000).
This unexpected labor market resilience methodically eliminated hopes for a near-term accommodative pivot. The CME FedWatch Tool now assigns a 77.6% probability that the Fed will maintain its restrictive rate in the current range of 3.50%–3.75% through end of 2026. For Bitcoin, a policy stance that mechanically drains excess liquidity from the global financial system means the evaporation of purely speculative, leverage-driven demand — though structural demand for long-term fiat devaluation hedging persists and strengthens within institutional portfolios.
3. Geopolitical Tensions and Energy Crisis
Geopolitical risks are acting as a glass ceiling on market recovery. The ongoing military escalation between the US, Israel, and Iran has pushed crude oil above the $100 psychological barrier and threatens the logistical integrity of the Strait of Hormuz. More than $3.2 trillion evaporated from global equity markets in March alone, triggering cross-asset margin calls that forced the liquidation of profitable Bitcoin positions to cover losses in traditional markets. Physical gold continues its rally as the ultimate wartime sanctuary, while Bitcoin struggles to consolidate its digital gold narrative in the very short term due to its inherent volatility and algorithmic sensitivity to exogenous shocks.
Market Microstructure: Decoding the Order Book
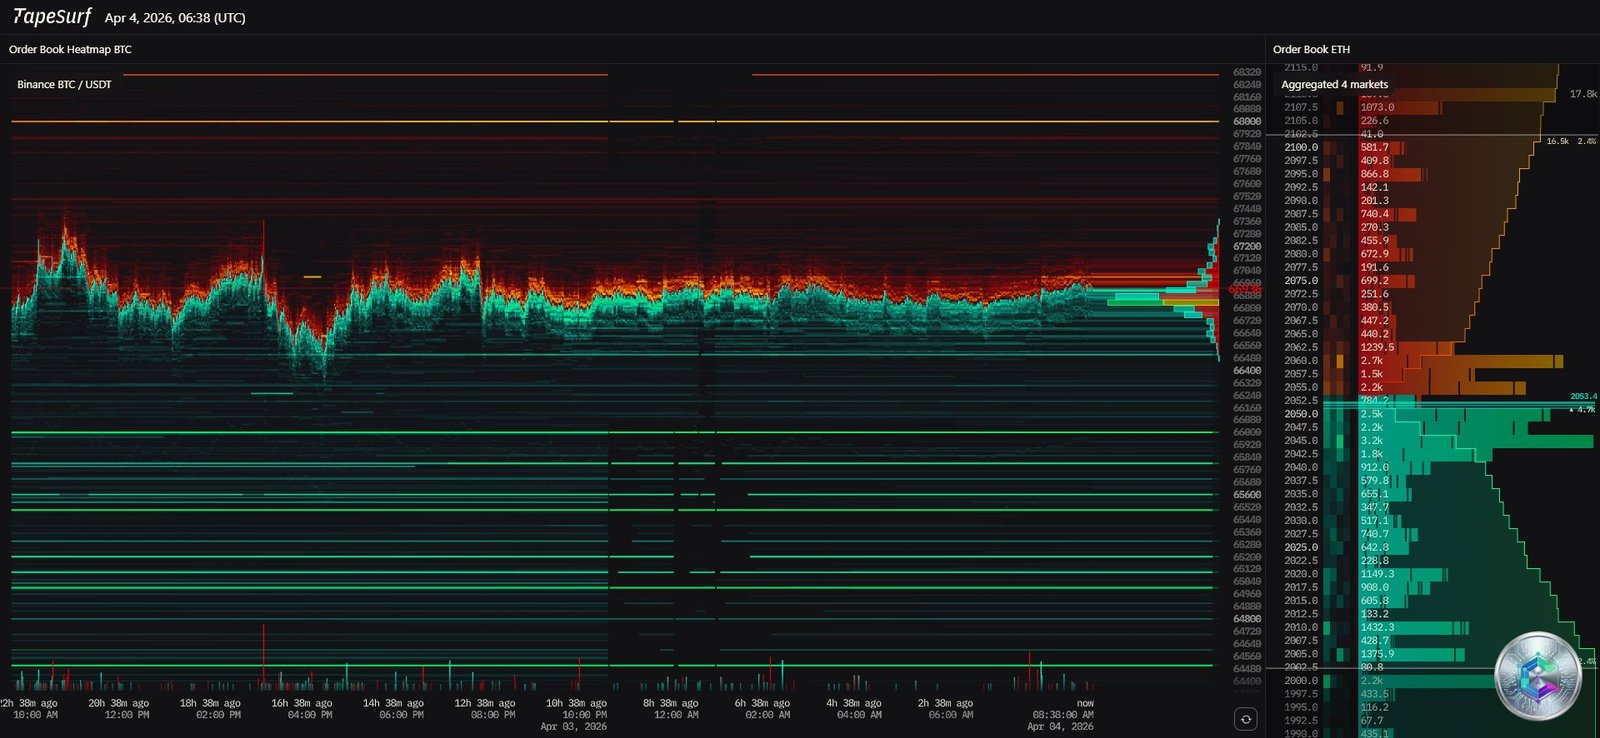
The order book heatmap analysis (BTC/USDT pair on Binance, captured April 4 at 06:38 UTC) provides a precise cartography of algorithmic player intentions and market maker behavior:
- Sell Walls (Ask Liquidity / Structural Resistance): Dense sell-side resistance forms sharply at $67,200, with a particularly thick ceiling between $67,200 and $67,400. Beyond that, sell orders accumulate in staircase fashion up to $68,000+, indicative of institutional laddered distribution strategies.
- Buy Walls (Bid Liquidity / Structural Support): A first defensive barrier sits around $66,400, followed by notable concentrations at $66,000 and $65,000. The thickest, most luminous institutional buy wall anchors at $64,800, signaling the determination of large participants to absorb any flash crash in that zone.
The Point of Control (POC) from the VPVR Volume Profile sits precisely around $66,900–$67,000, acting as a gravitational center for price action. Should buying pressure erode the $67,400 sell wall, price would traverse the ensuing « Low Volume Node » with extreme velocity, potentially triggering a violent short squeeze toward $69,000.
Technical Analysis: 15-Minute Chart
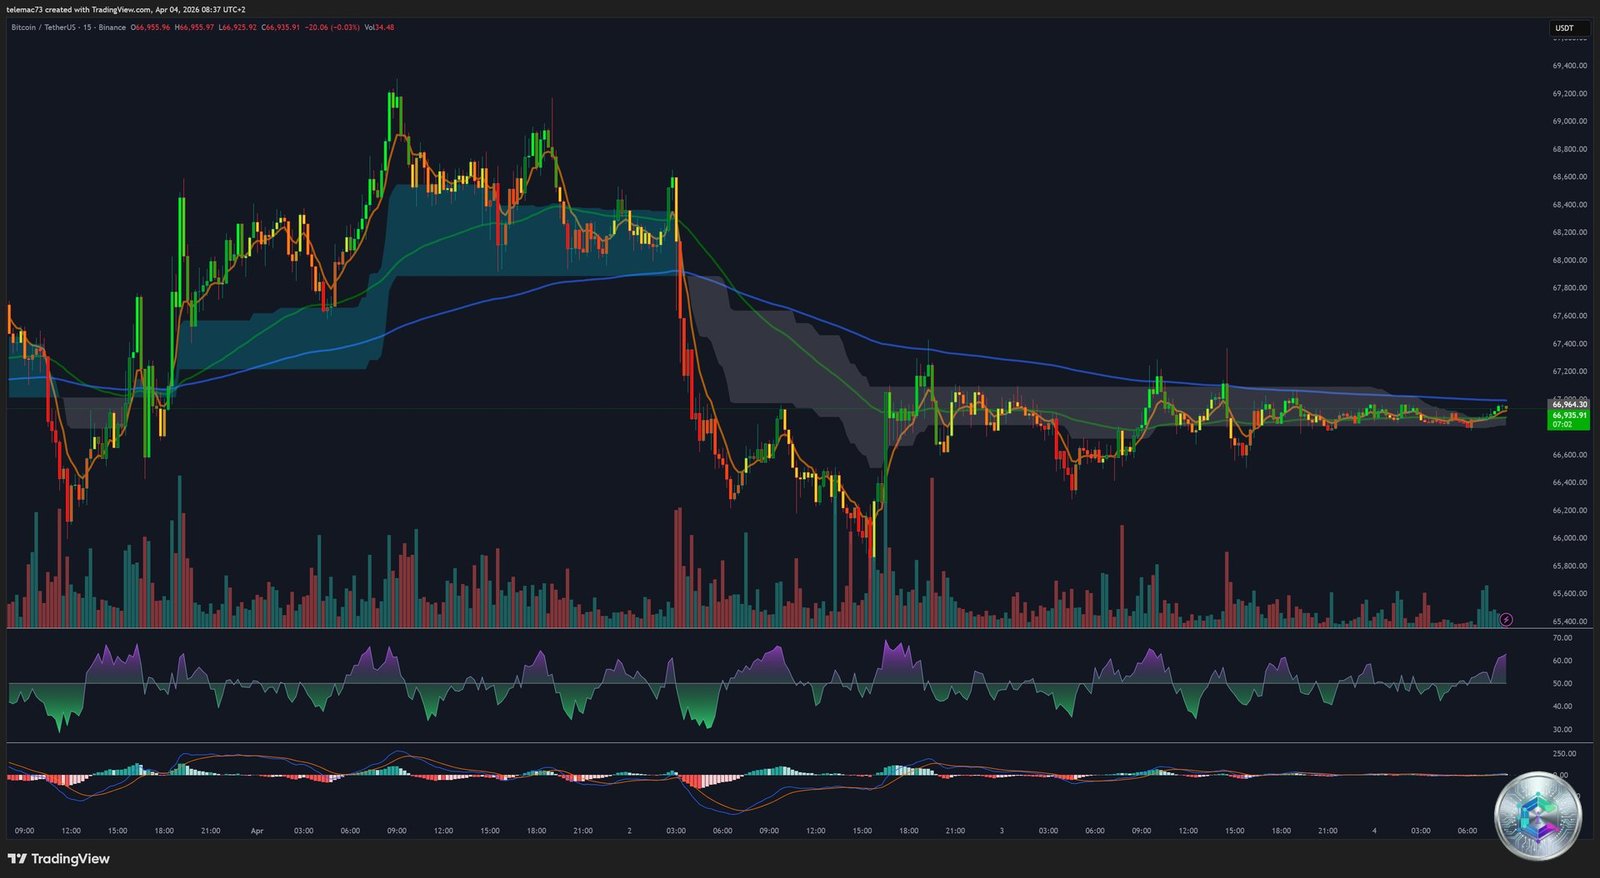
At the intraday scale, the 15-minute chart illustrates the extreme nervousness of high-frequency trading algorithms. A sharp drop is materialized by large red marubozu candles — the signature of forced liquidation or aggressive stop-order absorption below a previous local low.
Following this decline, the market entered a phase of small, horizontally aligned indecision candles: the classic visual signature of a Bear Flag formation, where the flagpole represents the initial drop and the flag represents the weak lateral consolidation attempt. Price attempts to recover but immediately collides with the lower boundary of the forming Ichimoku cloud, which acts as an impenetrable dynamic ceiling. The RSI drifts between 40–60 and the MACD is flat, confirming a market « stuck » at its Point of Control awaiting institutional volume or a macroeconomic catalyst to break the stalemate.
Technical Analysis: 4-Hour Chart
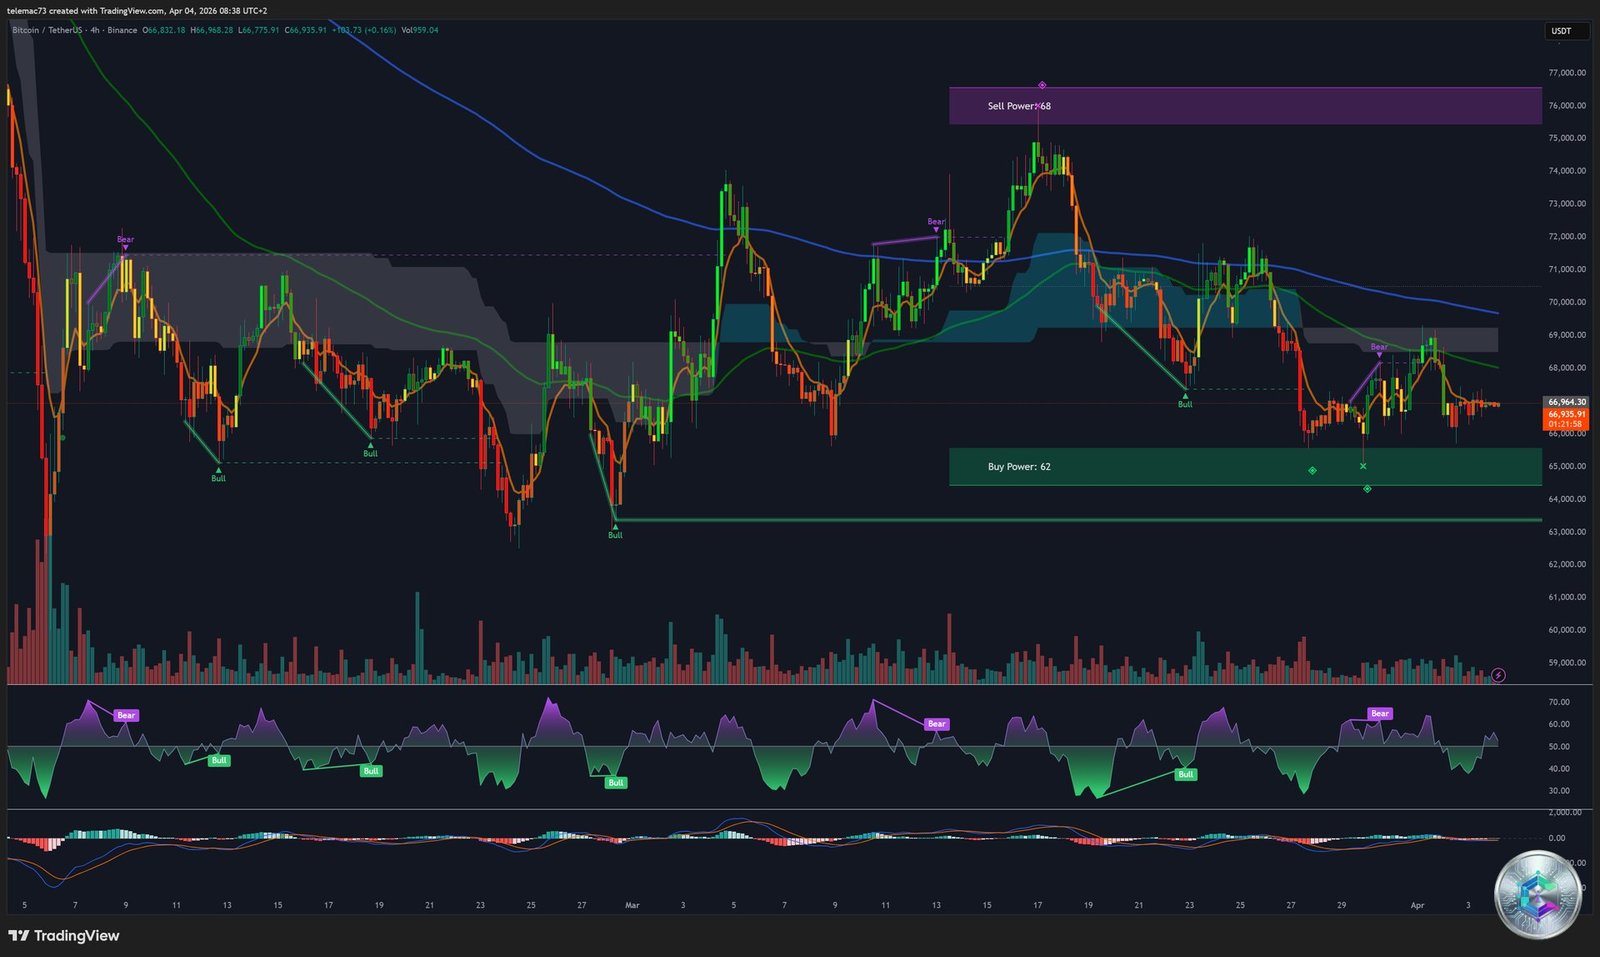
The H4 chart reveals price action in a state of tectonic compression. Bitcoin is printing a series of lower highs combined with a horizontal support level increasingly defended around $65,000. This geometry forms a descending compression triangle, which could also be interpreted as a large Bear Flag from a broader perspective.
Key power zones identified on this timeframe:
- Resistance « Sell Power > 68 »: Between $75,000 and $76,000 — the primary profit-taking target in the event of a bullish invalidation.
- Support « Buy Power: 62 »: Confirmed in the $64,000–$65,000 corridor.
A confirmed breakout (with volume) above the descending triangle resistance at $68,500–$69,000 would instantly invalidate the bearish tactical bias and trigger systematic algorithmic short-covering. Conversely, the MACD is whipsawing around the zero line with no clear directional conviction — the market is accumulating kinetic energy for its next impulsive move.
Technical Analysis: Daily Chart
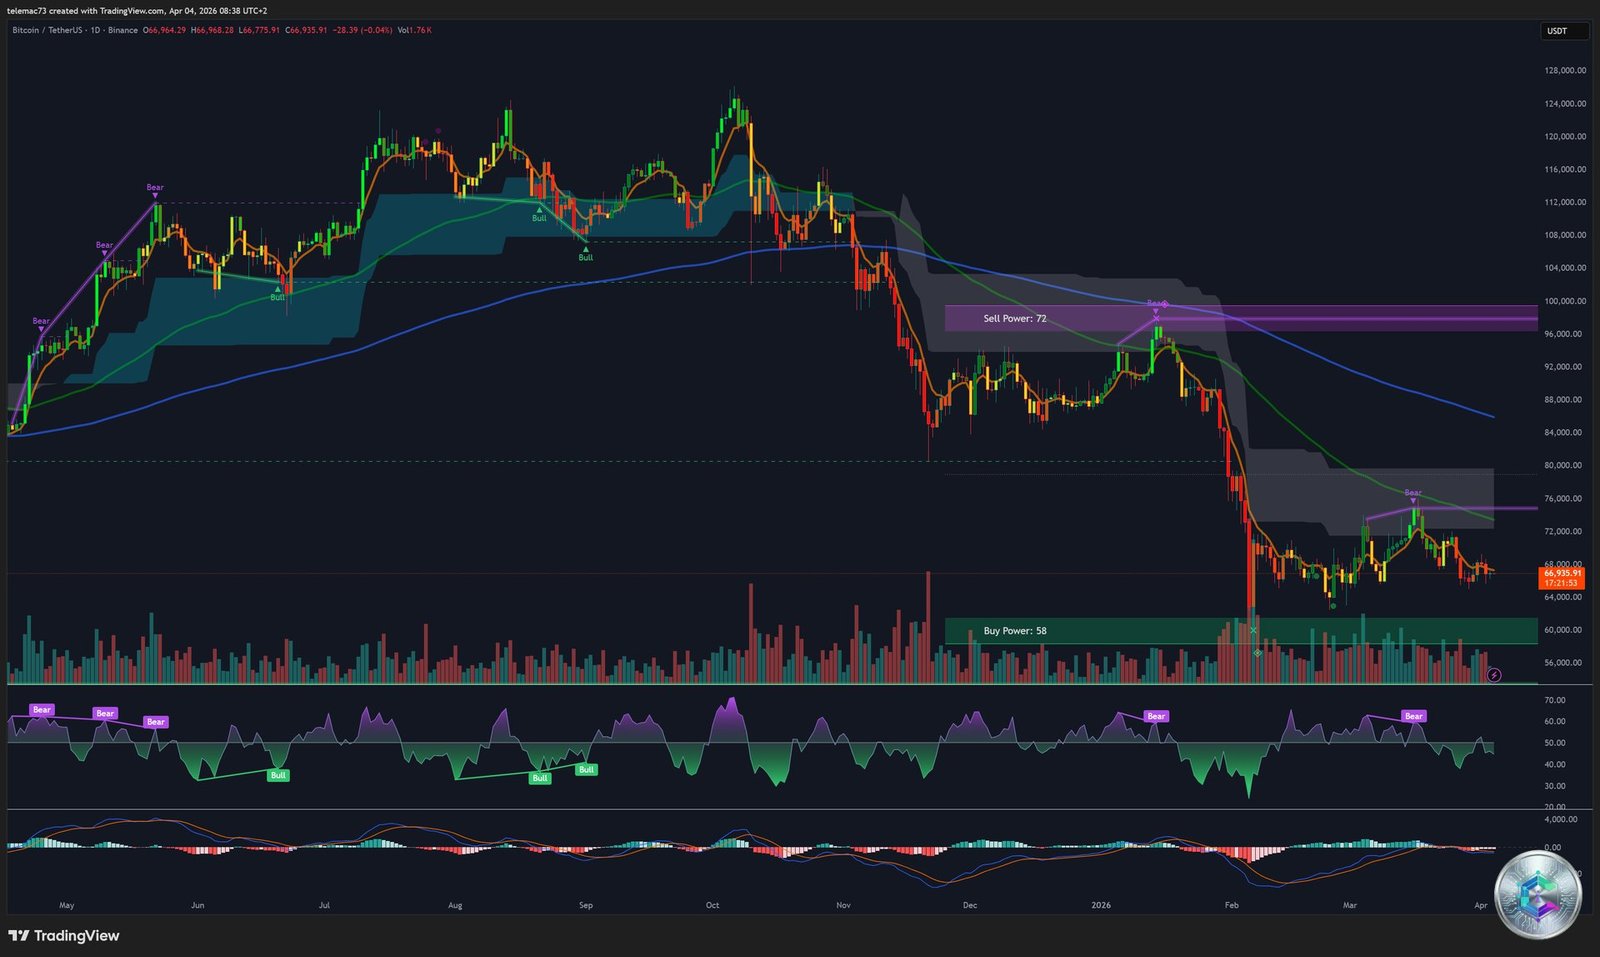
The daily chart spectacularly illustrates the deep retracement from all-time highs (~$126,000) down to the current consolidation base. The macro structure is encapsulated in a wide lateral channel with two critical zones:
- Distribution Zone (« Sell Power: 72 »): The $96,000–$100,000 band — a massive psychological and structural overhead wall where institutional selling pressure has historically converged.
- Accumulation Zone (« Buy Power: 58 »): Around the $60,000 level — a floor that has demonstrated unwavering integrity, rejecting multiple bearish breakdown attempts. This is the absolute line of demarcation between healthy consolidation and a potential deep bear market.
Ichimoku Kinko Hyo: Price is currently trading below the Kumo (cloud), dictating an undeniable macro-bearish directional bias. The cloud projected into the future reveals an extremely dense resistance zone between $80,000 and $90,000 that any medium-term recovery attempt will need to navigate.
Daily RSI: After touching extreme oversold levels (below 30) during the peak capitulation, the RSI is now in an ascending recovery phase toward the neutral 50 line. The higher lows being printed by the RSI while price consolidates horizontally constitute a classic hidden bullish divergence.
Daily MACD: The histogram has transitioned from deep red bars (intense bearish momentum) to pale pink bars approaching the zero line. The MACD lines themselves (-300.74) are converging toward what appears to be an imminent Golden Cross from deep oversold territory — historically one of the most reliable macro trend reversal signals.
On-Chain Fundamentals and Institutional Dynamics
Despite the apparent macroeconomic hostility on the surface, Bitcoin’s underlying market infrastructure is demonstrating unprecedented maturity. One of the most striking analytical findings of Q1 2026: while BTC price eroded by 23%, Spot Bitcoin ETFs absorbed a colossal $18.7 billion in net inflows during that same period of decline. This resilience has recently regained spectacular momentum in early April, with US ETFs absorbing $1.7 billion in 72 hours, dominated by massive flows into BlackRock’s IBIT fund.
With Bitcoin’s supply mathematically capped and network inflation reduced to less than 1% annually post-Halving 2024, this continuous absorption of the floating supply by ETFs is setting the stage for an unprecedented supply shock of unmatched magnitude once global macroeconomic demand stabilizes.
On the derivatives front, aggregated Open Interest (OI) has stabilized around $35 billion — highly combustible fuel for cascade liquidations upon any sudden directional move. Funding rates display +0.32% (~43.7% annualized): a structurally bullish bias maintained, but representing a healthy purge of toxic leverage compared to the extreme euphoria levels seen at the start of the year.
Market Psychology and April Seasonality
The Crypto Fear & Greed Index is navigating historic lows, oscillating between 8 and 15 (Extreme Fear) — marking 59 consecutive days of extreme psychological capitulation, the longest such sequence since the fraudulent collapse of FTX in late 2022. Yet quantitative analysis demonstrates that acquiring Bitcoin when this index drops sustainably below 15 generates positive returns over a 7-day rolling window in more than 64% of historical cases.
April seasonality also plays in favor of a bounce. Since Bitcoin’s initial monetization in 2013, April has proven to be one of the most prolific months of the year, with an arithmetic average return of +10.7% (median +7.1%). The historical precedents are compelling: +33.5% in April 2018 (post-ICO bubble burst) and +34.5% in April 2020 (post-COVID crash). The 2026 configuration — a 23% Q1 decline triggered by exogenous shocks rather than any systemic flaw in the Bitcoin network — aligns perfectly with this model of seasonal resilience.
Predictive Scenarios: Two Possible Trajectories
🟢 Bullish Scenario (Bull Case)
Trigger: Volume-confirmed breakout of the sell wall at $67,400, followed by the destruction of the H4 descending triangle resistance at $68,500–$69,000.
Targets: A confirmed daily close beyond $69,000 would invalidate the distribution structure → short squeeze toward $72,000–$73,595, with the « Sell Power » box at $75,000–$76,000 as the month-end target.
Catalysts: Unexpected US inflation cooling + April seasonality + extreme fear exhaustion.
🔴 Bearish Scenario (Bear Case)
Trigger: The defensive buy wall between $65,000 and $64,800 gets overwhelmed → H4 close below this critical threshold.
Targets: Rapid flush toward the $60,000–$62,000 macro accumulation zone. Should this institutional sanctuary fail under the weight of a severe external macro shock, Elliott Wave models project the development of a wave C correction, opening a path toward $55,000–$58,000 — a generational buying opportunity ahead of the next secular expansion phase.
Catalysts: Geopolitical escalation, global equity market panic selling, algorithmic liquidity withdrawal from the order book.
Conclusion
Bitcoin finds itself in April 2026 at a rare technical and fundamental crossroads. The convergence of historically favorable April seasonality, record institutional accumulation via ETFs, extreme fear exhaustion, and oscillator reversal signals on the daily chart paints an asymmetrically interesting picture for long-term investors. However, Fed rigidity, geopolitical uncertainty, and the descending triangle chart structure demand impeccable risk discipline. The key levels to monitor remain: $67,400 as the critical resistance and $64,800 as the absolute support floor.
⚠️ Disclaimer: This article is written for educational and informational purposes only. It does not constitute investment advice, nor a recommendation to buy or sell any digital asset or financial instrument. Cryptocurrency markets are extremely volatile and carry significant risk of capital loss. Always do your own research (DYOR) and consult a licensed financial advisor before making any investment decision.