


As of April 23, 2026, Bitcoin (BTC) trades at a pivotal crossroads. The benchmark asset of the crypto ecosystem is no longer a speculative curiosity: it has been permanently integrated into corporate balance sheets, institutional ETFs, and — a historic first — the strategic reserves of sovereign nations. This in-depth analysis maps the macroeconomic forces, institutional dynamics, and multi-timeframe technical structure shaping BTC’s trajectory at this market inflection point.
1. The Macroeconomic Backdrop: Structural Forces at Play
1.1. US Fiscal Dominance and Global Liquidity
The spring 2026 macroeconomic landscape is defined by the trajectory of the US national debt, now ranging between $38.9 and $39.0 trillion. Markets no longer perceive this expansion as a cyclical imbalance — it represents a deep structural problem of fiscal dominance. Persistent federal deficits at historically elevated levels are forcing institutional investors to fundamentally rethink portfolio construction. Bitcoin has emerged as a credible alternative in a world of relentless fiat dilution.
This fiscal pressure has driven fund managers to dramatically revise their strategic crypto allocations upward: 5 to 10% of portfolios by Q1 2026, versus only 2% in 2024. A powerful signal of accelerating institutional adoption.
1.2. The Federal Reserve, Inflation, and Real Yields
At its April 2026 meeting, the FOMC held its benchmark rate at 4.75%, supported by persistent economic resilience. Meanwhile, core CPI stood at 3.2% in March 2026 — stubbornly above the 2% target. This combination of unchanged rates and sticky inflation creates an asymmetric environment favorable to assets that cannot be debased by decree. Fed Funds futures already price in a high probability of rate cuts later in 2026, which would mechanically reduce the opportunity cost of holding non-yielding assets like Bitcoin.
1.3. Bitcoin: Digital Gold or High-Beta Tech Play?
Bitcoin’s institutionalization via spot ETFs has fundamentally disrupted its historical correlations. The 30-day rolling correlation with the S&P 500 has reached a two-year high of 0.65–0.74, far above the historical average of 0.30. Conversely, the one-year correlation with physical gold has collapsed to -0.17. The verdict: Bitcoin now behaves as a high-growth technology asset, highly sensitive to the US Dollar (DXY) dynamics and real yield movements.
| Macro Parameter | Value (April 2026) | Impact on Bitcoin |
|---|---|---|
| US Federal Debt | ~$38.9–39.0 Trillion | ✅ Structurally bullish — reinforces anti-dilution narrative |
| Fed Funds Rate | 4.75% | ⚖️ Neutral to positive — real yields under pressure |
| Core CPI | 3.2% | ✅ Positive — validates demand for scarce store-of-value assets |
| BTC / S&P 500 Correlation | 0.65–0.74 | ⚠️ Systemic risk — BTC follows equity liquidity shocks |
| BTC / Gold Correlation (1 yr) | -0.17 | 🔄 Paradigm shift — BTC no longer acts as digital gold |
2. Institutional Adoption: Game Theory at the Macro Scale
2.1. Supply Hyper-Concentration and Institutional Whales
As of April 2026, fewer than 100 entities jointly control approximately 4.2 million BTC — roughly 20% of the absolute maximum supply. This hyper-concentration structures market dynamics into distinct influence layers:
- MicroStrategy: 815,000 BTC in reserve (~3.9% of total supply). The firm recently deployed $2.54 billion in a single week to acquire additional tokens, financed primarily through $2.18B in perpetual preferred stock (STRC) carrying an 11.5% dividend yield — a remarkable feat of financial engineering.
- BlackRock IBIT: 806,000 BTC accumulated, centralizing the supply absorbed by traditional finance through ETF vehicles.
- Satoshi Nakamoto’s Wallets: ~1.1 million BTC untouched since the network’s inception, permanently reducing the tradeable float.
- ANAP Holdings (Japan): ~1,417 BTC, ranking it in Japan’s top 3 listed companies by cryptocurrency holdings.
2.2. The Race for Sovereign Reserves
Institutional adoption has crossed its ultimate frontier: geopolitical sovereignty. Saudi Arabia’s central bank announced its intention to seek direct Bitcoin exposure — a potential pivot in petrodollar management. Pakistan, Brazil, Poland, the Czech Republic, and Japan have each advanced concrete legislative proposals. Multiple US states are also pushing bills to create their own Strategic Bitcoin Reserves. Sovereign purchases are insensitive to short-term price fluctuations: they structurally drain available liquidity and amplify upside volatility potential.
3. Market Microstructure: Liquidation Heatmap & Order Books
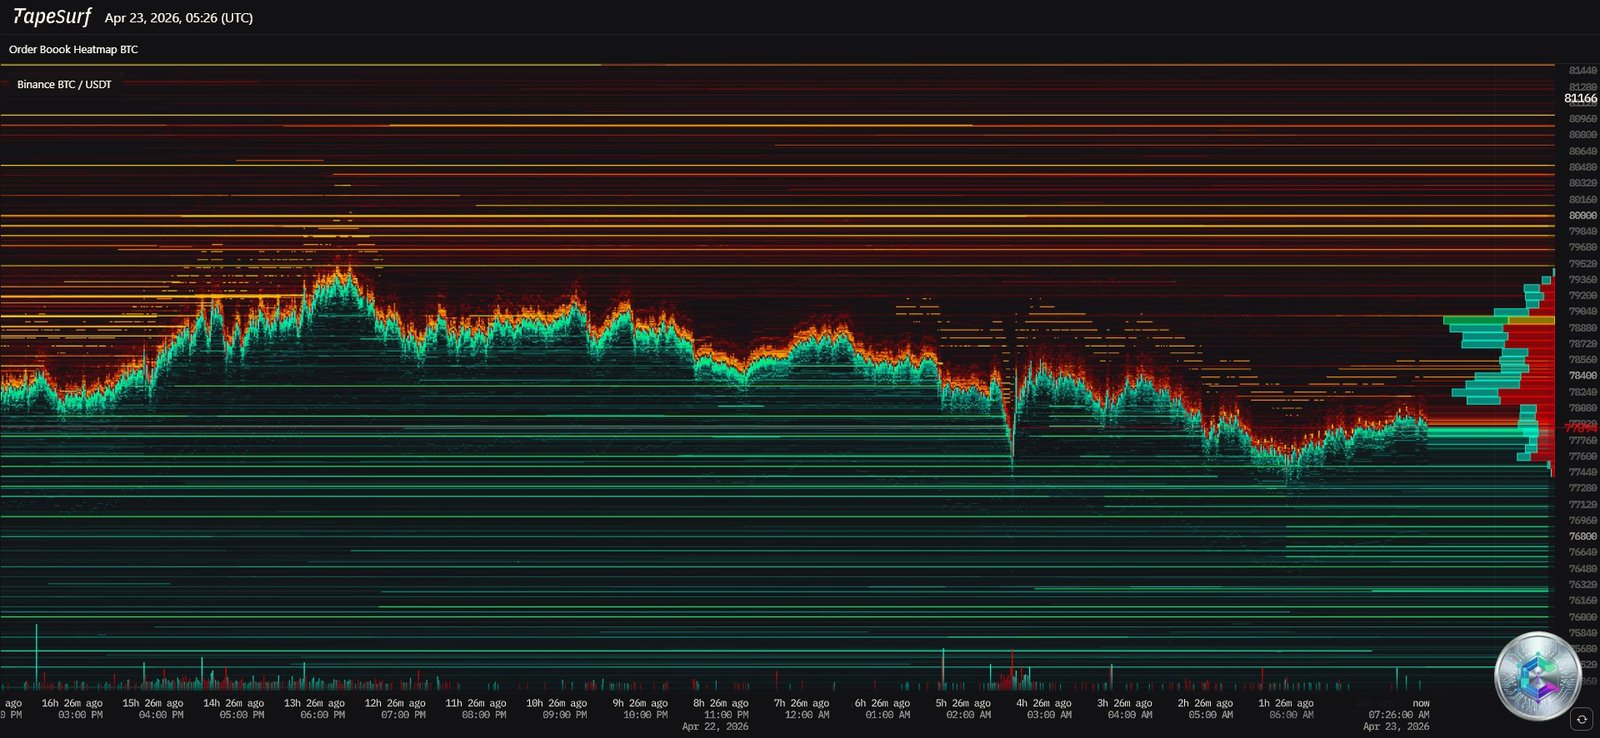
The TapeSurf heatmap covering April 22–23, 2026 provides an X-ray of market participant positioning in real time:
- Resistance wall (Ask Liquidity): A massive concentration of red/orange horizontal lines intensifies above $79,000, thickening beyond $81,000. Institutions and market makers have erected a formidable wall of limit sell orders at these levels. Only exceptional buying pressure can consume this supply reserve contract by contract.
- Support floor (Bid Liquidity): A defensive staircase of limit buy orders (Limit Buys) begins around $77,000 and densifies significantly at $76,000. Institutional operators are positioned to absorb any downside correction attempt, preventing a free-fall.
3.2. The Historic April 2026 Short Squeeze: 4,362%
Bitcoin’s surge above $79,000 was not organic spot buying — it was the mechanical result of a cataclysmic short squeeze. When BTC hit a local peak of $79,214 (its highest level since February), the liquidation imbalance reached a staggering ratio of 4,362%. Out of $34.23M in total liquidations within a single hour, an overwhelming $33.46M came exclusively from the destruction of short positions — representing 97.7% of all losses borne by bearish traders. Over 24 hours, total market liquidations approached $394.32 million.
The key catalyst: chronically negative funding rates (-0.02% while BTC was trading around $78,400). Short sellers were paying an irrational premium to maintain their bearish exposure — providing buyers with the perfect fuel to trigger an explosive chain reaction.
4. Daily Chart Analysis: The Macro Structure
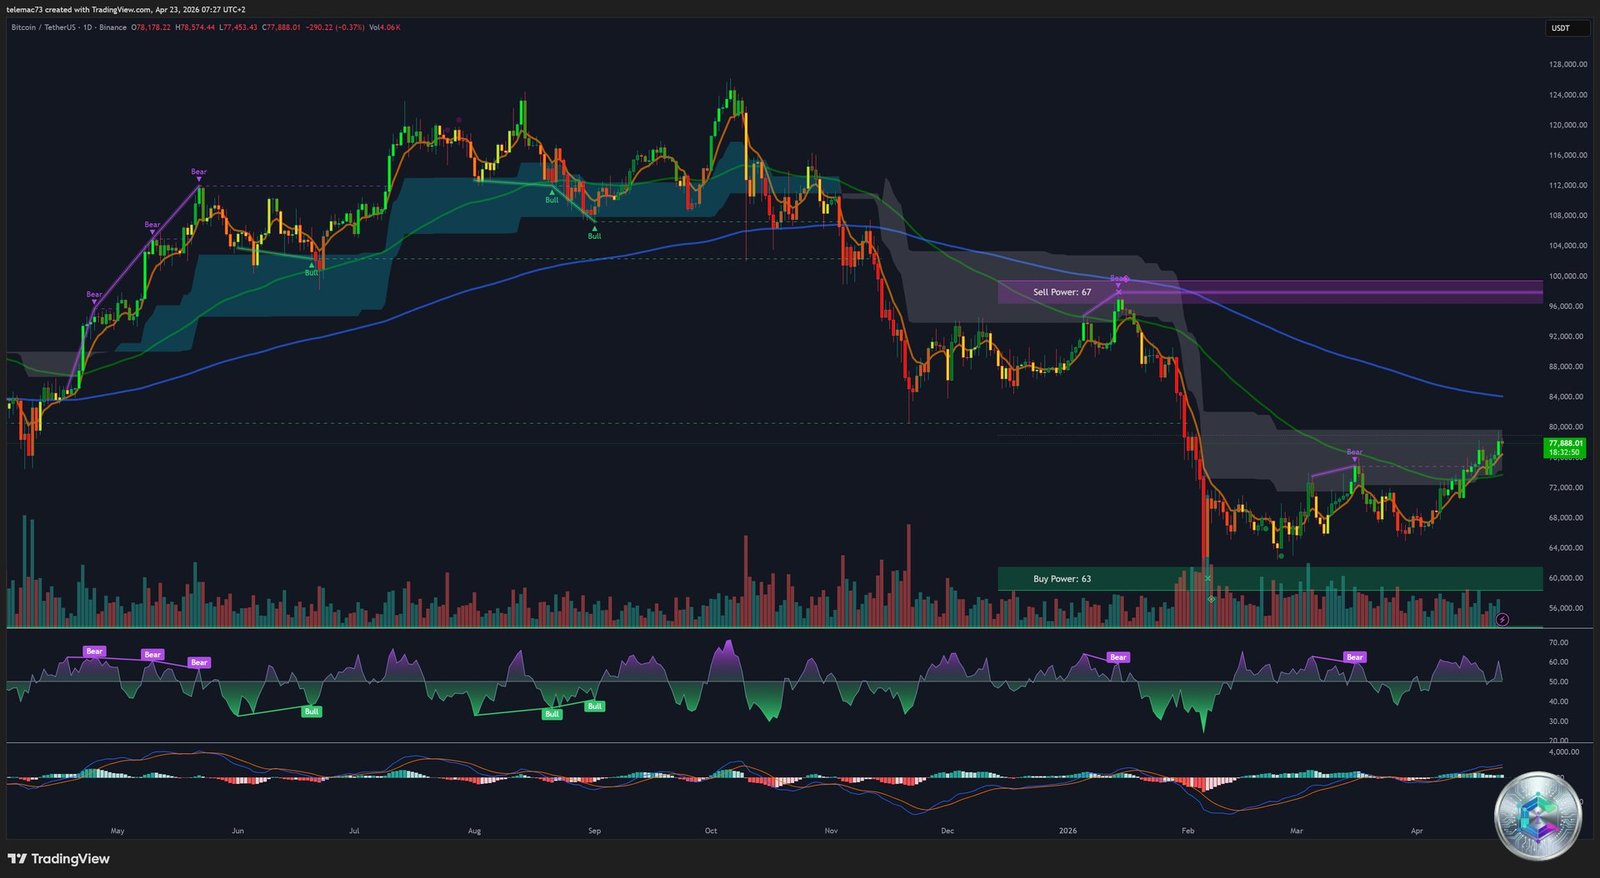
4.1. Technical Architecture and Institutional Power Zones
The daily chart reveals a structure of vast proportions. The market endured a massive collapse from historical highs (~$116,000–$120,000; ATH around $125,000 in October 2025) before finding a massive structural floor. Two liquidity blocks define the current price action:
- Buy Power: 63 anchored at ~$60,000 — the capitulation and institutional smart money accumulation zone.
- Sell Power: 67 hovering above $90,000–$100,000 — the ultimate macroeconomic target and main long-term resistance wall where trapped holders from the prior cycle peak will seek to exit at breakeven.
4.2. Moving Averages: The Decision Corridor
- SMA 200 (~$62,000): The absolute floor of this market phase. It absorbed the February shocks and continues to define the secular uptrend slope.
- MA 100 (~$75,000): A recent major pivot, having recently validated a key bounce.
- EMA 200 ($82,919): The critical dynamic resistance. The gap between current price (~$77,888) and the EMA 200 is the hallmark of a market in re-accumulation, waiting for a macro catalyst to validate a decisive breakout.
4.3. Momentum Oscillators: RSI and MACD
The 14-period RSI hovers between 54 and 58 — a neutral reading despite a +30% rally from the $60,000 lows. This confirms the advance is driven by organic momentum rather than speculative euphoria, with substantial headroom before the overbought threshold (70) triggers algorithmic profit-taking. The daily MACD shows narrowing histogram bars typical of a consolidation phase, while its lines converge toward a potential macro Golden Cross — the definitive technical signal for the onset of a new parabolic wave if confirmed.
5. 4-Hour Chart Analysis: Tactical Microstructure
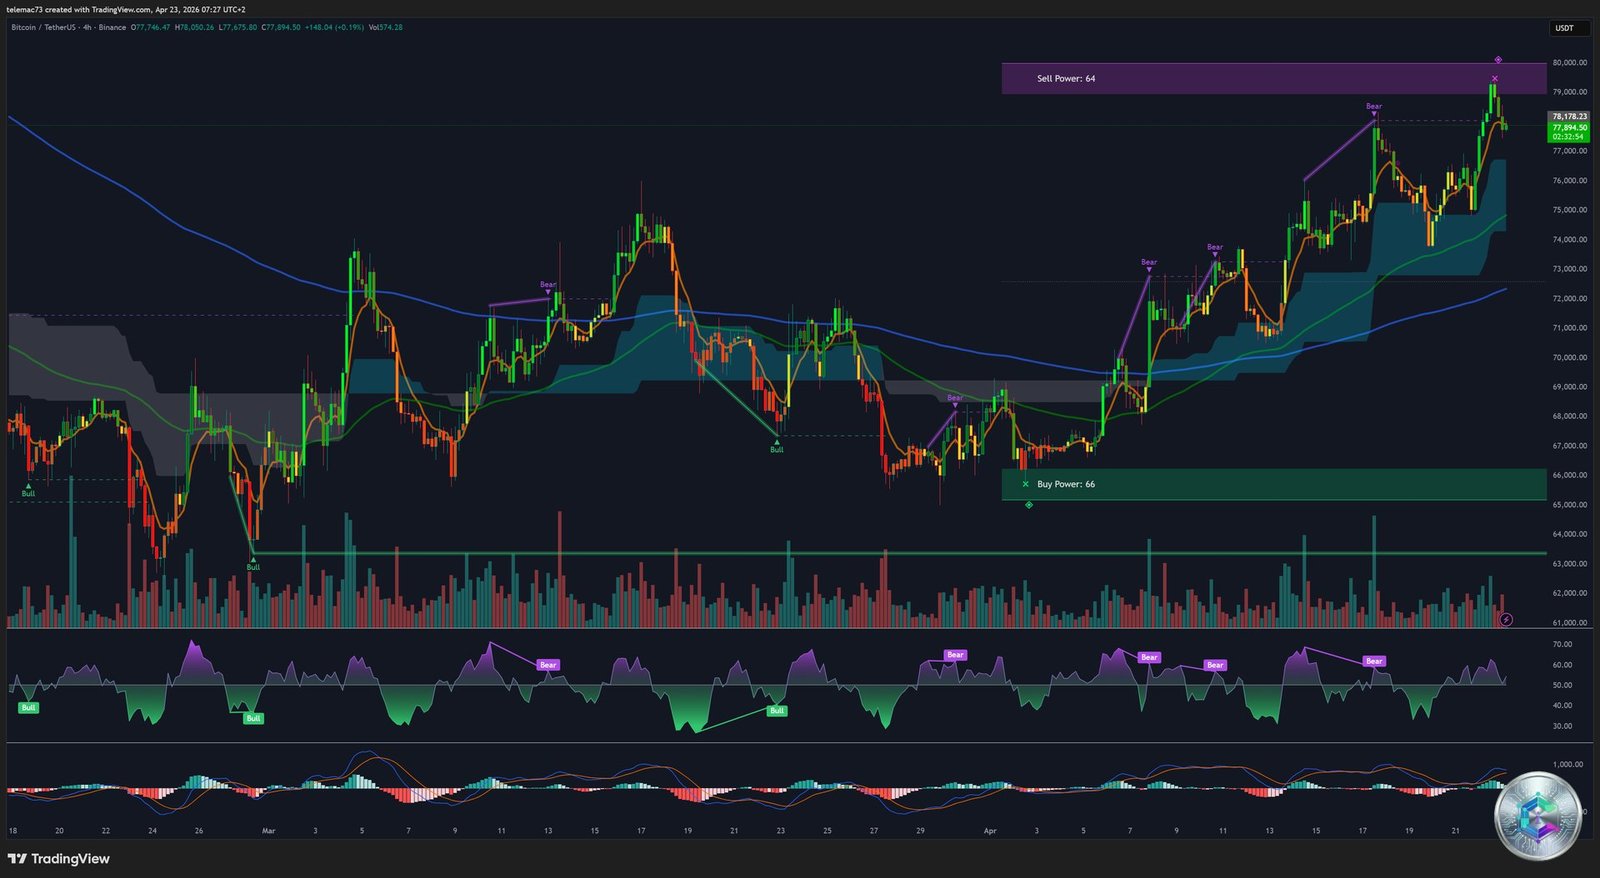
5.1. Polarity Zones and Bear/Bull Divergences
On the 4-hour timeframe (price captured at $77,894), the chart reveals exceptional analytical depth:
- Sell Power: 61 at $80,000 — an oppressive lid and major psychological resistance.
- Buy Power: 66 anchored at $65,000 — deep institutional support.
- Bearish Divergences (Bear): Price prints higher highs while the oscillator prints lower highs → exhaustion of buying momentum approaching $80,000. This signal technically validates the current consolidation.
- Bullish Divergences (Bull): During the plunge toward $65,000, the oscillator printed higher lows while price made lower lows → seller exhaustion, the precursor to the spectacular rebound that followed.
5.2. Elliott Wave 4 Triangle and The Line in the Sand
The H4 price action reveals an asymmetric Wave 4 triangle per Elliott Wave theory — a classic breathing pause before the deployment of the final and impulsive Wave 5. The lower boundary of this formation is located around $80,800 (CME futures). The absolute line in the sand for bulls is drawn at $73,832: any H4 close below this pivot would invalidate the higher-low sequence and risk triggering a long squeeze cascade. A key intermediate support formed at $75,587 (23.6% Fibonacci), conquered after two weeks of grinding pressure.
6. 15-Minute Chart Analysis: The Execution Lens
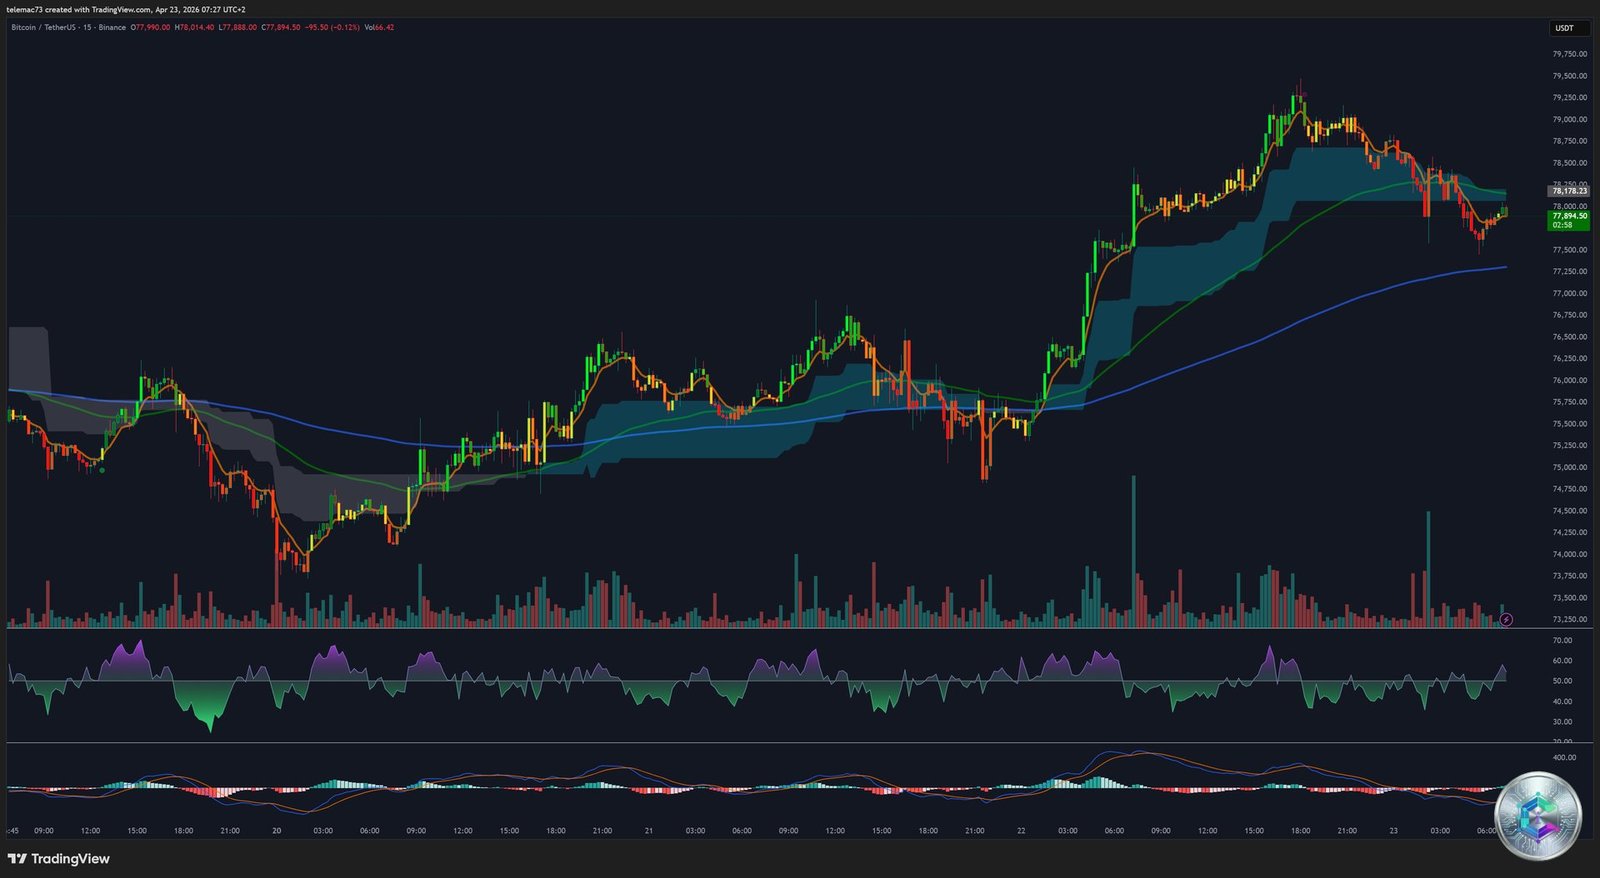
On the M15 chart (price at $77,694), Bitcoin displays the erratic behavior typical of an asset under heavy algorithmic liquidity injection. A step-ladder ascent culminates in a sharp local peak, immediately followed by an aggressive bearish candle (long upper wick, full red body) — a textbook illustration of algorithmic profit-taking the instant buy-stops above a former local high are triggered. The MACD oscillates nervously around zero with low-amplitude bars: the unmistakable visual signature of a local distribution / chop zone, where neither buyers nor sellers hold an immediate directional edge.
7. Key Price Level Map (Summary Table)
| Price Level ($) | Classification | Analysis |
|---|---|---|
| $90,000–$100,000 | 🔴 Absolute Macro Resistance | Sell Power: 67 on Daily — Final fortress before the all-time high |
| $82,919 | 🔴 EMA 200 Daily Resistance | Major technical ceiling to break — Ultimate decision pivot |
| $80,000–$81,000 | 🔴 Psychological Wall & Heatmap | Sell Power: 61 (H4) + dense red/orange sell orders on heatmap |
| $79,507 | 🟠 Fibonacci 38.2% Resistance | Macro retracement from pandemic low to all-time high |
| $76,900–$77,000 | 🟢 Tactical Support & Heatmap | Buy wall (green) on heatmap + recent polarity pivot |
| $75,587–$75,757 | 🟢 Support Confluence Zone | Short-term Fibonacci 23.6% — Reclaimed after 2 weeks of grinding |
| $73,832 | 🛑 Line in the Sand — Invalidation Pivot | Close below nullifies the higher-low sequence |
| $68,900–$72,000 | 🟢 Institutional Structural Floor | Massive on-chain accumulation — Foundation of current market structure |
| $60,000–$65,000 | 🟢 Capitulation Zone / SMA 200 | Buy Power: 63 (Daily) + SMA 200 at $62,000 — Ultimate macro support |
8. Final Synthesis and Market Outlook
Bitcoin’s ecosystem at the end of April 2026 is the theater of an exceptionally complex convergence of macroeconomic and technical factors. The asset class has definitively completed its transition to institutional maturity. It is no longer an asset people buy to escape finance — it is the asset through which finance protects itself against the systemic failure of sovereign debt.
On the fundamental side, the colossal US debt combined with a frozen monetary policy crushing real yields justifies the relentless accumulation orchestrated by corporate whales (MicroStrategy: +$2.54B in a single week) and the emergence of sovereign reserves. Bitcoin’s supply — mathematically inelastic at 21 million coins — is being continuously bled into institutional cold storage.
On the technical side, the daily structure portrays a market recovering from a prolonged bear phase, supported by the SMA 200 ($62,000) but still facing the formidable EMA 200 resistance at $82,919. A neutral RSI (54–58) and pre-expansion Bollinger Bands confirm that significant expansion potential exists without speculative hysteria. However, the H4 bearish divergences at $80,000 serve as a clear reminder that psychological barrier breakthroughs often require multiple attempts. For Bitcoin to confirm the ignition of a new parabolic cycle (Wave 5), it must imperatively defend the $73,832 support and break through the EMA 200 at $82,919 with conviction and institutional volume behind it.
⚠️ Disclaimer: This article is written exclusively for educational and informational purposes. It does not constitute investment advice, nor a recommendation to buy or sell cryptocurrencies or any other financial asset. Cryptocurrency markets are highly volatile and carry the risk of total capital loss. Always do your own research (DYOR) and consult a licensed financial advisor before making any investment decision.

