
In March 2026, Bitcoin (BTC) finds itself navigating a market configuration of rare complexity. Trading around $69,117, the asset has pulled back sharply from recent local highs at $76,000 and remains far below its all-time high of $126,000 reached in October 2025. The total cryptocurrency market capitalization stands at $2.45 trillion, with Bitcoin dominance firmly above 56.33%. This report delivers a comprehensive analysis integrating multi-timeframe chart study, liquidation heatmap reading, and macroeconomic context to decode the future direction of prices.
🌍 Macroeconomic Dynamics: The Headwinds
Geopolitics and the Flight to Liquidity
The rapid escalation of geopolitical tensions in Iran triggered a classic flight-to-safety: institutional capital has massively rotated into the US dollar. The DXY index surged more than 2% in a single week, reaching multi-month highs. This brutal appreciation of the greenback exerts mechanical deflationary pressure on all dollar-denominated assets — Bitcoin included.
The inverse correlation between the DXY and BTC has manifested clearly: during acute panic phases, capital preservation in fiat currency overrides the structural scarcity of the decentralized asset. Oil markets and Gulf infrastructure remain dominant macroeconomic variables that will continue to influence BTC’s valuation through imported inflation expectations.
Tech Sector Contagion and Margin Calls
A second major bearish catalyst hit the market: the arrest of Supermicro’s (SMCI) CEO — a central player in AI hardware infrastructure — triggered a 27% collapse in the stock within hours. This shock wave was transmitted to the crypto market through the mechanics of institutional margin calls. To raise emergency liquidity, institutions liquidate their most liquid assets available 24/7 — and Bitcoin is the preferred target.
Monetary Policy: The « Higher for Longer » Regime
The Federal Reserve maintains a restrictive monetary stance in the face of what many macroeconomists are calling « stagflation lite ». The latest FOMC dot plot signals only two potential rate cuts by end-2026, with inflation projected at 2.7% and a resilient labor market. This « higher for longer » configuration severely limits the immediate upside potential of non-yielding assets like Bitcoin.
📊 Multi-Timeframe Technical Analysis
Daily Chart — The Macro Trend
The daily chart reveals a marked deterioration in market structure. Price evolves well below the long-term moving average (descending blue curve), which now acts as an implacable dynamic resistance. Every bullish breakout attempt is systematically rejected, confirming that the market is firmly anchored in a bear market or a deep multi-month correction.
Two critical algorithmic liquidity zones stand out: a massive sell band (« Sell Power: 72 ») between $96,000 and $104,000, and a major institutional support (« Buy Power: 58 ») around $60,000. The daily MACD is deeply anchored in negative territory, with no significant bullish divergence visible at this stage.
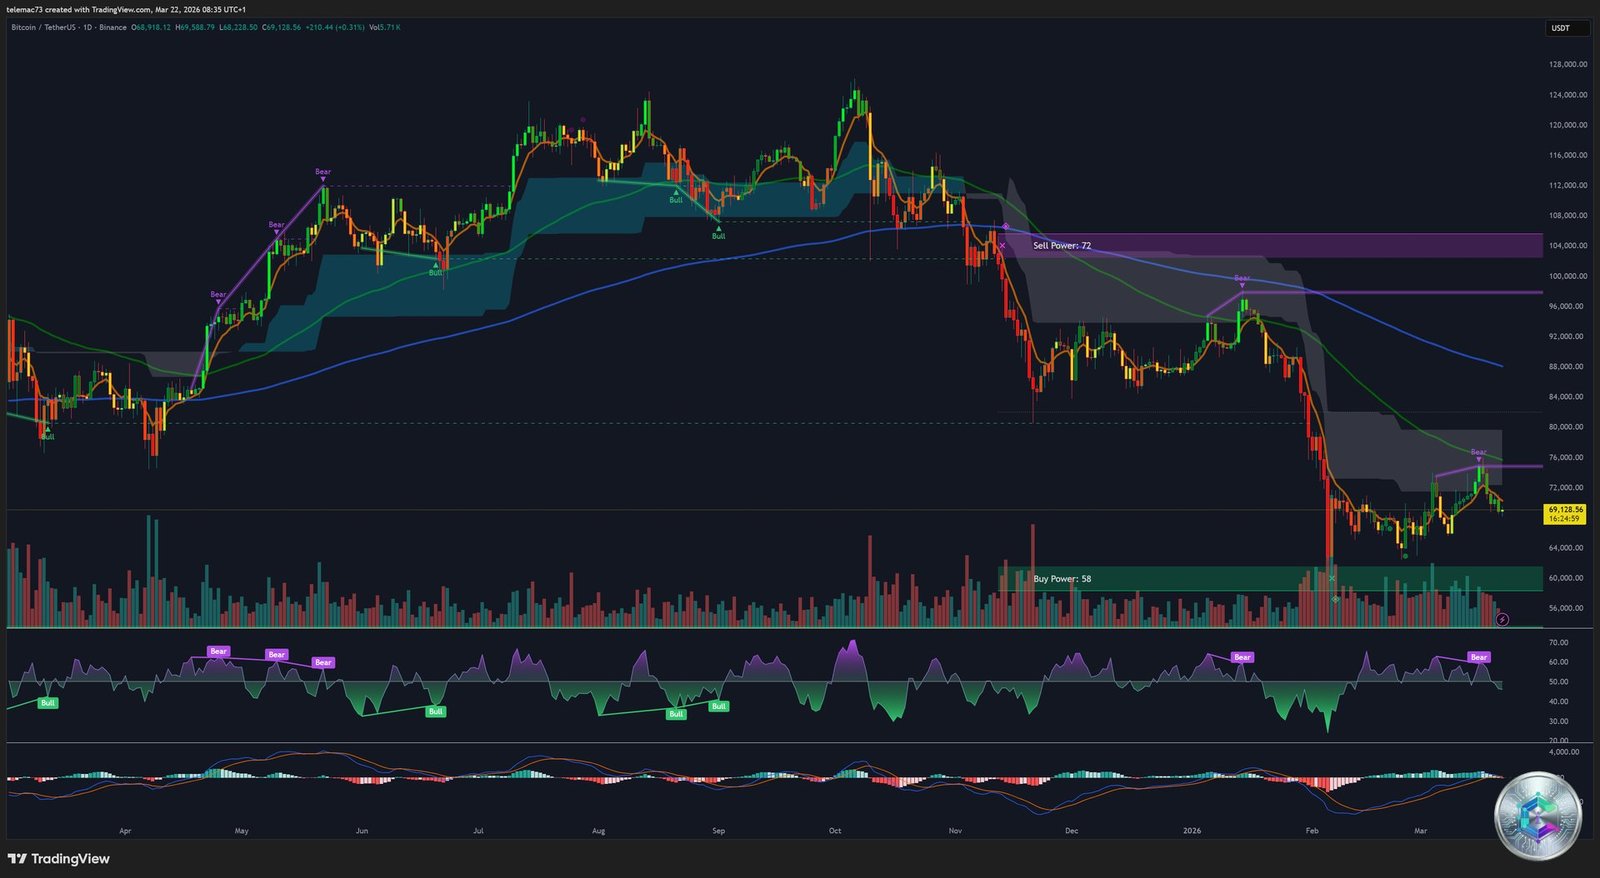
The Elliott Wave Thesis: Heading to Wave V?
Applying Elliott Wave Theory to the macro structure suggests Bitcoin recently completed Wave IV (corrective bounce) and is now engaged in Wave V, the final leg of this purge sequence. Fibonacci extensions project a critical « V-Recovery Zone » between $52,000 and $54,073. A major RSI bullish divergence at that zone would signal a genuine macro reversal.
4-Hour Chart — Medium-Term Dynamics
On the 4H timeframe, Bitcoin depicts a market in acute compression. The most striking charting element is the formation of a massive Bear Flag. Price is smothered beneath a thick resistance cloud, with a sell zone (« Sell Power: 67 ») threatening at $75,000 and critical support (« Buy Power: 63 ») around $64,000.
The 4H MACD displays a clear Death Cross: the fast line crossed below the slow signal line, and the histogram plunges into the red. The RSI prints progressively lower highs, confirming the continuous degradation of relative strength. If the bear flag breaks downward, the mathematical projection targets $40,000 — a total correction of ~69% from the highs, perfectly in line with the historical cyclicality of post-halving purges.
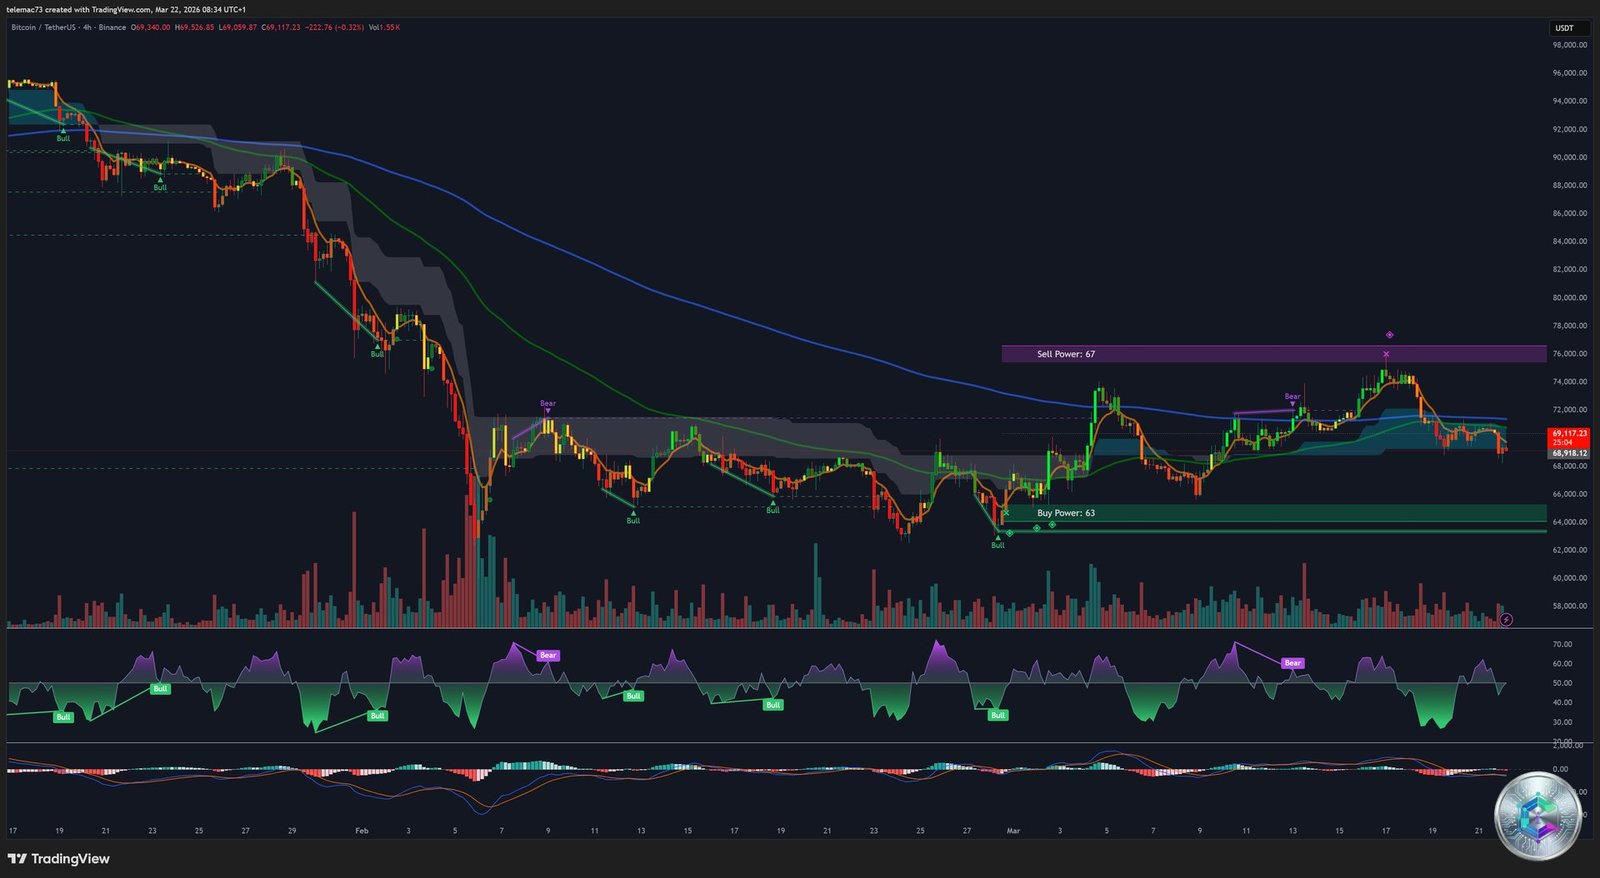
The Counter-Thesis: The Micro Bull Flag
On the other side, a more granular microstructure reading identifies a short-term Micro Bull Flag. A healthy horizontal consolidation (Inside Bar formation) suggests supply absorption without aggressive institutional distribution. A confirmed breakout above the local channel would project price toward a relief zone between $80,000 and $85,000. However, even if this plays out, the macro structure would remain technically bearish (bear market rally).
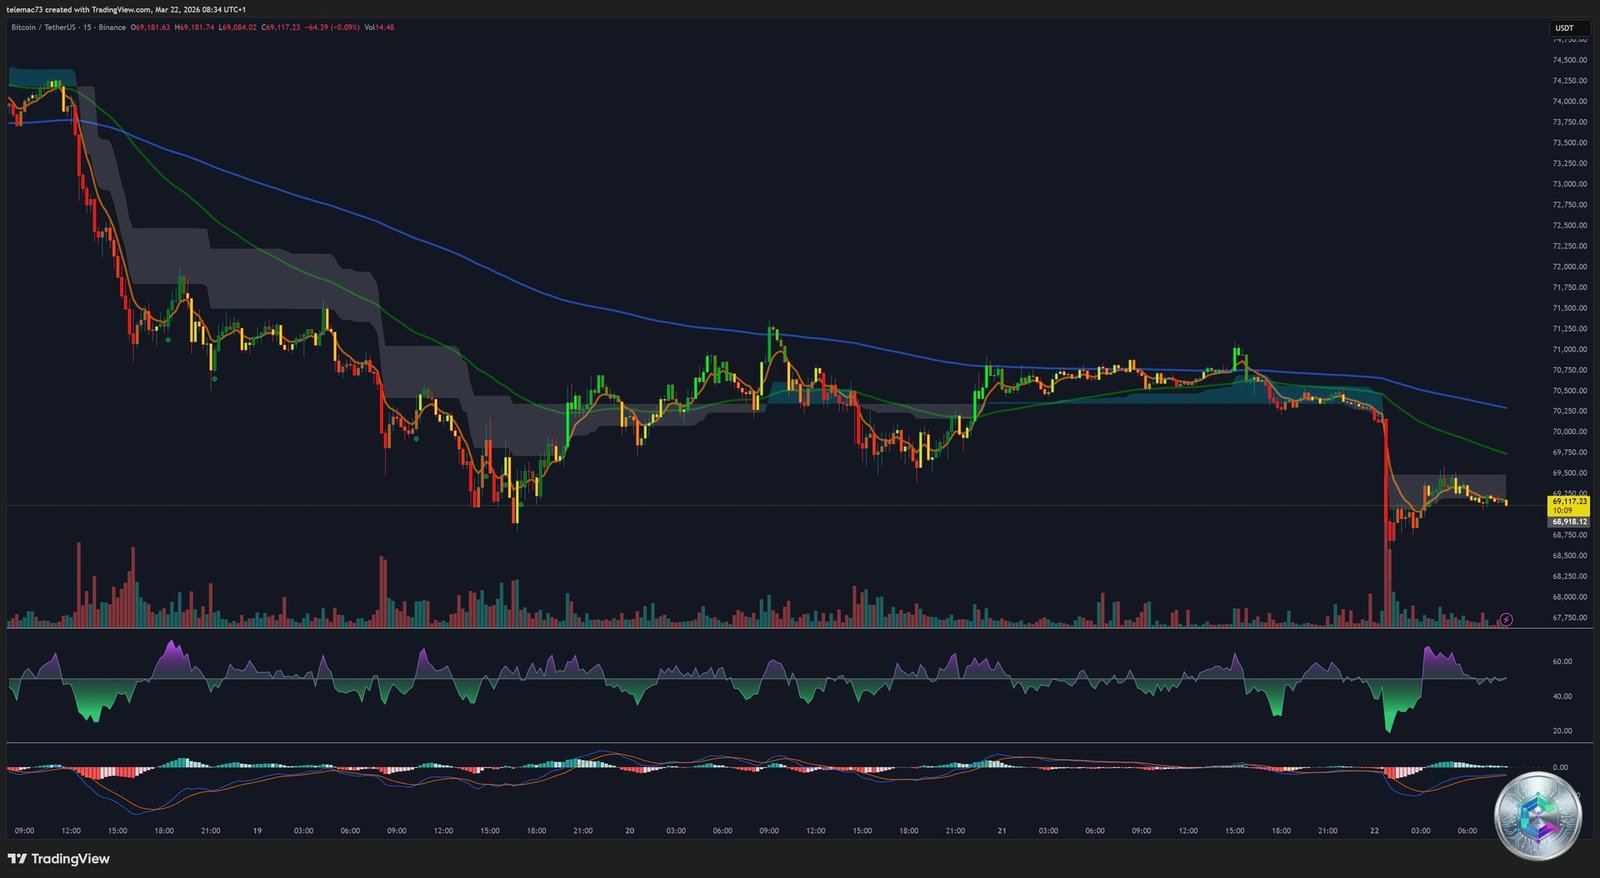
15-Minute Chart — Intraday Microstructure
The 15-minute chart illustrates the intensity of high-frequency algorithmic trading. A massive red candle (long bearish marubozu) evidences a cascade of long position liquidations. Following this violent drop, price attempts to form a compression pennant under the resistance cloud. The RSI, having plunged into extreme oversold territory, is beginning to recover — signaling that immediate selling pressure is exhausting. The 15-minute MACD shows a bullish convergence attempt, hinting at a potential technical mean reversion bounce.
🔥 Order Flow & Liquidation Heatmap
In a market where derivatives account for up to 80% of total volume, classical chart analysis must imperatively be supplemented by Order Flow and Liquidation Heatmap study — tools that map the vulnerability of financial leverage.
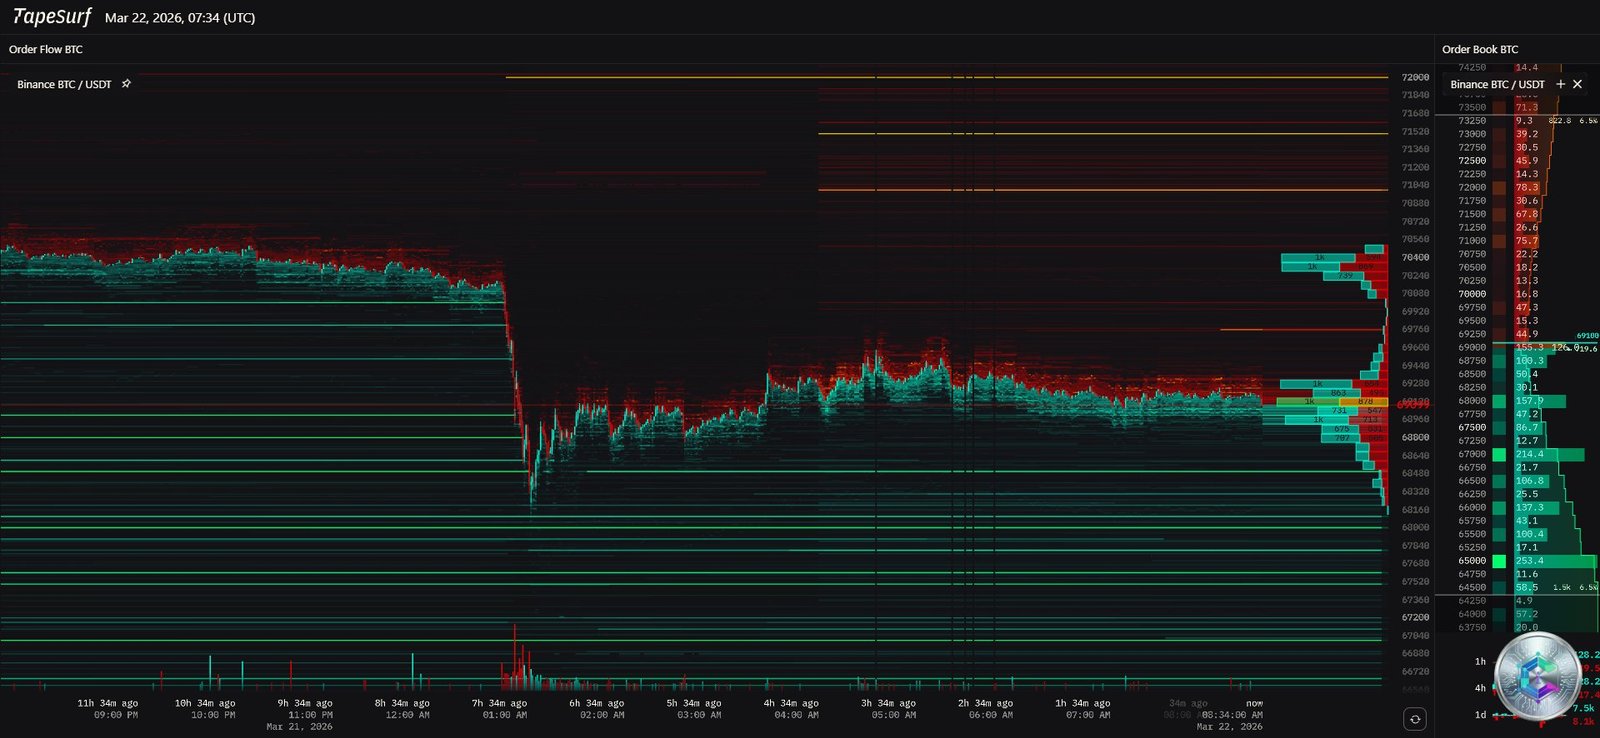
The TapeSurf capture from March 22, 2026 reveals an eloquent market architecture. A succession of massive sell walls (thick red and orange bars) blocks any upside attempt at the levels of $70,000, $71,000, $72,000, and $74,000. Below the current price, buy walls (green and cyan blocks) are located primarily around $67,000, with deeper pockets extending toward $60,000.
Short Squeeze Risk vs. Long Cascade Peril
⚠️ Short Squeeze Risk
The $72,000–$74,500 zones concentrate stop-losses of thousands of leveraged shorts (25x to 100x). An unexpected bullish impulse would trigger a cascade of forced buy orders — the feared Short Squeeze.
⚠️ Long Cascade Peril
Below $68,000, clusters of long liquidations stretch down to $64,500. A confirmed break would trigger an algorithmic flash crash that could send price toward $54,000.
🔗 On-Chain Metrics: The Fundamental Divergence
Fear & Greed Index at 10 — Extreme Fear
The Fear & Greed Index recently plunged to a catastrophic reading of 10/100, signaling an « Extreme Fear » phase. This systemic pessimism reflects the total emotional capitulation of retail investors. Paradoxically, from a behavioral finance perspective, such levels statistically coincide with the most asymmetrically profitable buying opportunities over the medium and long term.
Supply Shock: Silent Whale Accumulation
While price consolidates, institutional accumulation accelerates. The number of « shark and whale » addresses increased by 3.9% last quarter. Even more telling: Bitcoin reserves on centralized exchanges have dropped to their lowest level since 2018, at approximately 2.7 million BTC. This massive withdrawal to cold storage — notably by MicroStrategy, now holding 761,068 BTC — creates a structural Supply Shock. Any resurgence in demand will meet an extremely inelastic supply wall, amplifying any upside price impact.
📐 Daily Pivot Points (March 22, 2026)
| Method | S2 (Major Support) | S1 (Minor Support) | Central Pivot | R1 (Minor Resistance) | R2 (Major Resistance) |
|---|---|---|---|---|---|
| Classic Pivot | $68,677 | $68,823 | $68,956 | $69,102 | $69,236 |
| Fibonacci | $68,784 | $68,850 | $68,956 | $69,063 | $69,129 |
| Camarilla | $68,918 | $68,943 | $68,956 | $68,994 | $69,020 |
| Woodie | $68,680 | $68,829 | $68,960 | $69,108 | $69,239 |
A remarkable convergence of supports forms in the $68,544–$68,943 zone, acting as a short-term reinforced concrete floor. An hourly close below $68,500 would invalidate the neutral consolidation thesis and open the path toward $64,560. On the upside, the key level to watch is the historical polarity zone at $74,450 — a former support now transformed into a major resistance.
🎯 Probabilistic Scenarios
🔴 Bearish Scenario — Elliott Wave V Extension
Trigger: a daily close below $68,000 on heavy volume. The long liquidation cluster would push price toward $64,560, then toward the Elliott Wave V target at $52,000–$54,000. At that level, institutional buying would become near-inevitable, marking the genuine cycle bottom.
🟡 Consolidation Scenario — Range $68K–$74K
Geopolitical stabilization and sustained « stagflation lite. » Bitcoin would remain trapped in a $68,000–$74,000 range, characterized by choppy volatility and regular algorithmic stop hunts. Whale accumulation would continue silently via OTC deals and dark pools, laying the invisible foundations for the next super-cycle.
🟢 Bullish Scenario — Short Squeeze and Trend Recovery
Mandatory condition: a firm daily close sustained above $74,450. This breakout would ignite the dense short squeeze wall at $72,000–$74,500, propelling Bitcoin toward $80,000–$85,000 in a first ballistic impulse. A confirmed break above $75,000 by spot flows would mechanically trigger FOMO among retail cohorts, refueling the speculative engine for a final ascent toward prior all-time highs.
💡 Conclusion
Bitcoin stands at a genuine crossroads in March 2026. The immediate technical reading commands absolute institutional caution: bear flag, negative MACD, dynamic resistances. Yet on-chain metrics paint a radically opposite fundamental portrait — historical supply shock, whale accumulation, Fear & Greed at 10. The outcome of this violent macroeconomic volatility compression will determine Bitcoin’s valuation trajectory for the rest of the decade.
Key levels to watch: Critical support $68,000 | Intraday pivot $68,956 | Major resistance $74,450 | Extreme bearish target $52,000–$54,000 | Bullish target $80,000–$85,000
⚠️ Disclaimer: This article is written exclusively for educational and informational purposes. It does not constitute investment advice, a recommendation to buy or sell digital assets, or any solicitation to invest. Cryptocurrency markets are extremely volatile and carry significant risks of capital loss. Always conduct your own research and consult a qualified financial advisor before making any investment decisions.