
Introduction: A Market at the Confluence of Major Shocks
The global financial ecosystem is navigating a period of exceptional turbulence, redefining classic paradigms of asset allocation and risk management. As of March 19, 2026, Bitcoin (BTC) stands at the confluence of major geopolitical shocks, restrictive monetary policy, and institutional adoption of unprecedented scale.
BTC is trading in an environment of extreme volatility, having recently fallen from a local peak near $76,000 to levels below $70,000 — a market torn between systemic macroeconomic fear and frenzied institutional accumulation.
1. The Global Macroeconomic Backdrop
Geopolitics and Oil: The Barrel’s Fuse
The primary catalyst for this structural instability is the dramatic escalation of geopolitical tensions in the Middle East, involving Iran, Israel, and Western powers. This crisis has caused significant disruption to the Strait of Hormuz — a vital maritime artery through which roughly 20% of the world’s crude oil and LNG normally transits. Brent crude futures have violently rebounded above $105 per barrel, fueling persistent inflationary risk that forces central banks to urgently reconsider their monetary easing trajectories.
The Fed Goes Hawkish: Rates Frozen at 3.50%–3.75%
In this context of potential stagflation, the Federal Reserve adopted a resolute hawkish stance at the FOMC meeting of March 17–18, 2026. The probability of an imminent rate cut has completely evaporated: markets price in a 99% chance of a strict pause, keeping the federal funds rate in the restrictive range of 3.50%–3.75%. Any upward revision to the quarterly « dot plot » carries the potential to violently reprice risk assets across the board, cryptocurrencies included.
The Debasement Trade: Bitcoin as Digital Gold
Paradoxically, this anxiety-inducing environment has significantly accelerated the « debasement trade. » Faced with paralyzed fiscal policy, abyssal deficits, and the inevitable erosion of fiat purchasing power, institutional investors are massively rotating into assets with absolute mathematical scarcity. Bitcoin reaffirms its status as digital gold, its performance often reflecting and amplifying the bullish trend in physical gold. Some analysts project extreme scenarios: gold at $35,000/oz and Bitcoin at $750,000 in the wake of a systemic crash in traditional markets.
2. Institutional Dynamics and the Supply Shock
The Bitcoin market in March 2026 is structurally distinct from previous bull cycles (2017, 2021), now dominated by institutional buying pressure that is largely inelastic to short-term price fluctuations. Despite a correction of roughly 44% from the October 2025 cycle peak of $126,000, institutional conviction remains unshakeable.
Spot ETFs: $767 Million in a Single Week
US spot Bitcoin ETFs recorded six consecutive days of net inflows, totaling nearly $1 billion since March 9th. For the week ending March 13, 2026, these vehicles captured $767 million, spectacularly reversing a five-month trend of net outflows that had drained over $4 billion from the market. BlackRock’s IBIT and Fidelity funds are leading this charge, demonstrating that major wealth managers are deliberately using geopolitical drawdowns to accumulate digital collateral at a discount.
MicroStrategy and Metaplanet: Black Holes of Supply
MicroStrategy recently acquired an additional 22,337 BTC for $1.57 billion at an average execution price of $75,696/BTC, bringing their total strategic reserves to 761,068 BTC (over $50 billion at current prices). In parallel, Japanese investment firm Metaplanet raised $255 million from global institutional investors, targeting a total of $531 million dedicated exclusively to ongoing Bitcoin accumulation.
Bitfinex analysts estimate institutional buyers are currently absorbing nearly five times the amount of Bitcoin produced daily by miners. Over 47,000 BTC (~$3.2 billion) were withdrawn from centralized exchanges in a single week, relocated to cold storage for long-term holding.
3. Order Book Analysis: The Liquidity Heatmap
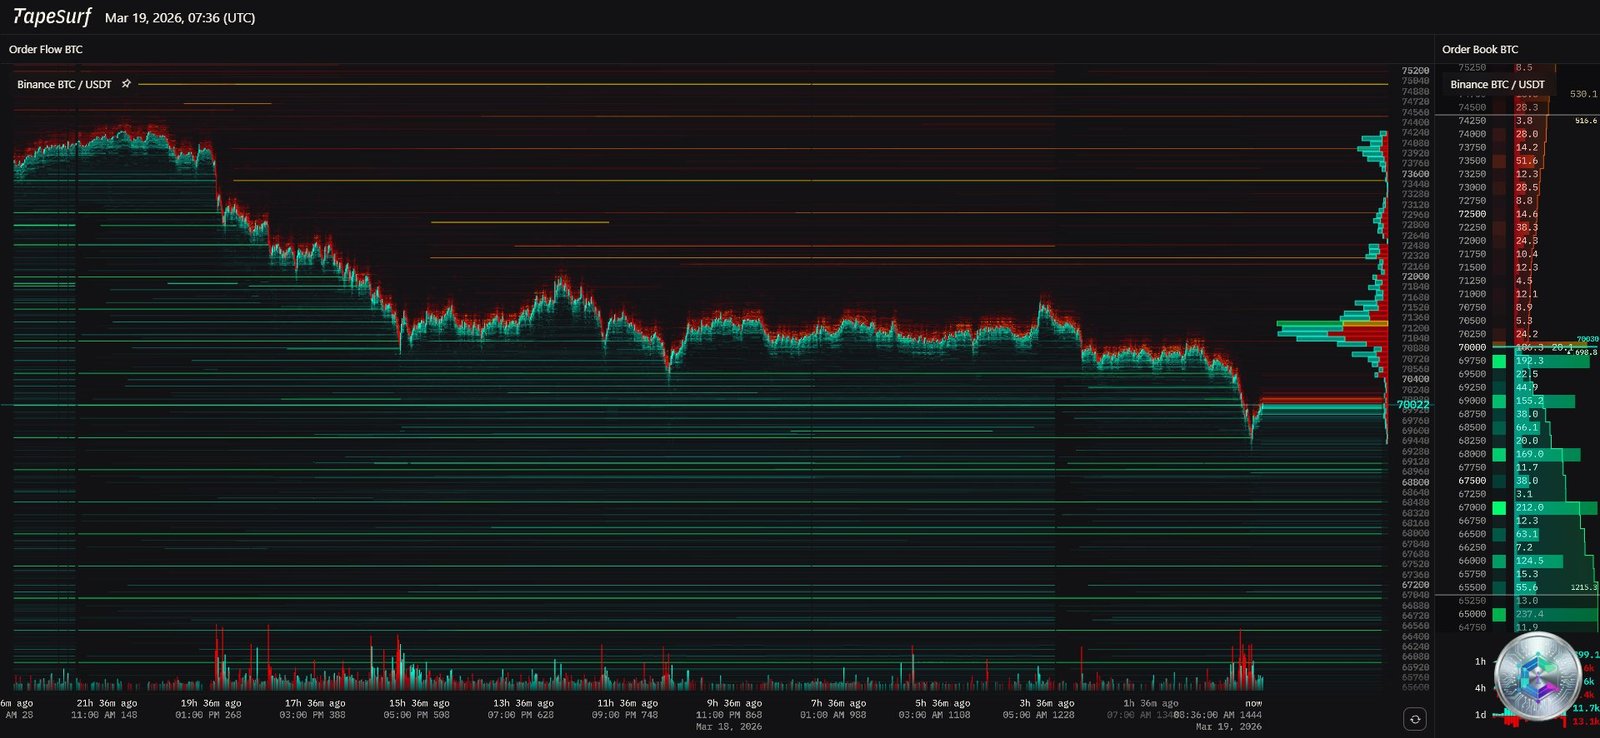
Analysis of the order book heatmap provides a real-time X-ray of the intentions of high-frequency trading algorithms and market makers.
The chart reveals a starkly asymmetric liquidity distribution: above the current price (~$69,822), a dense wall of sell orders extends from $72,000 up to $75,000, forming a near-impenetrable « sell wall » in the short term. Below, buy blocks are positioned around $68,000 and further down near $65,000, but with significantly lower density.
| Zone | Price Level | Liquidity Density |
|---|---|---|
| Extreme Resistance | $73,000 – $75,000 | 🔴 Very High (sell wall) |
| HVN / Transition Zone | $70,000 – $73,000 | 🟠 Moderate to High (broken to the downside) |
| Current Price | ~$69,822 | ⚪ Low (price discovery in progress) |
| Primary Support | $68,000 – $69,000 | 🟢 Moderate (technical bounce possible) |
| Secondary Support | $64,000 – $65,000 | 🟡 Low to Moderate (safety net) |
4. Technical Analysis: Daily Chart
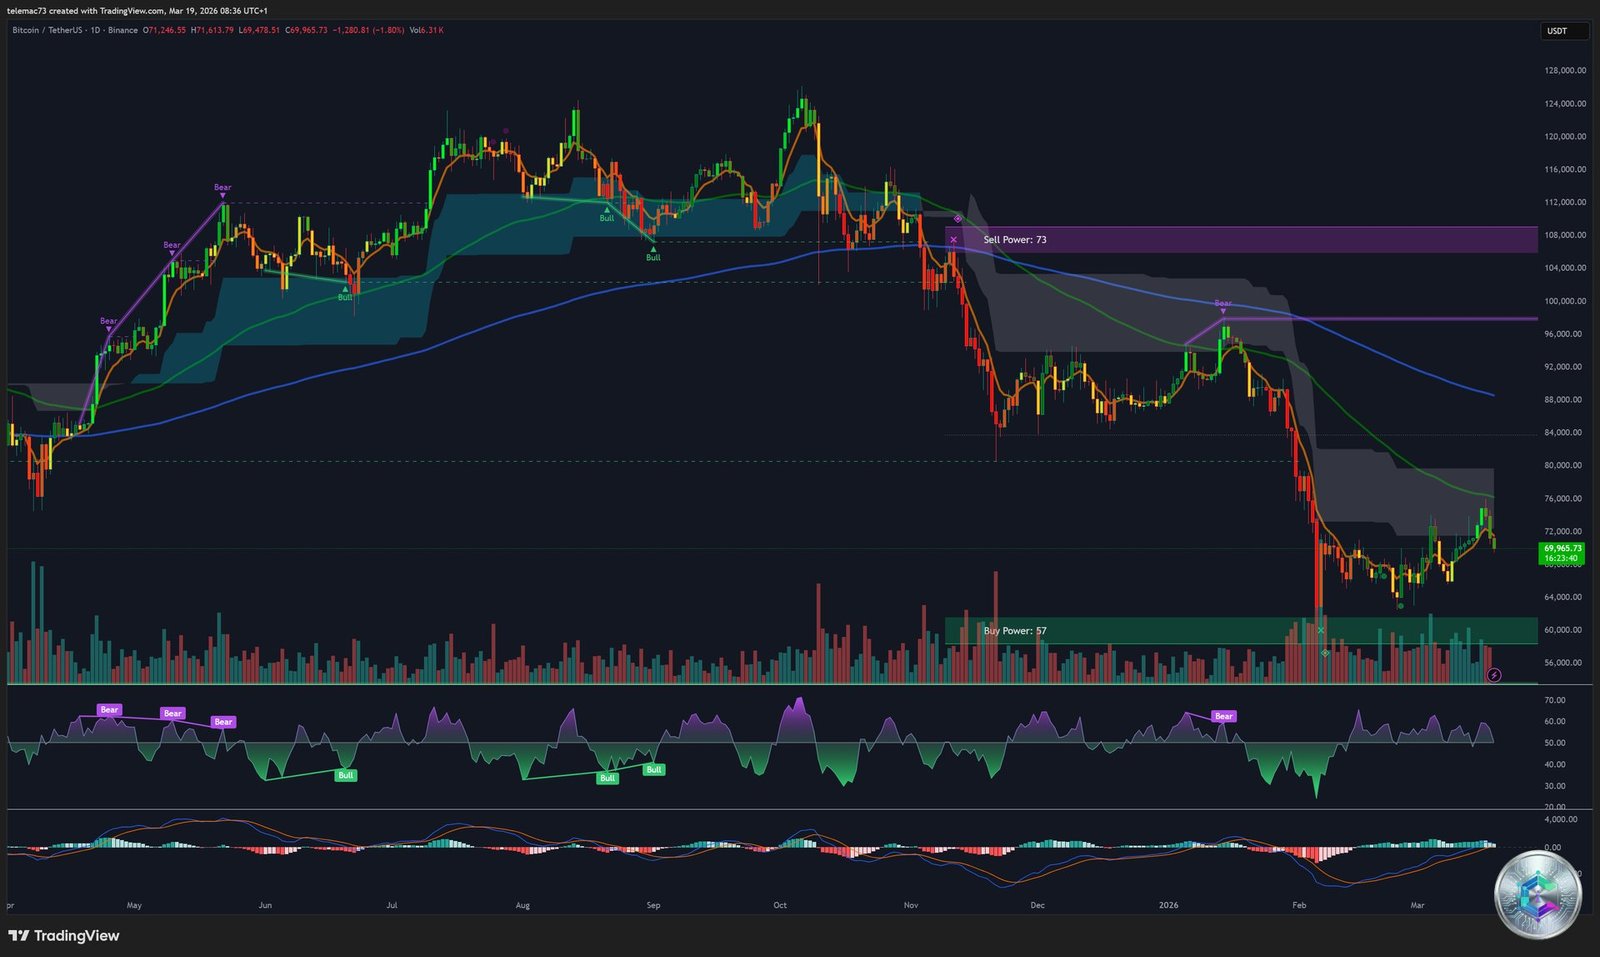
The daily chart allows structural trend analysis over a multi-week to multi-month investment horizon. Price at this chart capture is $69,965.73 (-1.80% on the session).
- Moving Average: Price has plunged deep below the main moving average (blue line). The trend cloud has turned grey/reddish, confirming a shift to a corrective regime.
- MACD — Daily Death Cross: Both signal lines crossed to the downside well above the zero line. The histogram prints descending bars, confirming accelerating selling pressure. A Death Cross is also confirmed on the 3-day (3D) timeframe (MA50 crossed below MA200).
- RSI: The slope is steep, heading aggressively toward oversold territory (30–44), signaling a rapid depletion of buying momentum.
- Algorithmic Zones: « Buy Power ~$60k » (absolute macro-structural support) vs. « Sell Power ~$73k » (macro resistance). A daily close below $60,000 would severely compromise the bullish thesis.
5. Intermediate Analysis: 4-Hour Chart (H4)
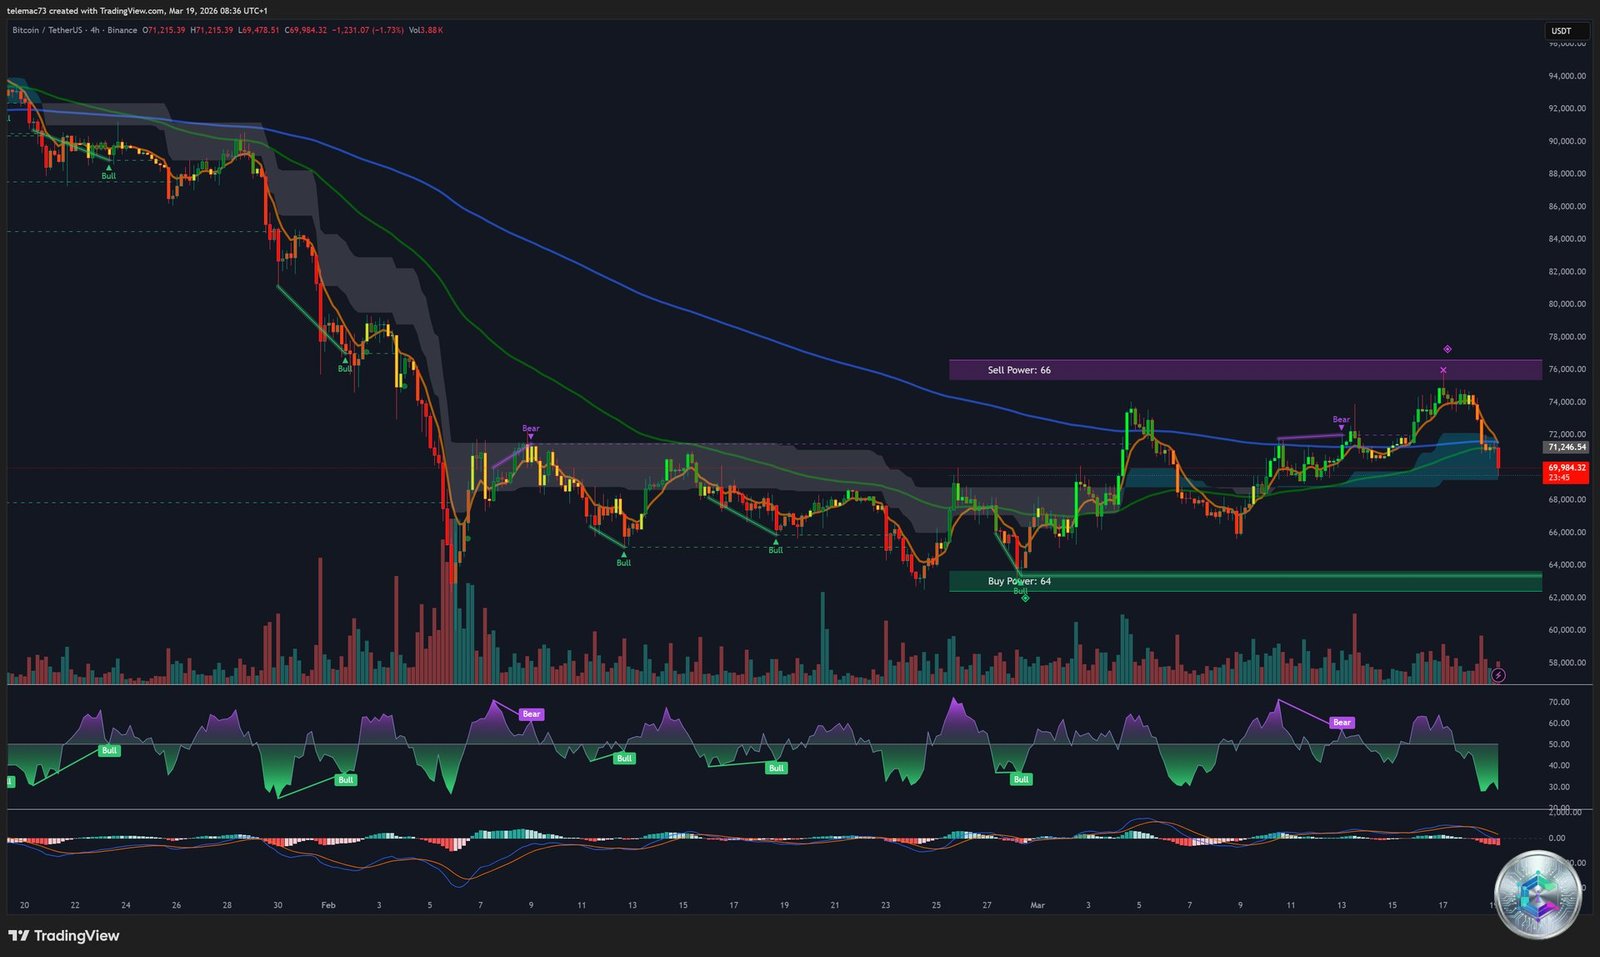
On the H4 timeframe (BTC at $69,984.32), deterioration is even more evident. The moving average acts as a perfect dynamic resistance: every bounce attempt is violently rejected at this line.
A compression triangle had formed, raising hope for a bullish resolution. Instead, the triangle broke to the downside, turning the potential bull flag into a trap and triggering a wave of algorithmic selling. The H4 MACD records a new Death Cross with a negatively expanding histogram. The H4 RSI has plunged into pronounced oversold territory (<30), suggesting a possible short-term technical bounce (« dead cat bounce »).
| H4 Technical Element | Observation | Deduction |
|---|---|---|
| Chart Pattern | Compression triangle broken downward | Bearish continuation confirmed |
| Moving Average | Strict dynamic resistance | Systematic rejection of bounces |
| MACD | Death Cross + negatively expanding histogram | Accelerating selling pressure |
| RSI | Plunge toward oversold zone (<30) | Possible imminent snap-back bounce |
| Algo S/R Zones | Support $62k–$64k / Resistance $74k–$76k | Gravitational pull toward $64k |
6. Micro-Structure: 15-Minute Chart (M15)
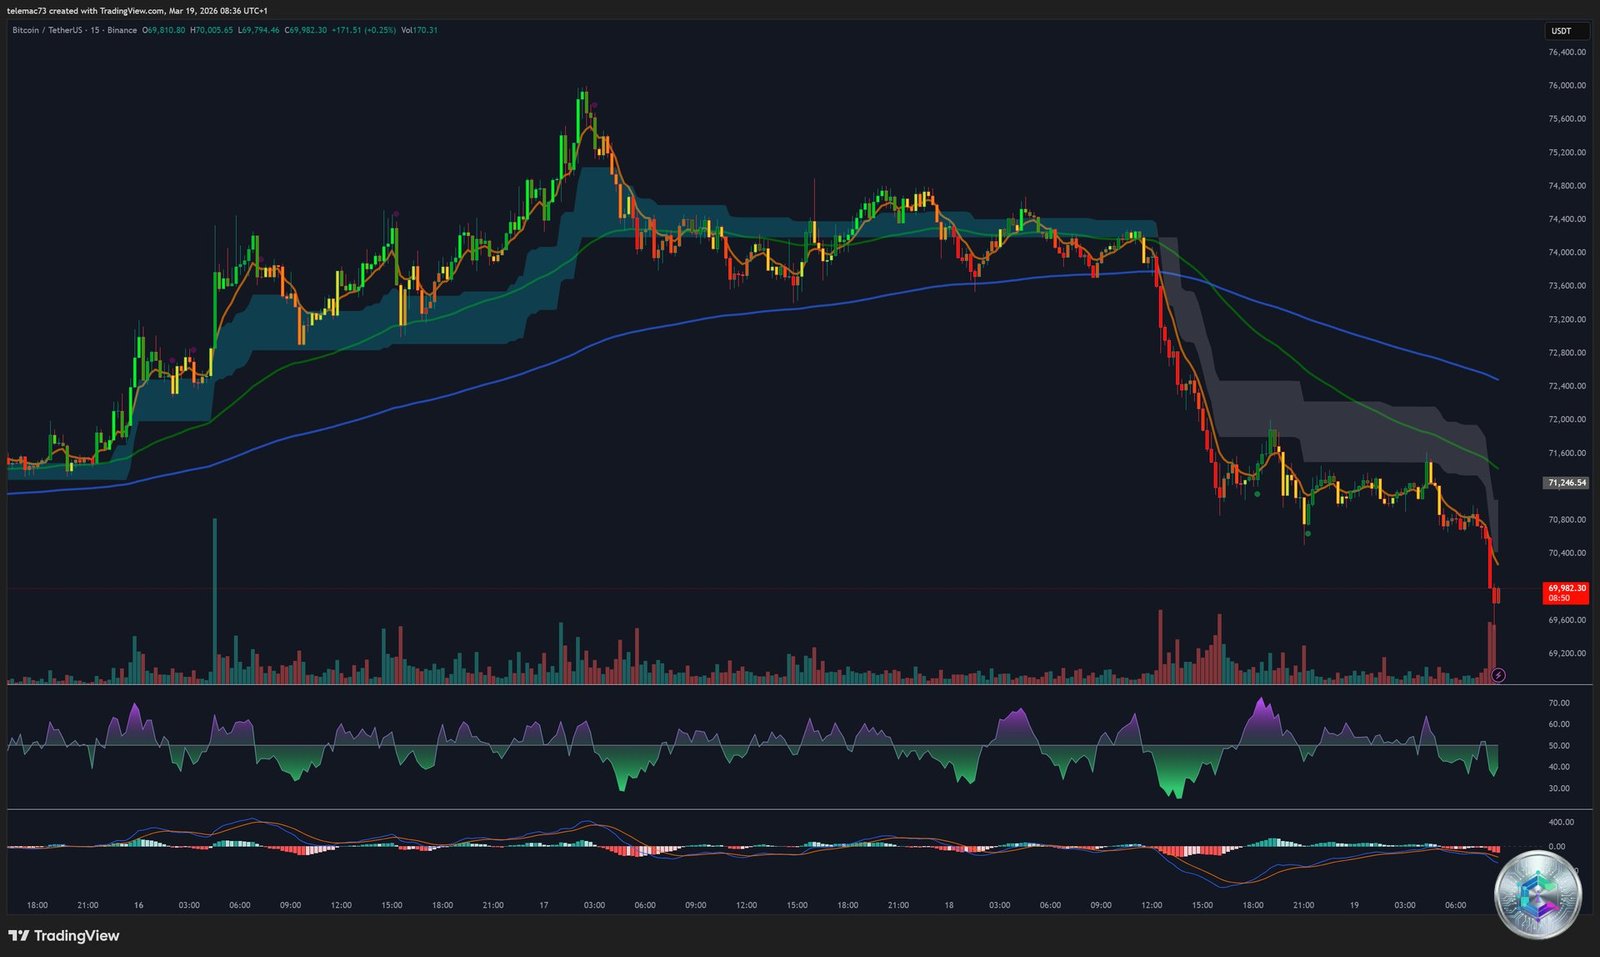
The M15 chart depicts a scene of absolute short-term capitulation. A massive red candle — a near-vertical waterfall decline — drops price from $71,246 directly to $69,982, the unmistakable signature of a cascading liquidation of long positions (long squeeze).
The M15 RSI shows an exceptionally low reading, plunging well below the extreme oversold threshold (likely <20), signaling total emotional capitulation by market participants. Mean reversion bots are actively monitoring these extreme RSI levels to trigger automatic buy orders. The volume spike coinciding with the capitulation candle constitutes a classic selling climax, signaling a potential transfer of capital from « weak hands » panicking into losses to institutions absorbing with limit buy orders.
7. The « Quadruple Witching » Effect — March 20, 2026
No analysis of this market juncture would be complete without addressing the Quadruple Witching event scheduled for Friday, March 20, 2026 — the simultaneous expiration of four types of derivative contracts (individual stock options, index options, index futures, and single-stock futures). This quarterly event historically generates astronomical trading volumes and sudden, often unpredictable price swings.
With Bitcoin’s correlation to the S&P 500 having reached 78% in recent observation windows, the crypto market inevitably absorbs the shockwaves of this event. Furthermore, the regulatory approval allowing the use of spot Bitcoin ETFs as eligible collateral for options and institutional margin accounts creates a direct link: when institutions face extreme volatility or margin calls on equity derivatives during Quadruple Witching, they may liquidate Bitcoin ETF holdings to raise emergency liquidity.
Bitcoin option expirations, combined with the closely watched CME futures expiration (scheduled for March 27, 2026), create a concentration of expirations acting as a powder keg of extrinsic volatility. The « Max Pain » level — the price at which the maximum number of option holders suffer maximum losses — becomes a powerful gravitational force, as hedge funds have accumulated extreme short positions on index ETFs to aggressively hedge against Iranian conflict contagion risk.
8. Strategic Scenario Modeling
🔴 Scenario 1: Capitulation Spiral (Short-Term Bearish)
This scenario plays out if the bearish technical configuration overrides the ETF accumulation narrative, fueled by continued geopolitical deterioration or oil persistently above $105:
- Unable to breach the $72k–$75k resistance wall, Bitcoin succumbs to the weight of the Daily and H4 MACD Death Crosses and breaks below $68,000.
- Price targets the algorithmic Buy Power zone of $62,000–$64,000 (H4 support), then the absolute macro-structural support at $60,000.
- The $60k–$64k zone represents the ultimate test: a capitulation toward these levels will trigger massive dip-buying from MicroStrategy, BlackRock, and sovereign entities, clearing toxic leverage from the system.
🟢 Scenario 2: Relief Rally and Short Squeeze (Contrarian Bullish)
This contrarian scenario materializes if Jerome Powell’s speech is perceived as neutral or if signs of diplomatic de-escalation emerge in the Middle East:
- Algorithms detect the M15 selling climax. The inability of sellers to push price significantly below $68,000 despite terrible macro conditions creates a relative strength divergence. Post-Quadruple Witching IV crush reduces market maker hedging pressure.
- Price launches a violent V-shape recovery, slicing through the H4 moving average, invalidating the triangle breakdown (bear trap). The move triggers a chain liquidation of institutional shorts accumulated below $74,000, devouring the sell wall.
- Targets: $76,000–$77,200 (R3 resistance zone), then a recapture of the daily corrective channel aimed at new annual highs — propelled by the fundamental supply shock where daily issuance is dwarfed by TradFi’s insatiable appetite.
The professional investor navigating these troubled waters on March 19, 2026 must calibrate risk exposure against these two structural boundaries: the loss of $64,000 invalidating the aggressive long posture, and a convincing recapture of $74,000 confirming the resolution of the cyclical correction.
⚠️ Disclaimer: This article is written exclusively for educational and informational purposes. It does not constitute investment advice, a recommendation to buy or sell, or an inducement to invest in cryptocurrencies or any other financial asset. Crypto-asset markets are extremely volatile and carry the risk of total loss of capital. Please consult a licensed financial advisor before making any investment decision. Cryptoinfo.ch accepts no liability for decisions made based on this content.