
Introduction: A Precarious Balance
The global digital asset ecosystem is undergoing a fundamental restructuring in March 2026. After reaching spectacular all-time highs during the post-halving euphoria phase in autumn 2025 — peaking around $126,200 — Bitcoin (BTC/USDT) has entered a deep macroeconomic correction and risk reassessment cycle.
As of March 14, 2026, the asset trades in a critical consolidation zone around $70,798, representing a severe contraction of approximately 44% from its all-time high. The total crypto market capitalization has contracted to approximately $2.37 trillion, reflecting a flight of speculative capital and massive institutional redistribution.
This report offers a rigorous dissection of the Bitcoin market through the convergence of cycle theory, on-chain analytics, macroeconomic context, and granular technical analysis across multiple timeframes.
1. The Structural Mutation of Bitcoin Market Cycles
Is the Classic Four-Year Cycle Dead?
Historically, the post-halving cycle followed predictable phases: moderate expansion, parabolic acceleration culminating in a blow-off top, followed by a brutal purge. Prior cycle corrections demonstrate the violence of these resets: -85% in 2014, -84% in 2018, -77% in 2022.
However, Q1 2026 dynamics suggest a substantial deviation from this mechanical model. The launch of Spot Bitcoin ETFs on the US market in 2024 fundamentally altered Bitcoin’s liquidity architecture. Marginal demand is no longer exclusively driven by sentiment-led retail investors, but by structured institutional capital flows, corporate treasury allocations, and sovereign wealth funds. This institutionalization has produced a volatility dampening effect: while the asset corrected by 44%, this decline remains significantly less severe than historical crashes of 80%+.
The hypothesis of a collapse toward the depths of prior cycles appears undermined by the emergence of a « 3-Year Liquidity Cycle », more synchronized with global monetary aggregates than with the network’s internal emission algorithm.
Elliott Wave Theory: Where Are We Now?
The macro price structure aligns remarkably with Elliott Wave Theory. The upward movement initiated at the 2022 bear market bottom (~$16,500) and ending at the October 2025 high (~$126,000) constitutes a complete five-wave impulsive sequence.
The current correction unfolds in three distinct sequences (A-B-C): Wave A drove the asset toward ~$84,000, followed by a technical bounce (Wave B), before a new leg down (Wave C) pierced the $70,000 level. Critical confluence zones to monitor: $70,000 (current battleground) and, in an extreme capitulation scenario, $58,000 (200-day SMA).
On-Chain Data: Holder Psychology Under Extreme Stress
On-chain analysis corroborates the severity of the corrective phase. Currently, between 27% and 30% of UTXOs are in an unrealized loss position — a stress level comparable to May 2022, which preceded major systemic collapses within the ecosystem. Furthermore, net realized losses are running at approximately -$317 million per day, a level not seen since December 2022.
Price action around $70,000 is thus the arena of a confrontation between institutional distribution and strategic accumulation by patient capital.
2. The Macroeconomic Shock: Fed, Geopolitics & Energy
The Federal Reserve Walking a Tightrope
With the crucial FOMC meeting set for March 17-18, 2026, uncertainty is peaking. This meeting is particularly strategic as it includes the publication of the Summary of Economic Projections (SEP) and the closely watched dot-plot.
The economic context is clear: February’s CPI data (released March 11) shows a monthly increase of 0.3% and an annualized gain of 2.4%, stubbornly refusing to converge toward the 2% target. The labor market remains resilient (~67,000 monthly job additions). The dot-plot is expected to cement a restrictive paradigm projecting only one 25 bps rate cut for all of 2026.
For Bitcoin, the impact of this higher-for-longer policy is direct and punitive: elevated bond yields increase the opportunity cost of holding a zero-yield asset, while continued Quantitative Tightening drains excess liquidity from the system.
The Oil Shock and the Stagflation Threat
The escalation of geopolitical tensions in the Middle East, involving Iran, has sent shockwaves through commodity markets. Crude oil is dangerously approaching $130 per barrel. Econometric models estimate that such a shock could generate +0.45 percentage points of annualized headline CPI inflation, with a lagged effect of +0.17 points on core inflation.
In this turmoil, Bitcoin finds itself in a paradoxical position: liquidated as a high-volatility asset by institutional algorithms, yet attractive as a sovereign hedge against fiat debasement for strategic buyers. The battle between these two opposing forces defines current price action.
3. The Regulatory Chessboard: 2026 Midterms & the Clarity Act
The 2026 US Midterm elections have become an existential battleground for the regulatory future of the digital asset industry. The « Fairshake » Super PAC and its affiliates have amassed a war chest of over $193 million in cash-on-hand according to FEC filings, making it the best-funded Super PAC of the entire 2026 Midterm cycle. The goal: secure the election of pro-crypto legislators in strategic states including Illinois, Arkansas, Alabama, and Texas.
The central legislative stake is the « Clarity Act », a comprehensive regulatory framework aimed at resolving chronic legal ambiguities surrounding digital asset classification. Its adoption before the congressional recess in July 2026 would act as a powerful bullish catalyst, potentially unlocking institutional capital currently frozen by regulatory uncertainty.
| Date | Event |
|---|---|
| March 11, 2026 | February CPI released — 2.4% annual inflation |
| March 14, 2026 | BTC consolidating at ~$70,798 |
| March 17-18, 2026 | FOMC Meeting + SEP & Dot-Plot release |
| April 10, 2026 | March CPI — incorporating initial oil shock effects |
| July 2026 | Unofficial deadline for Senate vote on the Clarity Act |
| November 2026 | US Midterm Elections |
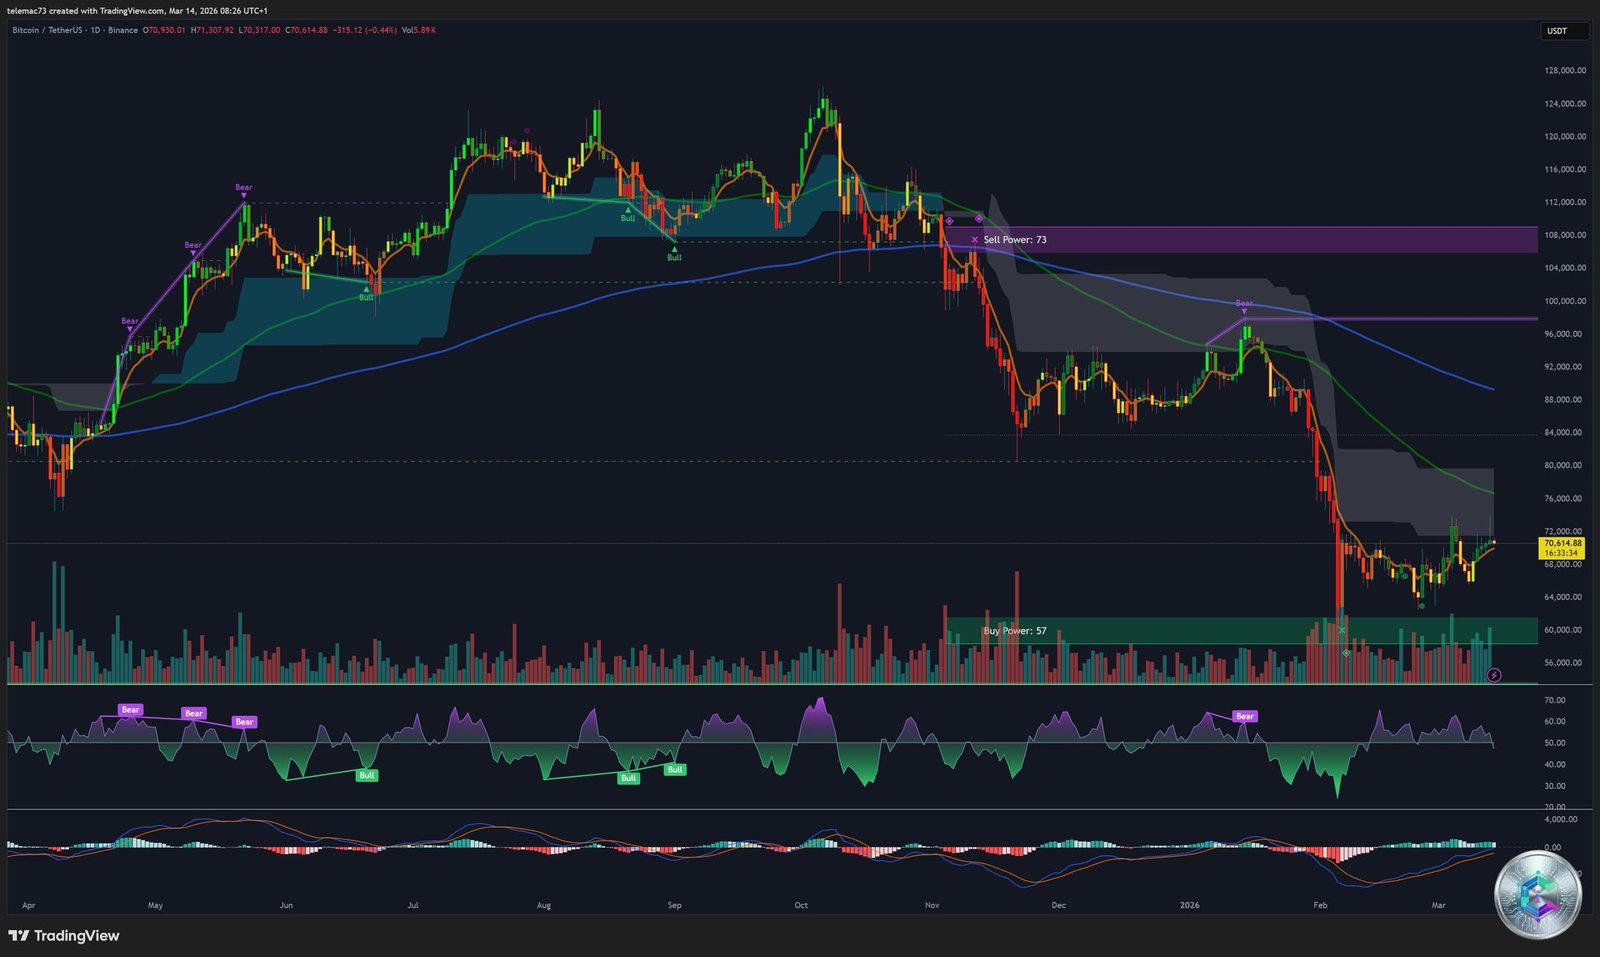
4. Technical Analysis — Daily Chart (1D)
The daily chart reveals the formation of a massive macroeconomic distribution top between $120,000 and $126,000, followed by a relentless structural collapse. Price (~$70,614) now trades in the lower range of a descending channel, below a massive dynamic resistance cloud (akin to an Ichimoku cloud) that has shifted from bullish green to bearish gray/red.
Oscillators confirm the purge: the daily RSI is printing tentative bullish divergences, signaling that selling momentum is losing velocity. The MACD’s negative histogram bars are gradually compressing toward zero, heralding a period of major indecision — a prelude either to a bullish crossover or a final capitulation toward $60,000.
To invalidate the macro-bearish structure, Bitcoin must reclaim the $74,000 zone with a confirmed daily close. Failure would open a first technical target at $63,900, then the psychological target at $60,000.
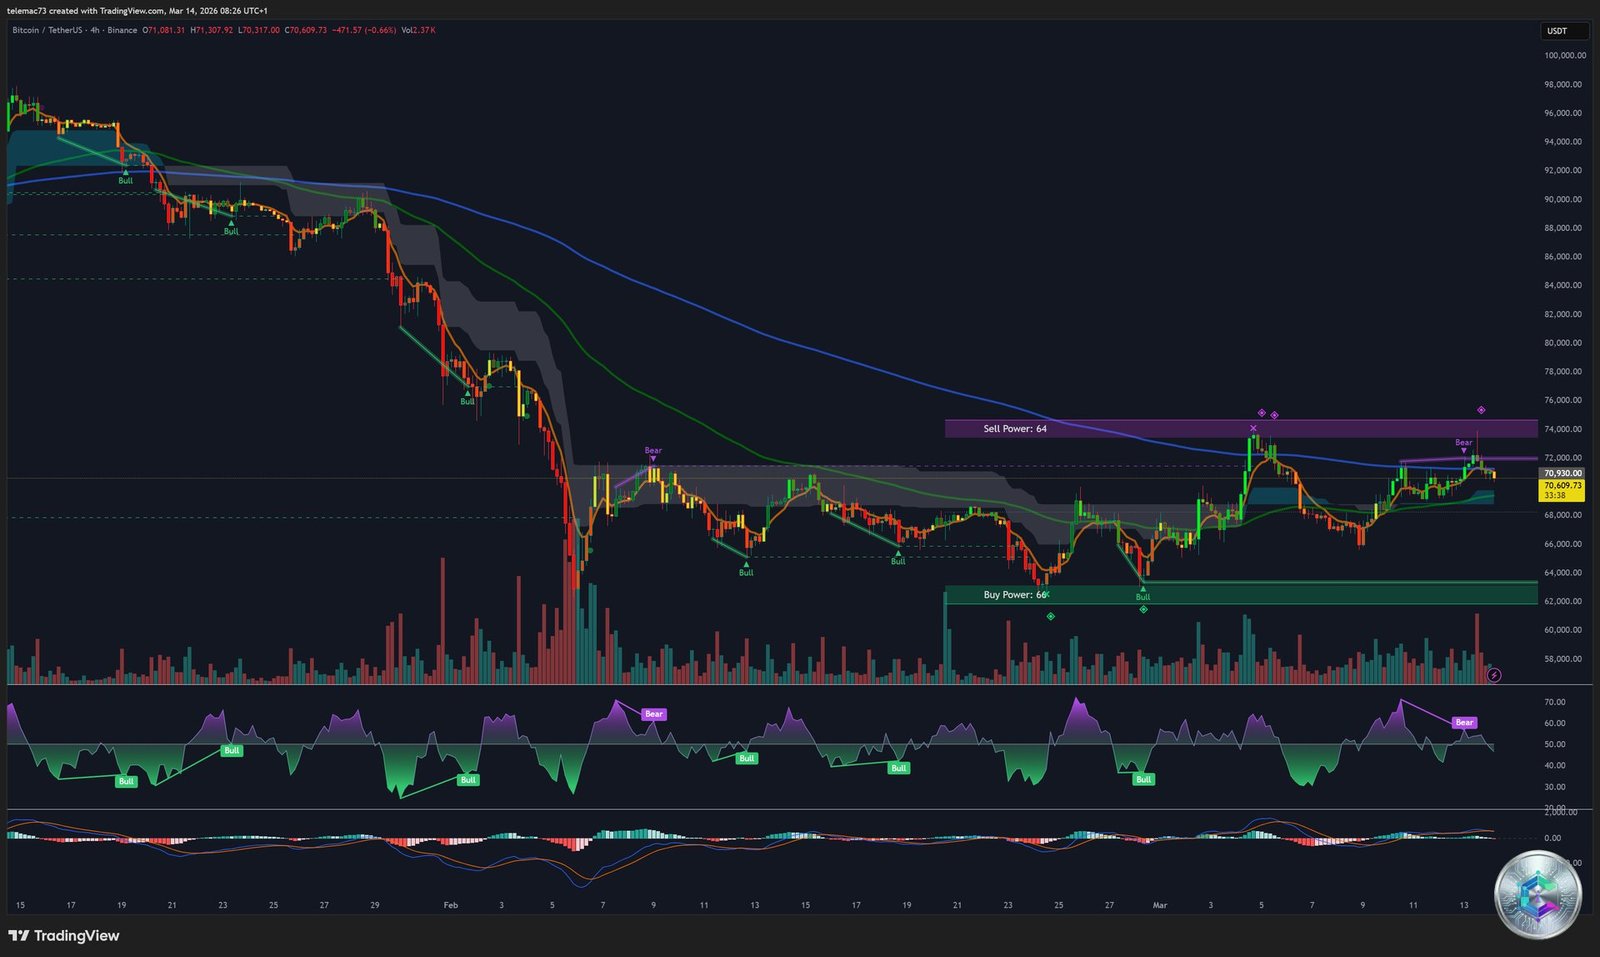
5. Technical Analysis — 4-Hour Chart (4H)
The 4-hour chart reveals a prolonged volatility compression phase within a defined corridor: resistance ceiling around $73,400 – $74,000 (« Sell Power » zone) and a floor actively defended at $62,000 – $64,000 (« Buy Power » zone). The internal dynamics paint a compression pattern resembling a bear flag or bearish continuation triangle.
The 4H RSI is tracing a regular bullish divergence: ascending lows on the oscillator while price prints flat or descending lows — a signal of silent accumulation beneath the surface. The MACD frequently crosses the zero line in both directions, generating the false signals typical of a trendless market.
A confirmed 4H close above $71,000 is the technical prerequisite to invalidate the bearish compression and target the $73,400 resistance wall.
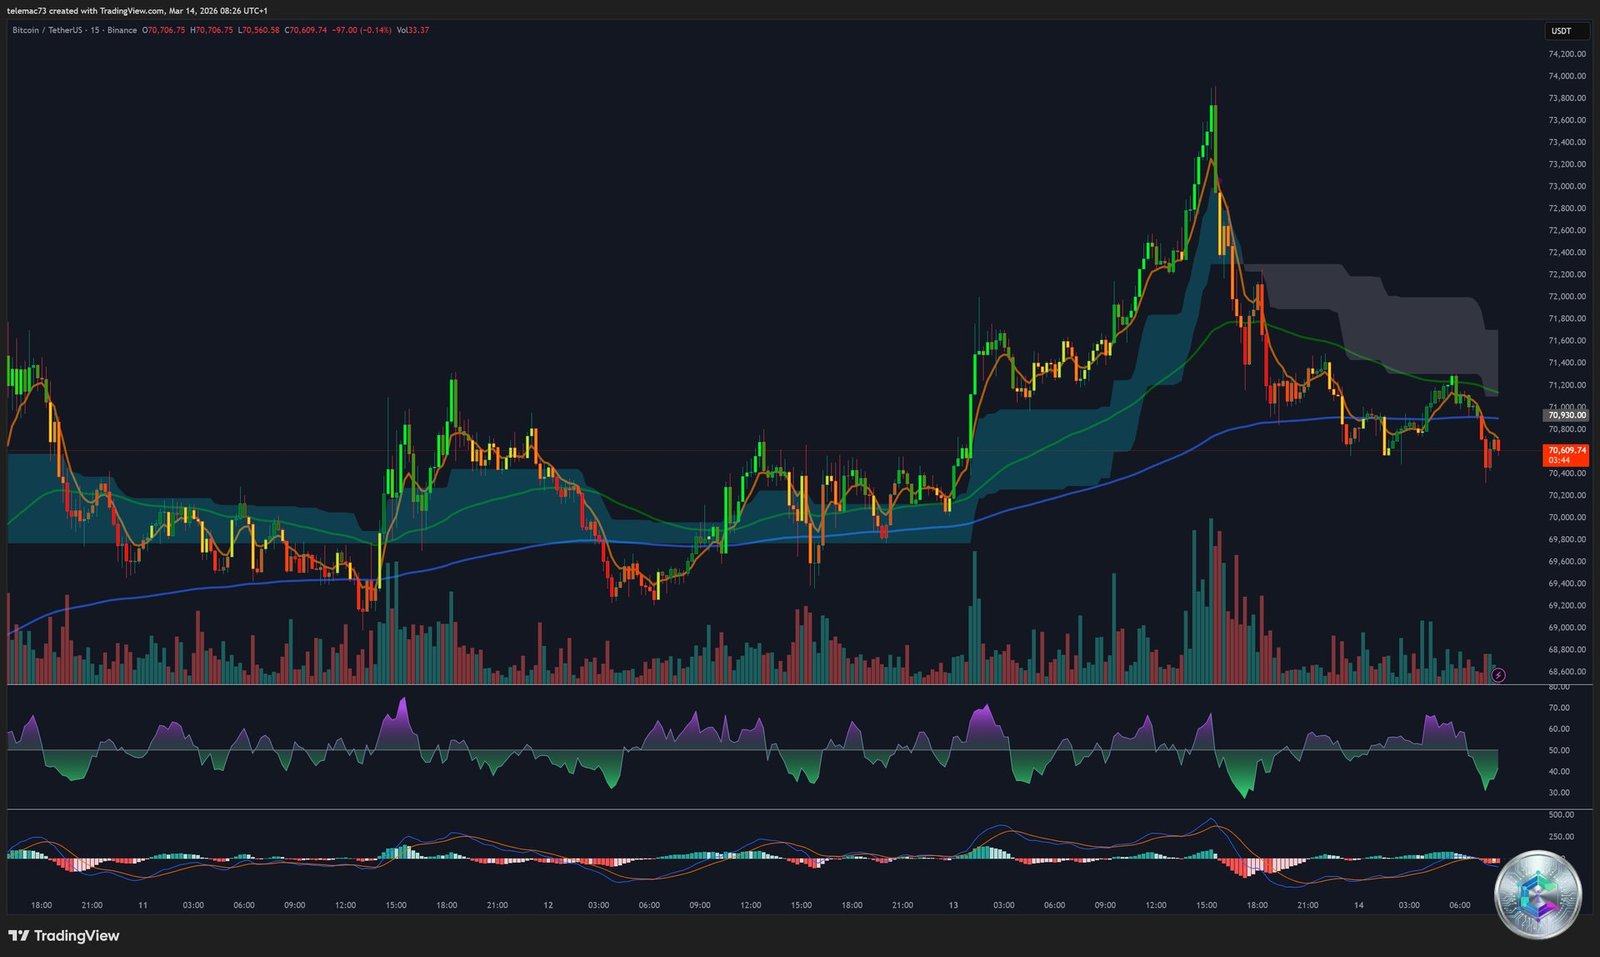
6. Micro-Structural Analysis — 15-Minute Chart (15M)
The 15-minute chart documents a recent extreme volatility event: a parabolic ascent from $69,400 to an ephemeral local high of $73,800, immediately followed by a bull trap. The ensuing liquidity hunt triggered a cascade of liquidations on late long positions, violently plunging price back to $70,600.
The MACD registered a rare-amplitude Death Cross on this timeframe, and the RSI plunged from overbought territory to deep oversold levels within just a few candles — a signal of algorithmic panic. The $70,000 level asserts itself as a ruthless micro-structural battleground. A breakdown below $65,800 would open the door to far more severe structural damage on higher timeframes.
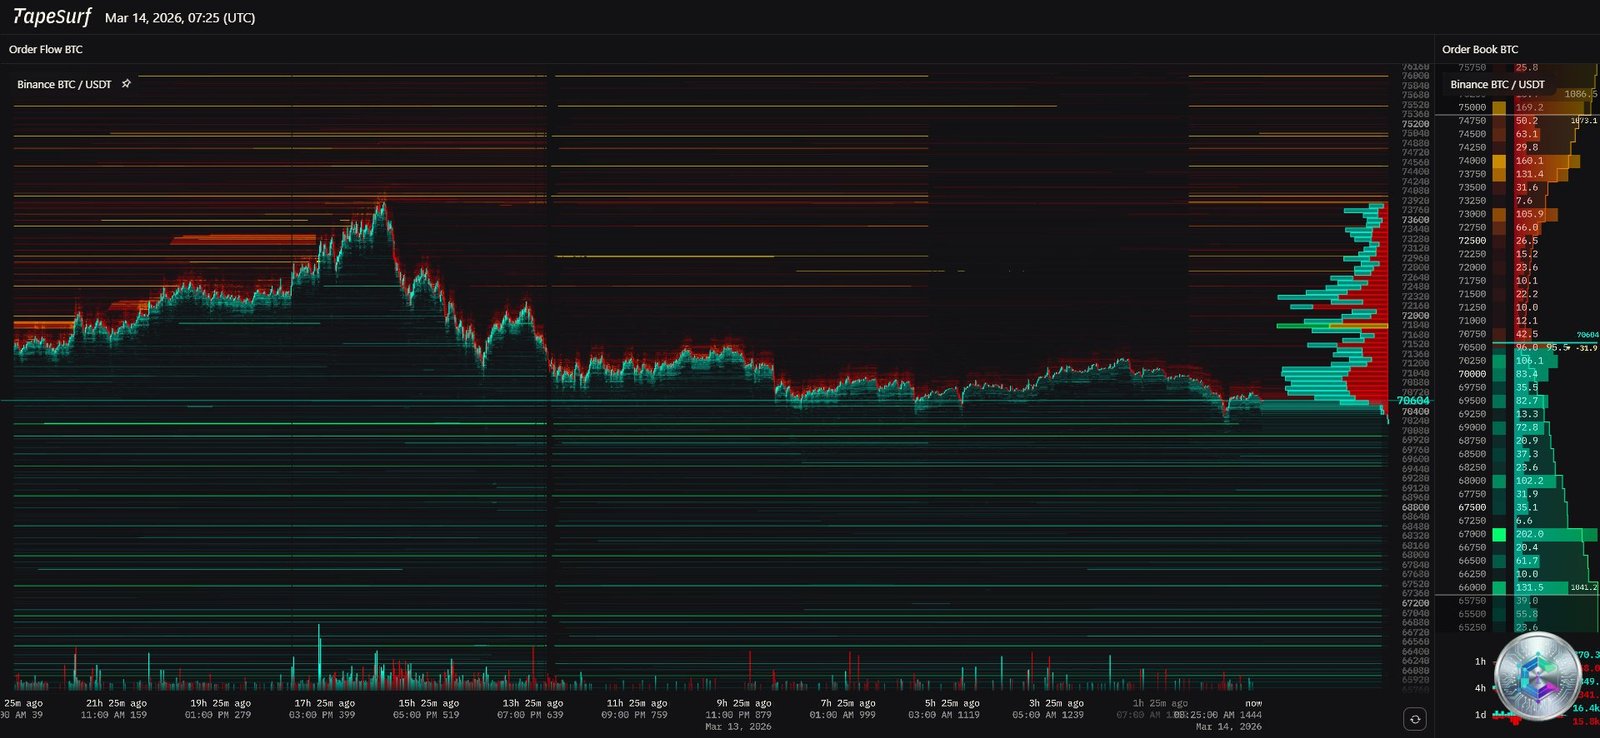
7. Order Flow Heatmap: An X-Ray of Institutional Liquidity
The TapeSurf order flow heatmap provides an X-ray view of real institutional intentions. Open Interest peaks at approximately $2.96 billion, massively concentrated in the $69,000 – $71,000 corridor, explaining the market’s lateral stagnation.
Sell Walls: The heatmap reveals dense, uninterrupted red bands from $72,000 all the way above $76,000, representing tens to hundreds of millions of dollars in limit sell orders. These walls technically justify Bitcoin’s difficulty in breaking $73,400, and reveal calculated algorithmic distribution (TWAP/VWAP execution).
Demand Pockets: On the buy side, green bands are significantly sparser in the immediate vicinity of current price. A liquidity void exists between $70,000 and $68,000. Consistent buy-side order blocks only reappear in the $65,000 – $68,000 zone, confirming the technical relevance of the $65,800 support.
On a positive note: the issuance of over $8 billion in USDC since February 2026 signals a substantial « dry powder » reserve sitting on the sidelines. In the event of a severe capitulation toward $58,000 – $60,000, these billions could flood the market as market orders, absorbing excess supply and orchestrating a spectacular trend reversal.
8. Critical Technical Levels — Summary
| Level | Role |
|---|---|
| $74,000 | Key macro resistance — confirmed break invalidates bearish structure |
| $73,400 | Critical resistance wall (Sell Power Zone) |
| $71,000 | Intermediate consolidation ceiling (4H) |
| $70,000 | Central pivot / Center of gravity |
| $68,000 | Intraday channel lower boundary |
| $65,800 | Major micro-structural support |
| $63,900 | Intermediate technical support (Buy Power Zone) |
| $60,000 | Fundamental psychological support |
| $58,000 | Absolute macro floor (200-day SMA / Elliott Wave C target) |
9. Strategic Synthesis and Scenarios
The aggregation of all these components demonstrates that Bitcoin near $70,798 sits at the epicenter of a clash between monumental forces. With US inflation stubbornly at 2.4%, a potential oil shock pushing crude toward $130, and a Fed with zero room to maneuver, Bitcoin’s ability to launch a new upside price discovery phase remains structurally constrained in the short term.
Absent a validated daily close above $74,000, statistical probability favors a downside resolution to the current consolidation. A final capitulation toward the $58,000 – $60,000 zone would represent not Bitcoin’s death sentence, but the necessary purge of leverage excesses and the ultimate accumulation opportunity for the vast reserves of sidelined capital waiting to deploy.
On the positive front: potential adoption of the Clarity Act before July 2026 would act as a powerful bullish catalyst, capable of neutralizing macroeconomic headwinds. A crypto-friendly outcome in the November 2026 Midterms could lay the groundwork for a healthy structural bull trend resumption within the new three-year liquidity cycle paradigm.
⚠️ Disclaimer
This article is written for educational and informational purposes only. It does not constitute investment advice, a recommendation to buy or sell, or any form of financial guidance. Cryptocurrency markets are highly volatile and past performance is not indicative of future results. Only invest what you can afford to lose, and consult a qualified financial advisor before making any investment decisions.