
Bitcoin Plummets to $60,000: In-Depth Analysis of the Cataclysmic Flash Crash of February 2026
Bitcoin’s market experienced one of the most tumultuous trading sessions in recent history on February 5, 2026. A « flash crash » of rare intensity precipitated the asset toward the critical psychological threshold of $60,000, erasing approximately 17% of its value in less than 24 hours. This spectacular collapse, however, is not an isolated event but rather the culmination of a complex convergence of macroeconomic pressures, regulatory decisions, and microstructure market disruptions.
The Triggers of Catastrophe: When Three Storms Converge
The sharp decline of February 5th was precipitated by a chain reaction involving alarming US economic data, aggressive risk-off rotation, and a liquidity crisis in derivatives markets.
1. The Employment Market Shock: The « Soft Landing » Recession at Risk
The trading session unfolded under widespread selling pressure following the release of employment data significantly below expectations. Weekly jobless claims for the week ending January 31st reached 231,000, vastly exceeding economists’ predictions of 212,000. More concerning: over 108,000 job cuts were announced in January—the highest level for this month since 2009.
These indicators immediately triggered a massive « risk-off » sentiment as investors feared that the Federal Reserve’s restrictive monetary policy had finally broken American economic resilience.
2. The Collapse of the Artificial Intelligence Narrative
Parallel to macroeconomic concerns, the technology sector—the growth engine of 2025—suffered a major setback. AI giants released capital expenditure forecasts deemed unsustainable by markets:
- Alphabet (Google) announced investments for 2026 between $175–185 billion, double its 2025 level.
- Amazon projects expenditures reaching $200 billion.
This vertiginous escalation, dubbed a « bottomless pit » by Wall Street analysts, triggered a technology stock selloff, dragging the Nasdaq down 1.6%. Bitcoin, maintaining elevated correlation with technology stocks, served as « collateral damage » in this forced liquidation.
3. Kevin Warsh’s Nomination and the Specter of Quantitative Tightening
A determining political and monetary factor was Kevin Warsh’s nomination to succeed Jerome Powell as Federal Reserve chair. While Warsh recently advocated for rate cuts, his reputation as a « hawk » on the Fed’s balance sheet terrified speculative markets. Traders now anticipate aggressive balance sheet reduction, which would contract global liquidity—the primary fuel for digital assets. This prospect of restrictive monetary policy pushed institutions to massively de-risk.
Market Microstructure: When Margins Fragment the Ecosystem
The crash of the night of February 5th was amplified by technical mechanisms specific to futures markets, illustrating the growing interconnectedness between Bitcoin and traditional assets.
The Domino Effect of CME Margins on Silver and Gold
The immediate technical trigger for the breach below $70,000 lies in CME Group’s decision to raise margin requirements on precious metals futures. Following extreme volatility in precious metals, margins experienced the following increases:
| Asset | Previous Margin | New Margin | Effective Date |
| Gold (COMEX 100) | 8.0% | 9.0% | February 6, 2026 |
| Silver (COMEX 5000) | 15.0% | 18.0% | February 6, 2026 |
| Platinum | 12.0% | 15.0% | February 2, 2026 |
| Palladium | 15.4% | 17.6% | February 2, 2026 |
This sudden increase forced institutional investors employing multi-asset strategies to liquidate Bitcoin positions to cover margin calls on precious metals holdings. This cross-liquidation phenomenon transformed a healthy correction into a vertical liquidity crash. Over $2.6 billion in liquidations were recorded within hours.
ETF Flows and Institutional Rotation
BlackRock’s Spot Bitcoin ETF (IBIT) recorded a record daily volume of $10 billion during the crash. With prices plunging 13%, this exceptional volume indicates massive hand rotation. While part of this volume stems from panic selling, the exchange intensity also suggests substantial absorption by opportunistic institutional players at the $60,000 level.
However, a warning signal emerges: throughout 2026, Bitcoin ETFs have become net sellers, registering an outflow of 10,600 Bitcoins compared to purchases of 46,000 during the same period the previous year. This reversal of institutional demand creates a permanent liquidity deficit pressuring prices.

Multi-Timeframe Technical Analysis: From Capitulation to Historical Support
Examination of the charts reveals a market structure in transition, with long-term supports tested with unprecedented violence.
Weekly Timeframe: The Bastion of the 200-Week Moving Average
At the weekly scale, Bitcoin has reached a fundamental support level: the 200-week simple moving average (200-SMA), located around $60,000. Historically, this trendline has served as the ultimate floor during bear markets of 2018 and 2022.
Bitcoin has now erased nearly all gains achieved since the US presidential election of November 2024. The break of previous highs at $126,000 has given way to a structure of lower highs, confirming entry into a major distribution phase. The wick of the current weekly candle touched precisely the $60,000 zone before rebounding, validating the importance of this level as the « final bulwark » for long-term buyers.
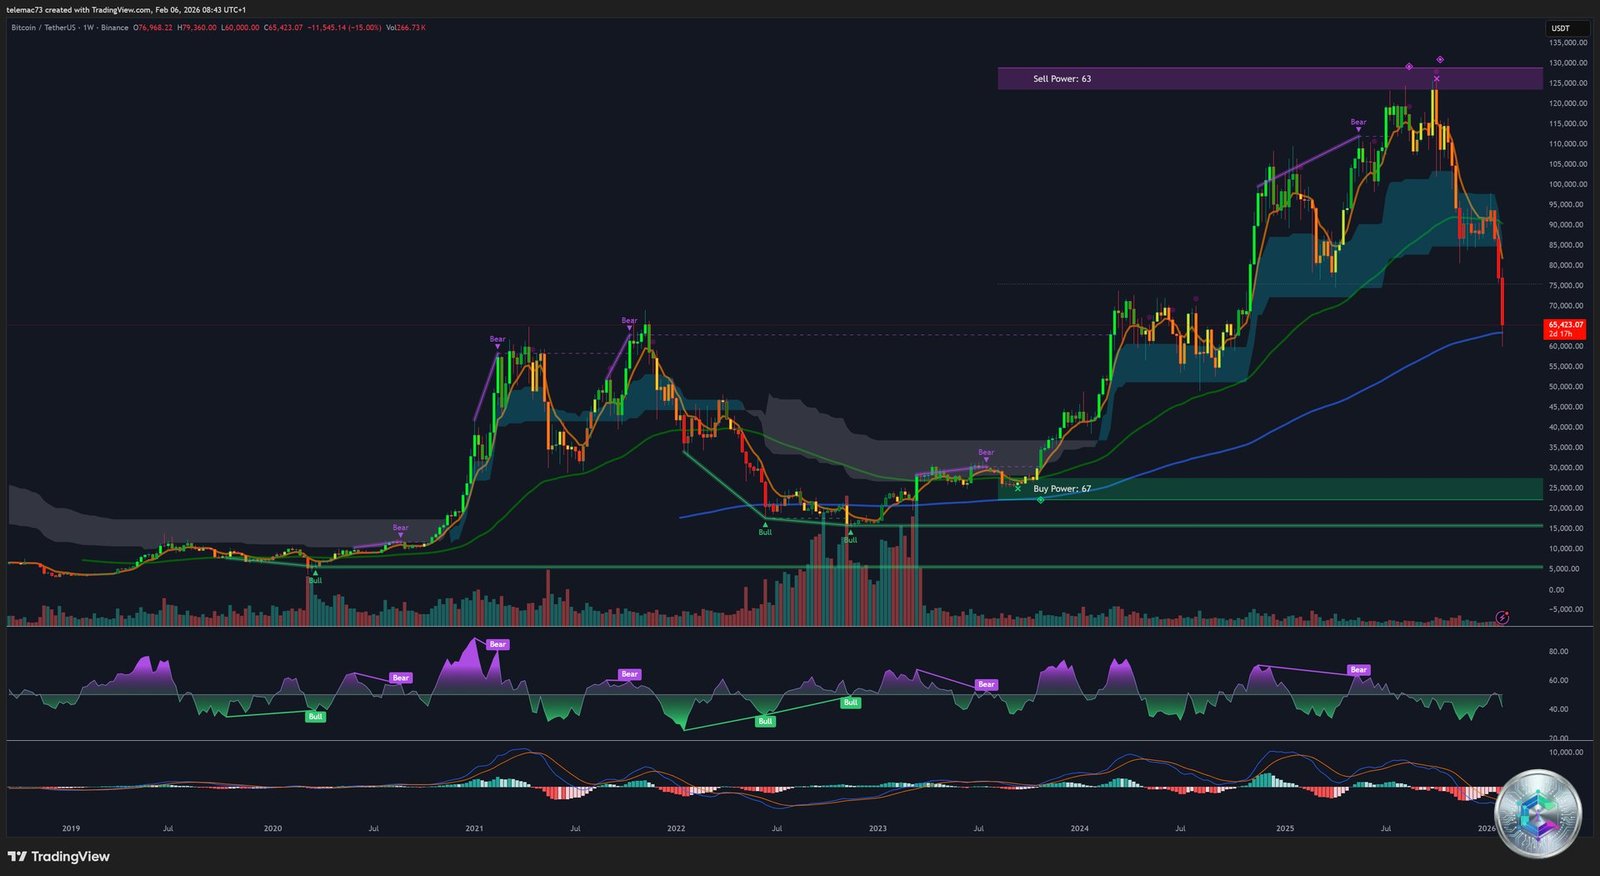
Daily Timeframe: « Buy Power » Zone and Oversold RSI
The daily chart illustrates the verticality of the decline. A « Sell Power » indicator was identified at the peak of $128,000, while a « Buy Power » reading of 61 points now appears in the $60,000 zone.
Short-Term Analysis: 4-Hour and 15-Minute Timeframes
The 4-hour chart shows massive volume during the 7:20 PM ET candle, a characteristic sign of forced liquidation capitulation. Over $817 million in positions were swept away in just four hours.

On the 15-minute timeframe, a stabilization attempt appears in the form of a precarious horizontal channel between $63,000 and $65,000. The short-term moving average is beginning to flatten, suggesting temporary exhaustion of immediate selling pressure. However, the absence of a sharp « V » recovery indicates traders remain cautious, refusing to « catch a falling knife ».

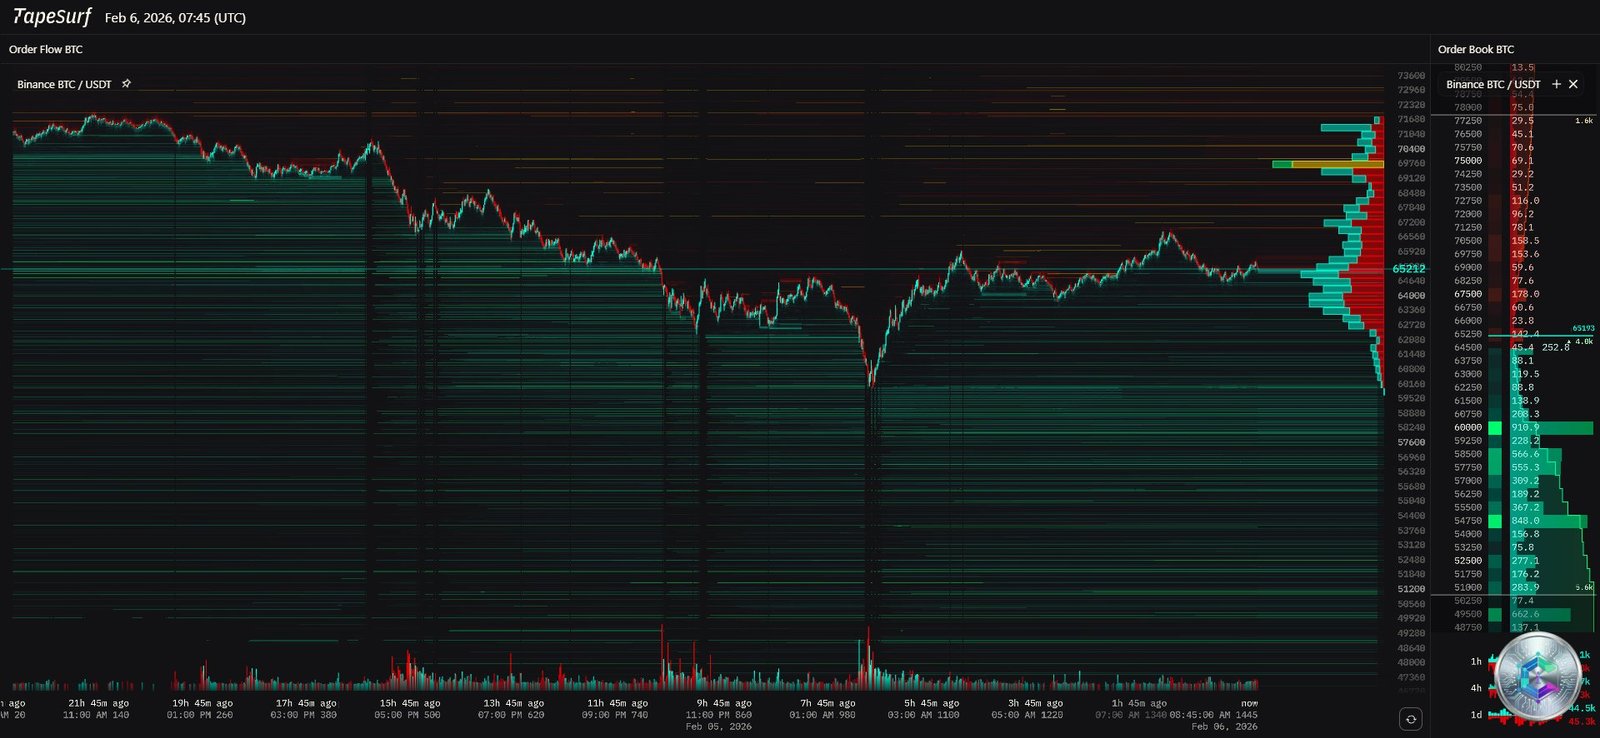
Heatmap and Order Book: Anatomy of Liquidity
The Heatmap provides crucial information on liquidity distribution and market makers’ intentions:
| Price Zone | Liquidity Type | Strategic Implication |
| $60,000 | Buy Orders (Bids) | Major institutional support – Buy Wall |
| $62,500–$64,000 | Intraday Liquidity | Current combat zone – minor accumulation |
| $70,000 | Sell Orders (Asks) | Immediate resistance – psychological Sell Wall |
| $74,000–$76,000 | Liquidation Clusters | Potential Short Squeeze or massive rejection |
The Heatmap reveals that the decline halted precisely where buy order density was highest. The $60,000 zone is literally « paved » with buy orders, explaining the sharp rebound. Conversely, the path upward is obstructed by thick layers of sell orders starting at $68,000, suggesting the market will need powerful fundamental catalysts to breach $70,000 again.
Regulatory Implications and Political Risks
The climate surrounding Bitcoin is further darkened by legislative uncertainties and ongoing investigations.
The Stablecoin Bill Blockade and UAE Investigation
Market sentiment has been affected by the Senate blockade of the « Clarity Act, » intended to regulate stablecoins. Traditional banking industry vigorously opposes this legislation, fearing deposit flight toward yield-bearing stablecoin accounts. Without a clear framework, institutions hesitate to deepen crypto sector engagement.
Additionally, launching a parliamentary investigation into a $500 million investment by an Emirati royal family member in World Liberty Financial cast a chill over the sector. Accusations of conflicts of interest and undue influence resulted in an 80% decline in tokens linked to these enterprises.
Systemic Impact: MicroStrategy in the Crosshairs
MicroStrategy, formerly Strategy, suffered a $12.6 billion loss in the fourth quarter following depreciation of its 713,502 Bitcoins. With an average purchase price of $76,000, the company is now « underwater, » fueling forced sale concerns if prices remain below $60,000. The MSTR stock plunged 17% on February 5th, reflecting the systemic leverage risk this company represents for the entire ecosystem.
Forecast Scenarios for End of Q1 2026
Analysis of February 2026 data indicates Bitcoin has departed its parabolic growth phase to enter a « reset » or structural capitulation phase. The February 5th crash served as necessary purging to eliminate excessive leverage.
Scenario 1: Stabilization (55% Probability)
Bitcoin maintains the weekly 200-SMA support at $60,000 and consolidates within a $60,000–$68,000 range for several weeks. This calm would allow rebuilding a liquidity foundation and exhausting institutional selling pressure.
Scenario 2: Bearish Breakout (30% Probability)
Further deterioration of US employment data or a hawkish Fed announcement pushes price below $58,000. The next technical target would be $52,000, the 100% Fibonacci extension of the current move.
Scenario 3: Rapid Recovery (15% Probability)
A massive « short squeeze » propels price above $72,000, invalidating the bearish trend. This scenario would require a major Fed reversal or surprise legislative adoption of the stablecoin bill.
Conclusion: The Absolute Pivot at $60,000
The $60,000 zone remains Bitcoin’s absolute market pivot. As long as this level holds, hope for medium-term recovery persists. However, caution is warranted, as correlation with technology stock markets and the fragility of company balance sheets heavily exposed to Bitcoin create an asymmetric risk environment.
Investors must prioritize capital preservation and closely monitor ETF outflows and CME margin announcements, which remain the primary indicators of liquidity stress.
Important Disclaimer: This article is provided for informational and educational purposes only. It does not constitute investment advice, a buy/sell recommendation, or an inducement to perform financial operations. Past performance does not guarantee future results. The cryptocurrency market carries high risk. Investors should conduct their own research and consult a qualified financial advisor before making any investment decisions.