
As of January 15, 2026, Bitcoin stands at a pivotal moment in its history, trading around the strategic zone of $96,000. This in-depth technical analysis examines multiple time horizons and fundamental catalysts that could propel BTC to new all-time highs.
A Favorable Macroeconomic Context
The crypto market is currently benefiting from a rare alignment of several bullish factors. The advancement of the Digital Asset Market CLARITY Act in the U.S. Senate represents a historic turning point for crypto-asset regulation. This bill aims to clarify jurisdictions between the SEC and CFTC, removing regulatory uncertainty that has weighed on the industry for years.
Meanwhile, recent inflation data shows overall CPI at 2.7% and core CPI at 2.6%, suggesting a « soft landing » for the U.S. economy. This price stabilization could allow the Federal Reserve to consider rate cuts as early as mid-2026, a historically very favorable scenario for Bitcoin.
Massive Institutional Accumulation
Capital flow analysis confirms that this bullish phase is not purely speculative. MicroStrategy recently acquired an additional 13,627 BTC for approximately $1.25 billion, validating the $90,000-$95,000 zone as an institutional value area. Bitcoin Spot ETFs also recorded massive inflows exceeding $750 million at the beginning of the week, signaling a return of risk appetite.
Market Structure: Liquidation Risk Asymmetry
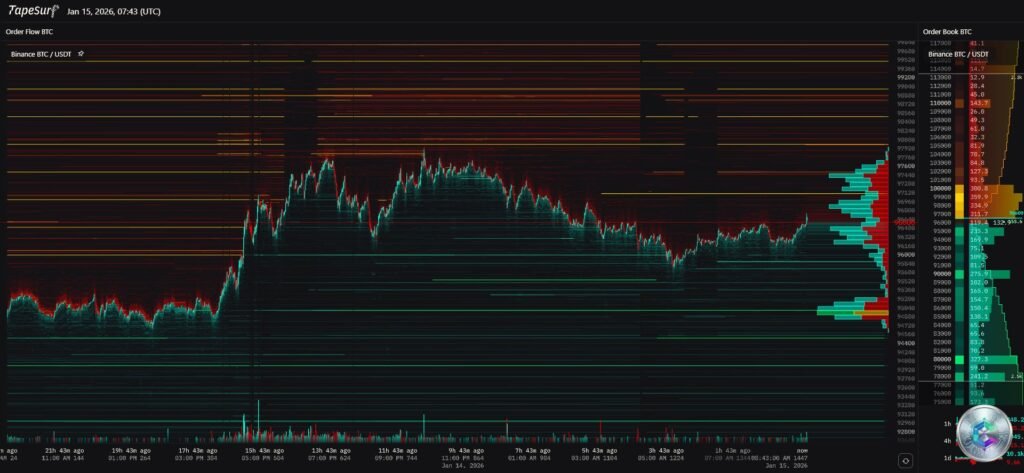
The liquidation heatmap reveals a major structural imbalance that statistically favors bullish continuation. A price increase of only $770 toward the $97,200-$97,500 zone would trigger the liquidation of $1.1 billion in short positions. Conversely, an equivalent volume of liquidations on long positions would require a drop of approximately $2,000.
This asymmetry creates a « liquidity magnet » that could trigger a mechanical short squeeze if price breaks the $97,000 resistance with volume. Funding rates have normalized without reaching euphoric levels, indicating the market is not yet overleveraged on the long side.
Multi-Timeframe Technical Analysis
Daily Timeframe: Crucial EMA Cluster Test
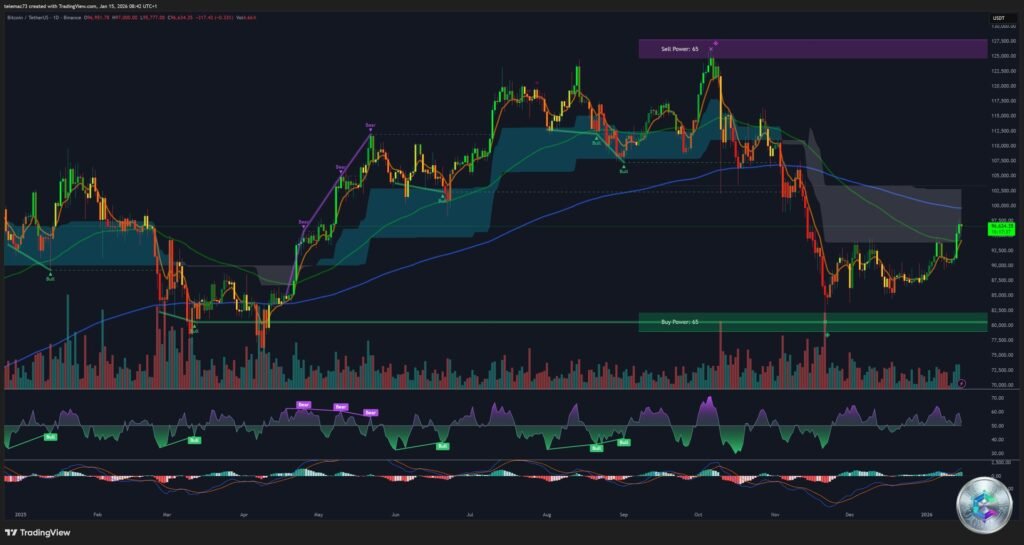
On the daily scale, Bitcoin is currently testing a cluster of converging Exponential Moving Averages between $96,000 and $97,500. This zone has acted as a ceiling for several weeks. A decisive daily close above $97,500 would constitute a major technical breakout, invalidating the corrective structure from late 2025.
The daily RSI is hovering around 53-58, in neutral to slightly bullish territory. This is a very healthy configuration, leaving room for bullish acceleration without immediate overheating. The MACD shows signs of bullish crossover, signaling momentum reversal favorable to buyers.
4-Hour Timeframe: Bullish Pennant Formation
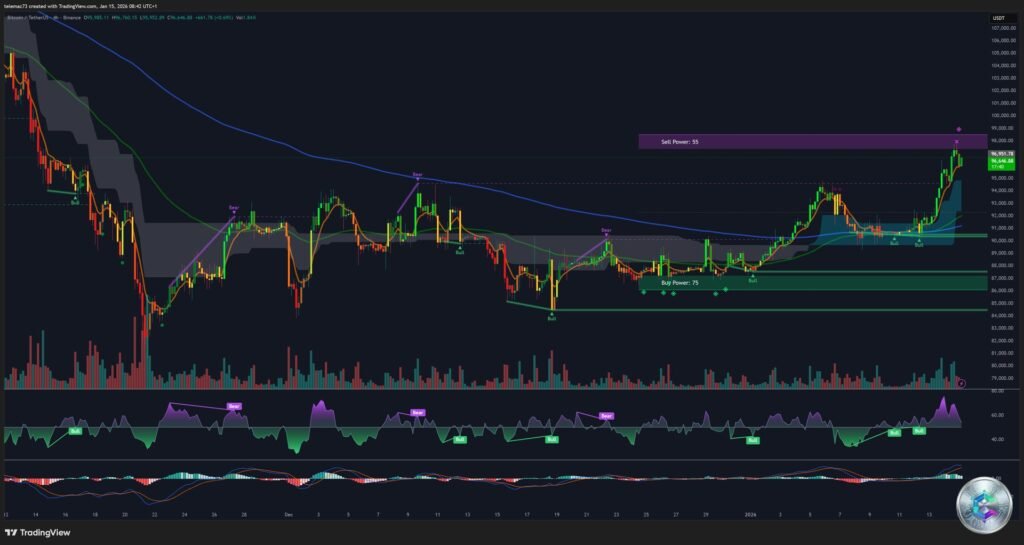
The 4-hour chart reveals a symmetrical triangle or pennant formation, a typical continuation pattern. Price recently printed a local higher high above $96,000, followed by healthy consolidation. As long as price respects the series of « higher lows, » the probability of breakout is to the upside.
However, beware of « scam pumps » during the Asian session. Bullish pushes occurring with low liquidity are often retraced as soon as European or American markets open. A valid break of $97k should ideally occur during high liquidity hours to be sustainable.
15-Minute Timeframe: Pivot Point Trading
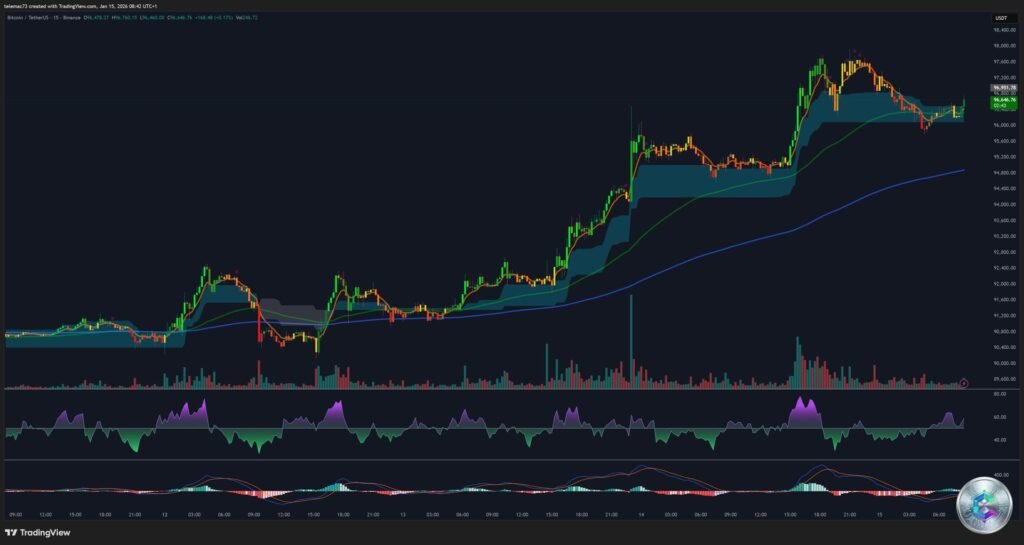
For intraday traders, standard pivot points provide key levels:
- Central Pivot Point (P): ~$96,674
- Resistance 1 (R1): $97,016 – First obstacle
- Resistance 2 (R2): $97,541 – Breakout watch zone
- Support 1 (S1): $95,365 – Preferential buying zone
- Support 2 (S2): $95,014 – Strong intraday support
The Stochastic RSI is currently in oversold territory, suggesting a short-term technical rebound is likely to test the VWAP or pivot.
Scenarios and Key Levels
Bullish Scenario (Probability: 60%)
Trigger: An H4 close above $97,500 with sustained volume, coinciding with positive news from the Senate Banking Committee.
Mechanics: Activation of short liquidation zone → Short Squeeze → Vertical acceleration.
Targets: $100,000 (psychological), then $103,000-$107,000 (technical extensions).
Consolidation Scenario (Probability: 30%)
Trigger: Failure to break EMA cluster and return below pivot ($96.6k), followed by loss of S1 support ($95.3k).
Targets: Return to value zone of $92,000-$93,000.
Major Technical Levels Table
| Level Type | Price | Significance |
|---|---|---|
| Major Resistance | $100,000 | Ultimate psychological barrier |
| Technical Resistance | $97,500-$98,000 | EMA cluster and local tops |
| Current Price | ~$96,370 | Friction zone |
| Intermediate Support | $93,500-$94,000 | Former resistance/support |
| Structural Support | $86,000 | Consolidation channel floor |
| Critical Support | $74,000 | LT bullish trend invalidation |
Conclusion: A Decisive Moment
Bitcoin stands at the dawn of a major directional move. The alignment of fundamental catalysts (CLARITY Act, falling inflation) and technical factors (favorable heatmap, discharged indicators) argues for bullish continuation toward $100,000. Market structure suggests an explosive breakout is imminent, with a clearly bullish bias.
However, professional traders must remain vigilant regarding risks: banking opposition to the bill, Asian session volatility, and possible « stop hunts » require rigorous risk management.
Recommendation: Bullish bias. Preferred accumulation on pullbacks toward $95,000-$95,500 with strict stop loss below $91,800. Primary target: $100,000.
⚠️ Important Disclaimer: This analysis is provided for informational and educational purposes only. It does not constitute financial investment advice in any way. Trading crypto-assets involves high risks of capital loss. Always conduct your own research (DYOR) and only trade with funds you can afford to lose. Consult a professional financial advisor before making any investment decision.