
On the morning of June 5, 2026, Bitcoin stands frozen at a critical crossroads. After reaching an all-time high of $126,200 in October 2025, the world’s leading cryptocurrency has endured a brutal sequence of corrections that pushed it below the psychologically vital threshold of $62,000. The price oscillates between $61,977 and $63,887 — consolidating a colossal loss from the recent local peak of $71,765 set at the start of June. This configuration is no statistical coincidence: it results from a toxic confluence of macroeconomic shocks and structural fragilities rooted in excessive derivatives leverage.

⚡ Macro: The Fed’s Vice and the NFP Verdict
Bitcoin’s valuation in spring 2026 remains viscerally correlated with Western central bank monetary policy. The current environment is defined by a resurgence of hawkish signals from the Federal Reserve. The prolonged maintenance of elevated rates — the « higher-for-longer » strategy — methodically drains speculative capital away from non-yield-bearing asset classes like cryptocurrencies, redirecting it toward sovereign bond markets.
The June 5 session hangs entirely on the imminent release of the US monthly employment report, the Nonfarm Payrolls (NFP). The median consensus projects 85,000 to 95,000 new non-farm jobs with an unemployment rate stagnating around 4.3%. More optimistic factions anticipate between 115,000 and 130,000 job creations.
- Strong NFP → validates Fed hawkish rhetoric, DXY appreciation, devastating selling pressure on risk assets, possible test of $60,000.
- Weak NFP → revives hopes of Q3 rate cuts, dollar weakening, catalyst for a technical rebound toward $65,000.
Meanwhile, Broadcom’s disappointing AI forecasts triggered a massive sector rotation toward defensive equities. The Dow Jones hit a new all-time high (+1.73%) while the Nasdaq bore the brunt of tech liquidations — a correlation that directly penalizes Bitcoin, widely classified as a high-beta proxy for the tech sector.
🔬 On-Chain Fundamentals: Anatomy of a Collapse
The crash that began on June 2, 2026 is not a mere stochastic fluctuation. It is the inevitable result of deep deterioration in fundamental metrics, compounded by an acute imbalance in derivatives market microstructure.
The Strategy Myth Shatters
On June 1, Strategy — the world’s largest corporate Bitcoin holder — disclosed in an SEC filing that it had sold 32 Bitcoins to raise approximately $2.5 million to fund quarterly preferred share dividends. While statistically negligible against the billions traded daily, this transaction shattered the absolute narrative of perpetual accumulation that the company had carefully constructed over years. This psychological shock, layered on top of a much heavier structural trend, was enough to rattle the most fragile segment of the market.
The Bitcoin ETF Hemorrhage
Since the start of June, cumulative net outflows from US spot Bitcoin ETFs have surpassed the alarming threshold of $10 billion. The timeline of withdrawals tells the story: $3.97 billion on June 3, followed by an additional $2.35 billion on June 4. These institutional disengagements reflect tactical portfolio adjustments in favor of higher-yielding opportunities (AI IPOs, infrastructure financing) rather than a permanent loss of faith in the technology.
The Liquidation Cascade: Mechanics of Destruction
Prior to the collapse, the market had accumulated toxic leverage levels. The leverage ratio on open futures contracts had climbed to 2.63%, and perpetual swap leverage reached 2.48% — levels unseen since October 6, 2025, exactly 24 hours before the cycle’s « Black Friday » liquidation event.
In the first hour of the June 2 break, $394 million in leveraged positions were wiped out. Over 24 hours, total crypto-wide liquidations reached a staggering $12.53 billion, with over 77% (≈$9.7B) absorbed by long positions. On Bitcoin alone, the destruction totaled $1.8 billion, permanently eliminating over 272,000 individual traders.
On-chain data had already signaled the storm: 58,617 Bitcoins had been moved from cold wallets to exchange hot wallets — a record since mid-April 2026. The reactivation of the Mt. Gox entity on June 4, moving 116.3 BTC to Bitstamp, amplified the panic sentiment despite its modest absolute volume.
📊 Multi-Timeframe Technical Analysis
Daily Chart: The Weight of Macro Trend
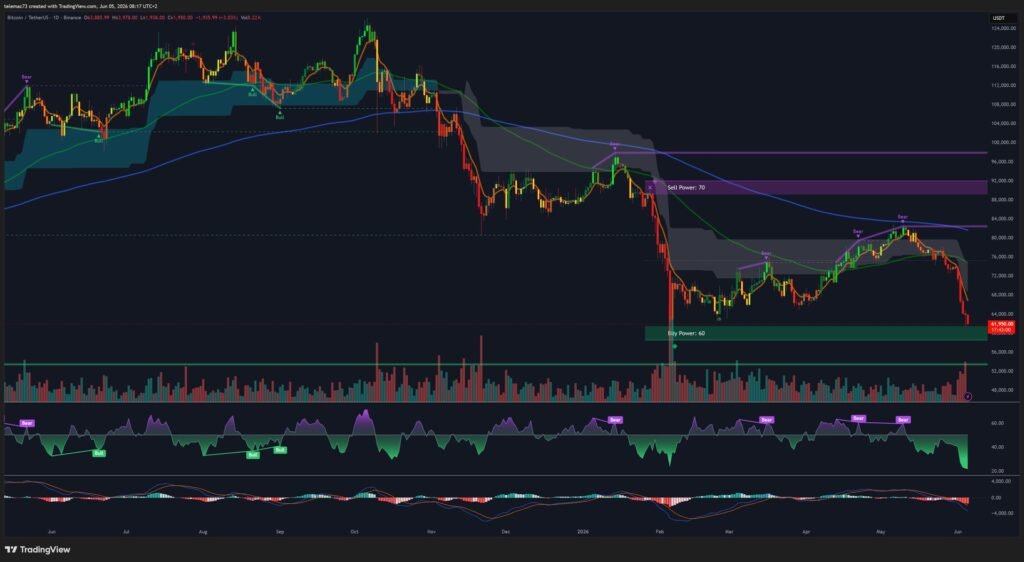
The daily chart presents a grim picture. A sequence of wide-bodied bearish candles (Marubozu-type) dominates the structure. The proprietary « Sell Power » indicator stands at 70, crushing a « Buy Power » of only 60.
- Imminent Death Cross: The fast moving average threatens to cross below the slow one — a secular bear market entry signal for quantitative algorithms.
- RSI in extreme oversold territory (<30): A nascent bullish divergence (RSI higher low vs. price lower low) represents the only glimmer of hope.
- Abyssal MACD: Deep red histogram bars confirm the unrelenting acceleration of bearish momentum.
4-Hour Chart (H4): The Bear Flag Formation
On the H4 timeframe, the consolidation between $61,000 and $64,000 exhibits all the characteristics of a Bear Flag — one of the most reliable bearish continuation patterns in technical analysis. « Sell Power: 73 » overwhelms « Buy Power: 57 ». However, the H4 MACD is sketching the early stages of a Golden Cross below the zero line — a sign of seller exhaustion, not trend reversal. The $65,000 level represents the convergence point of all dynamic algorithmic resistances (EMA 50, Heatmap supply wall, distribution zone).
15-Minute Chart (M15): Compression Before the Explosion
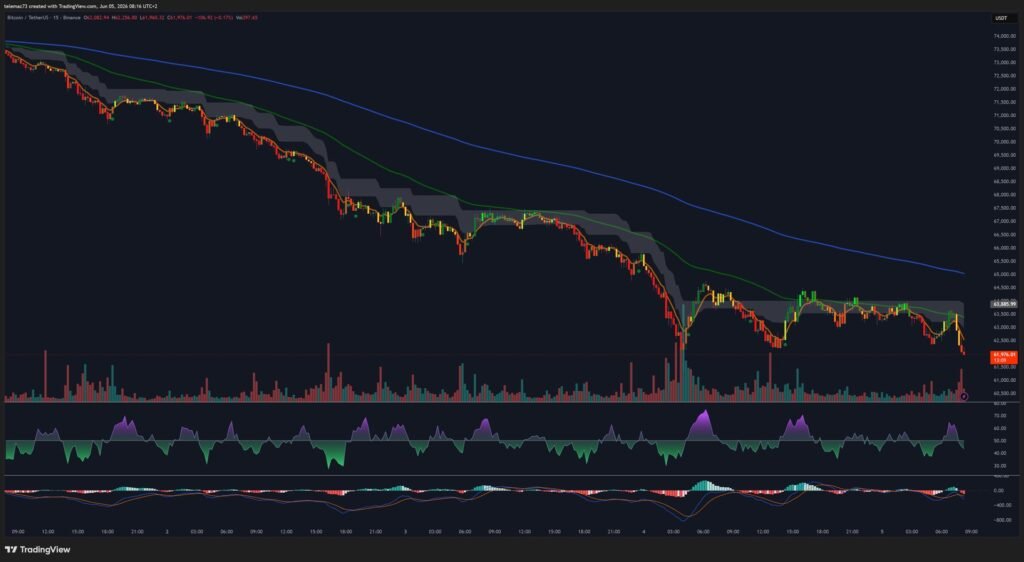
The M15 timeframe reveals a perfect symmetrical compression triangle, trapped between ~$62,800 ceiling and ~$61,000 floor. Trading volumes are in freefall — the market is momentarily abandoned to minor arbitrage algorithms. M15 oscillators (RSI ~50, flat MACD) give no directional signal. The professional interpretation is unequivocal: no capital allocation is justified before the NFP exogenous shock. A « fakeout » — false break in both directions within milliseconds of the announcement — is an algorithmically near-certain scenario.
🌡️ Order Book Heatmap: The Liquidity War
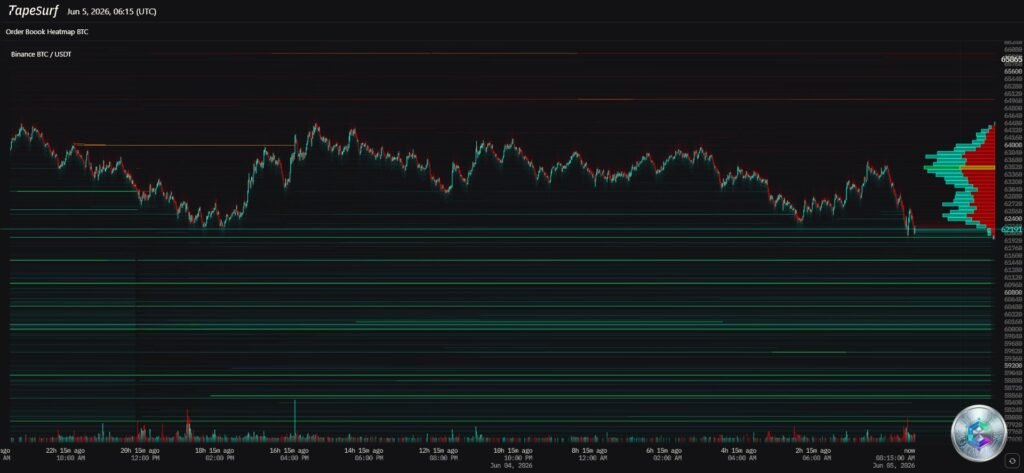
- Bid wall: Dense green bands clustered on and below $60,000, extending to $59,000 — institutional safety nets deployed to capitalize on a potential final capitulation extension.
- Ask wall: Incandescent red and yellow blocks stacked aggressively from $63,500 to $66,799 — institutional glass ceiling of short-term supply concentration.
- Liquidity void: Between ~$62,200 and $63,500, any dovish NFP surprise would propel price toward $63,500 at blistering speed — before colliding with the algorithmic sell wall above $64,000.
🗺️ Key Price Levels Reference Map
| Level (USD) | Type | Significance |
|---|---|---|
| $67,895 | Major Macro Resistance | Origin of June 2 flash crash. Former support flipped to resistance. |
| $65,000 | Glass Ceiling | EMA 50 H4 + maximum ask density on Heatmap. Structural recovery validation level. |
| $62,500 – $63,450 | Current Pivot Axis | Center of gravity of M15 compression triangle. |
| $61,655 – $61,300 | Local Support | Last line of defense during recent forced liquidations. |
| $60,000 | Major Macro Support | Ultimate psychological threshold. Bull market lifeline. Institutional bid wall (Heatmap). |
| $55,000 – $58,000 | Ultimate Capitulation Zone | Geometric projection target if Bear Flag H4 breaks down. Deep Fibonacci retracement. |
🎯 Forward-Looking Scenarios
Bearish Scenario (Dominant Probability) — Test of $60,000
A strong NFP print (>115,000 job creations + wage acceleration) would cement the Fed’s restrictive narrative. The M15 triangle would break violently downward, geometrically validating the H4 Bear Flag. Price would be pulled toward the gravitational well of $60,000. If this colossal institutional support fails under the weight of continued ETF outflows, the $55,000–$58,000 macro invalidation zone becomes the next target.
Bullish Scenario (Moderate Probability) — Short Squeeze Toward $65,000
A disappointing NFP (<85,000 creations) would instantaneously reprice Fed rate cut probabilities for Q3. The DXY would weaken, Treasury yields would ease, and a massive algorithmic capital rotation would propel Bitcoin upward. The immediate target is $65,000. A convincing daily close above this level would reopen the path toward $67,895 and ultimately validate the institutional long-term thesis: Bernstein targets $150,000, Standard Chartered $100,000, both for end-2026.
🏦 Altcoin Contagion and Long-Term Perspective
The shockwave is rippling across the entire ecosystem. Cardano (ADA) collapsed -12% in 24 hours (from $0.214 to $0.188), exacerbated by the shutdown of TapTools — Cardano’s leading native analytics platform — overwhelmed by operating costs and executive departures. Founder Charles Hoskinson himself warned the community about likely project closures throughout 2026.
Paradoxically, this broad purge structurally fuels a « flight to quality » toward Bitcoin — the only asset deemed sufficiently resilient by institutional capital to weather the storm.
Long-term adoption fundamentals remain intact: the SEC has included digital assets in its 2026–2030 strategic plan, and Mastercard has deployed 24/7 stablecoin settlement infrastructure across 8 blockchains (Ethereum, Solana, XRP Ledger, and others). The structural foundation for a long-term recovery is being built even as short-term price action remains under pressure.
⚠️ Disclaimer: This article is written for educational and informational purposes only. It does not constitute investment advice or a recommendation to buy or sell any digital asset. Cryptocurrency markets are extremely volatile and carry the risk of total capital loss. Always consult a qualified financial advisor before making any investment decision.