
Introduction: A Market at the Crossroads
At the close of March 2026, Bitcoin (BTC) is navigating a phase of structural and macroeconomic transition of rare complexity. After reaching a breathtaking all-time high (ATH) of $126,080 in October 2025, the flagship digital asset underwent a prolonged and methodical correction, erasing nearly half its market capitalization. It now consolidates in a highly volatile trading range between $62,000 and $72,000, buffeted by an unprecedented confluence of exogenous pressures and shifting endogenous dynamics.
This analysis provides a comprehensive dissection of Bitcoin’s market microstructure, grounded in a rigorous multi-timeframe approach integrating 15-minute, 4-hour, and daily charts. Beyond pure chart reading, we incorporate analysis of liquidation heatmaps, institutional capital flows via ETFs, and global macroeconomic variables.
🌍 Macroeconomic Environment: Bitcoin’s Definitive Financialization
Geopolitics and the Energy Shock
Q1 2026 was dominated by a sharp deterioration in geopolitical stability across the Middle East. Conflicts involving Iran, Israel, and the United States directly impacted global energy infrastructure, propelling crude oil prices past the psychological threshold of $100 per barrel. This energy price spike acts as a powerful inflationary catalyst and a regressive tax on global growth.
Crucially, in this context Bitcoin is behaving less like digital gold and more like a high-beta technology stock. During acute stress peaks, institutional investors — now holding a significant share of BTC supply — liquidate their riskiest positions to seek refuge in the US dollar or physical gold, which has flirted with all-time highs around $5,400/oz.
Monetary Policy, PCE Inflation, and Equity Correlation
The oil price rebound reignites the specter of persistent inflation, considerably complicating the Federal Reserve’s equation. Markets had priced a 72% probability of a June 2026 FOMC rate cut, but those expectations are extremely fragile. A Core PCE print above 2.8%–3.0% would crush those hopes, extending the « higher for longer » rate regime.
The BTC/S&P 500 30-day rolling correlation stands at 0.55, rising from 0.50 in October 2025, with weekly peaks hitting 78% during maximum stress. Bitcoin is now fully embedded in global macroeconomic portfolio reallocation dynamics.
| Macro Indicator | Value (March 2026) | Impact on Bitcoin |
|---|---|---|
| S&P 500 Correlation (30D) | 0.55 (weekly peak 78%) | BTC trades as high-beta risk asset |
| Fear & Greed Index | 10–14 / 100 (Extreme Fear) | Retail capitulation — potential macro floor |
| BTC Dominance (BTC.D) | 56.5%–58.1% | Capital flight from altcoins into BTC |
| T-Bill Yield (risk-free rate) | ~4.5% | High opportunity cost for holding BTC |
🏦 Institutional Flow Dynamics: The ETF Era
The Basis Trade Unwind and the February Purge
Between October 2025 and February 2026, Bitcoin ETFs recorded cumulative net outflows exceeding $6.18 billion. However, this hemorrhage was not driven by directional panic — it resulted from the collapse of an arbitrage strategy known as the basis trade (or cash-and-carry).
This strategy involves buying BTC spot (via an ETF) while simultaneously selling futures at a higher price, capturing the premium (contango) without directional risk. Throughout 2025, this annualized premium exceeded 15%, attracting billions in neutral institutional capital. With prices correcting, the premium collapsed to 2.4% on a 30-day basis — below the ~4.5% risk-free T-Bill rate. Hedge funds mechanically unwound their positions, creating a devastating negative feedback loop.
March Inflection: The Institutional Floor
The dynamic reversed remarkably in March 2026. As price approached the structural $62,000 support, a fresh wave of accumulation emerged. Bitcoin ETFs attracted over $2.5 billion in inflows, recovering approximately 38,000 BTC. Giants like BlackRock (IBIT) and Fidelity (FBTC) led single-day inflow sessions exceeding $458 million.
Remarkably, despite an average ETF cost basis of $80,000–$85,000, approximately 94% of total ETF holdings were retained through the crash — demonstrating institutional « sticky money » resilience that structurally buffers downside volatility.
| Entity | Activity (March 2026) | Structural Impact |
|---|---|---|
| BlackRock (IBIT) & Fidelity (FBTC) | +$2.5B inflows in March | Inelastic demand floor below $70K |
| MicroStrategy | 720,737 BTC (avg. cost $75,985) | Free float reduction; upside price sensitivity |
| Whales (1K–10K BTC) | Active accumulation below SMA20 ($67,100) | Wealth transfer from weak to strong hands |
| Miners | Sales declined from -4,718 to -837 BTC | Structural sell pressure exhaustion |
| Exogenous sellers (Bhutan, FTX) | Ongoing sales + $2.2B FTX distribution | Persistent local bearish friction |
📊 Technical Analysis: Daily Chart (1D)
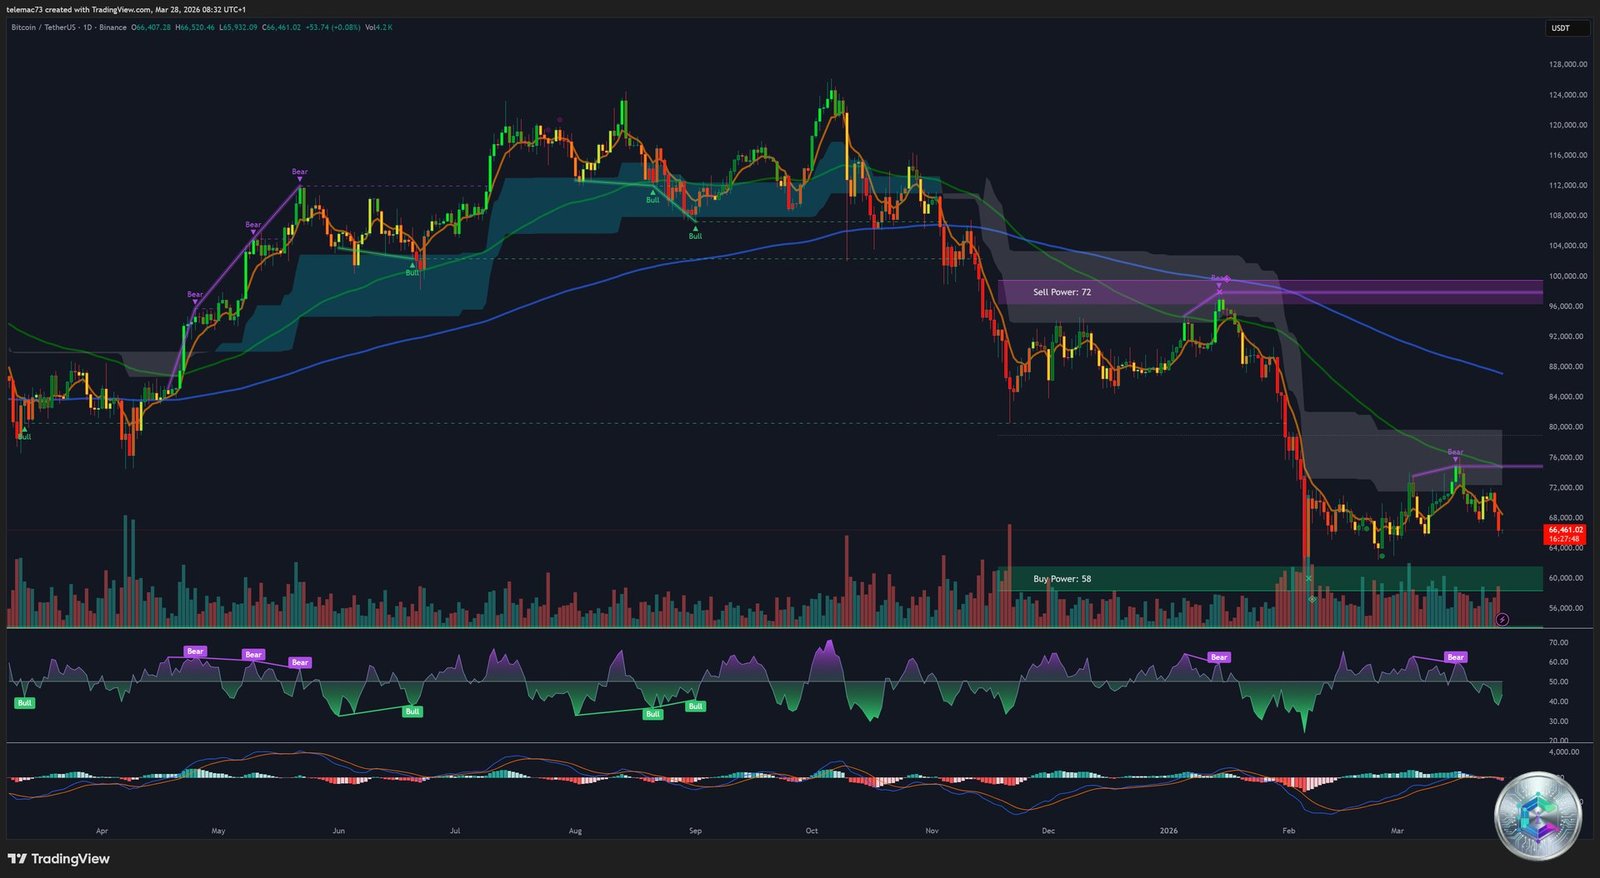
Anatomy of the Macro Bear Flag
Since the October 2025 ATH, price action has carved out the distinct contours of a Bear Flag continuation pattern, composed of two fundamental elements:
- The Flagpole: The initial violent collapse from $100,000+ to local lows, driven by exogenous deleveraging and the oil shock.
- The Flag Body (Consolidation): For nearly 50 days, the market has compressed volatility within a slightly ascending channel, rigidly bounded by the $62,300 support and the $72,000 resistance.
The canonical resolution of this pattern is a breakdown, with the « Measured Move » projecting a target between $42,000 and $45,000. However, the consolidation has stretched beyond 7 weeks — far exceeding the typical 2–14 day timeframe — and tests of the lower boundary have been accompanied by institutional absorption volume spikes. This suggests the pattern could represent structural re-accumulation rather than a prelude to capitulation.
The Death Cross: An Alarming Signal
The daily chart has recently confirmed a Death Cross: the 50-day SMA (~$71,200–$75,129) crossing below the 200-day SMA (~$82,400–$91,886). Historically, this signal has preceded average returns of -35% in the month following confirmation on BTC (e.g., June 2022). It currently forms a technical barrier in perfect confluence with the Bear Flag’s upper trendline.
Momentum Oscillators
- RSI (14D): ~44–46. Neither oversold nor overbought — complete indecision. Yet this « headroom » means a positive catalyst could fuel a prolonged rally without immediately overheating.
- MACD: Histogram remains in negative territory, confirming persistent bearish pressure. No bullish Golden Cross yet, though the gap is narrowing.
📈 Tactical Analysis: 4-Hour Chart (4H)
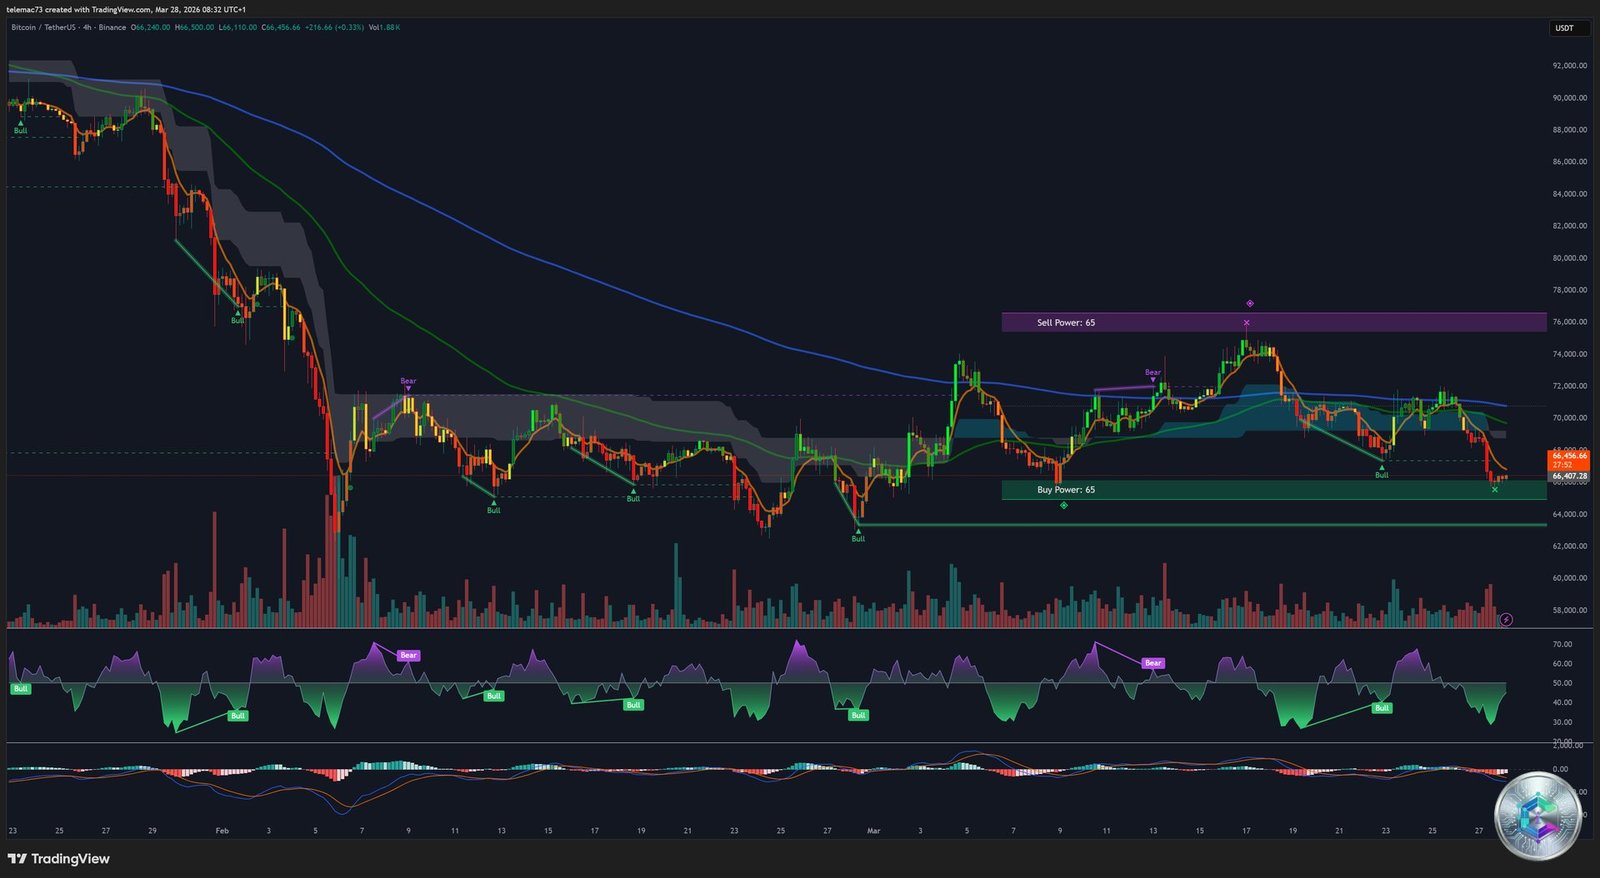
On the 4H chart, Bitcoin is literally entangled in its fast moving averages. Price snakes around the 20-period EMA (~$70,200) and the 50-period EMA, unable to break away directionally. This constant interaction is characteristic of a ranging market, amplified by institutional mean-reversion strategies.
Inside the broader $65,000–$72,000 range, micro-structures form and break continuously: falling wedges and symmetrical compression triangles deliver brief relief rallies pushing price temporarily above $70,000–$71,000. However, these breakouts lack the volume participation required to transform a tactical bounce into a structural trend reversal — the massive sell wall at $72,000 absorbs every attempt.
⚡ Intraday Microstructure: 15-Minute Chart (M15)
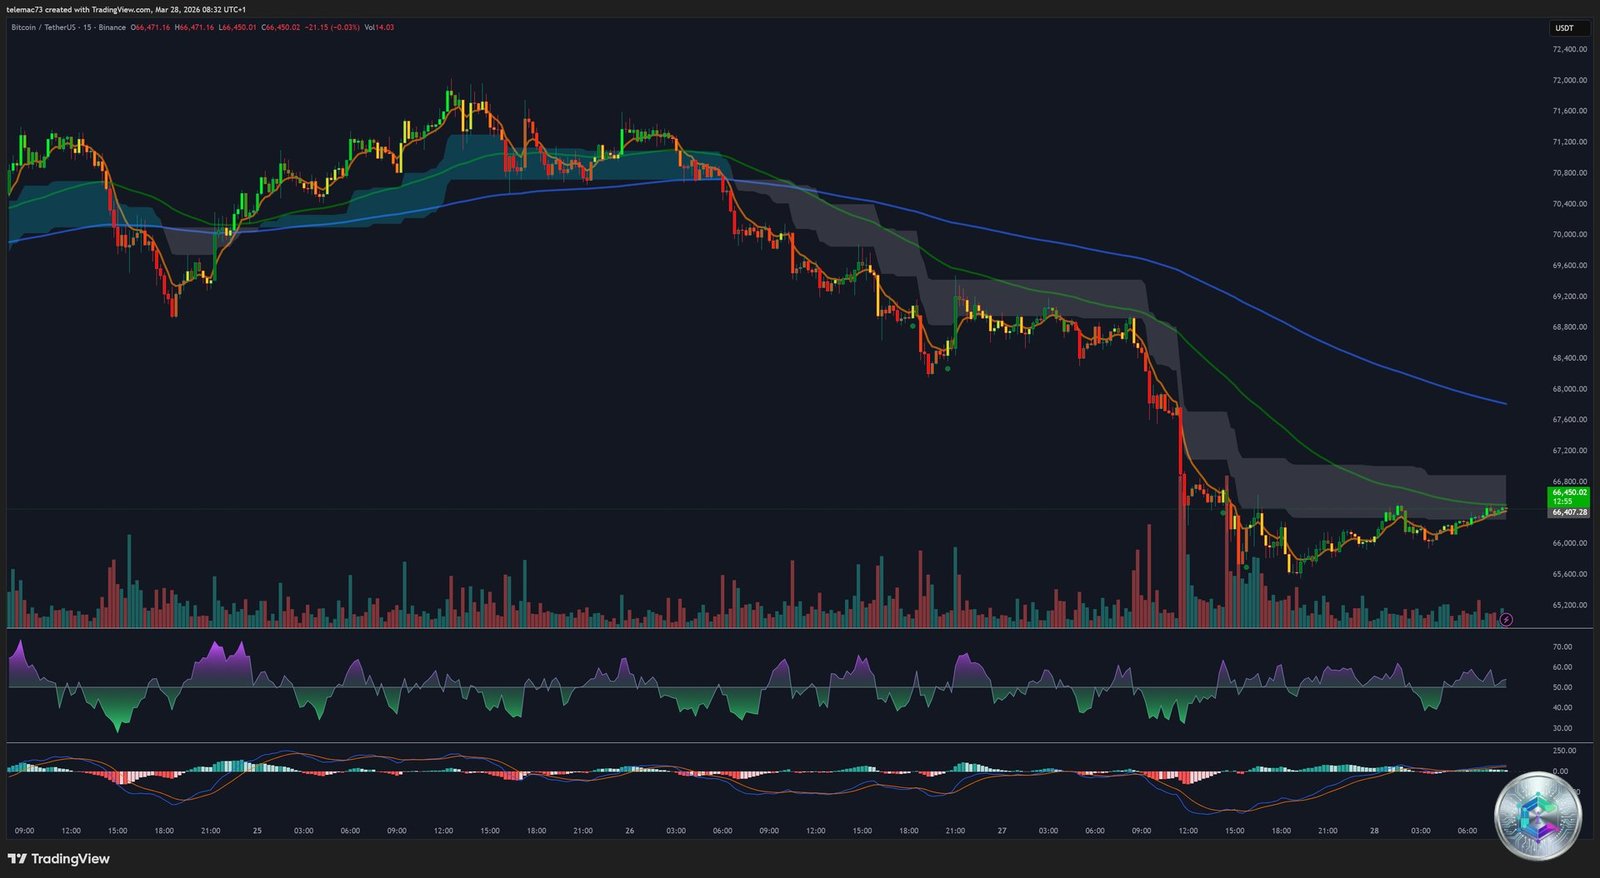
At the 15-minute scale, macroeconomics gives way to pure order book mechanics and instantaneous psychology. The M15 chart is heavily influenced by derivatives expiry dynamics. During the recent $14 billion options expiration (BTC + $2.12B in ETH options on Deribit), the M15 chart displayed erratic « pinning » behavior — market makers buying/selling spot BTC to maintain delta-neutral positions, creating long wicks on both sides sweeping stop-losses before recentering price toward the Max Pain zone of $66,500–$68,000.
High-frequency traders systematically exploit short-period RSI: an M15 RSI below 20 triggers algorithmic buy walls capturing $500–$1,000 bounces; readings above 80 are immediately punished with tactical scalp shorts. This institutional « ping-pong » will continue until a fundamental catalyst breaks algorithmic parameters.
🔥 Liquidation Heatmap: The Risk Map
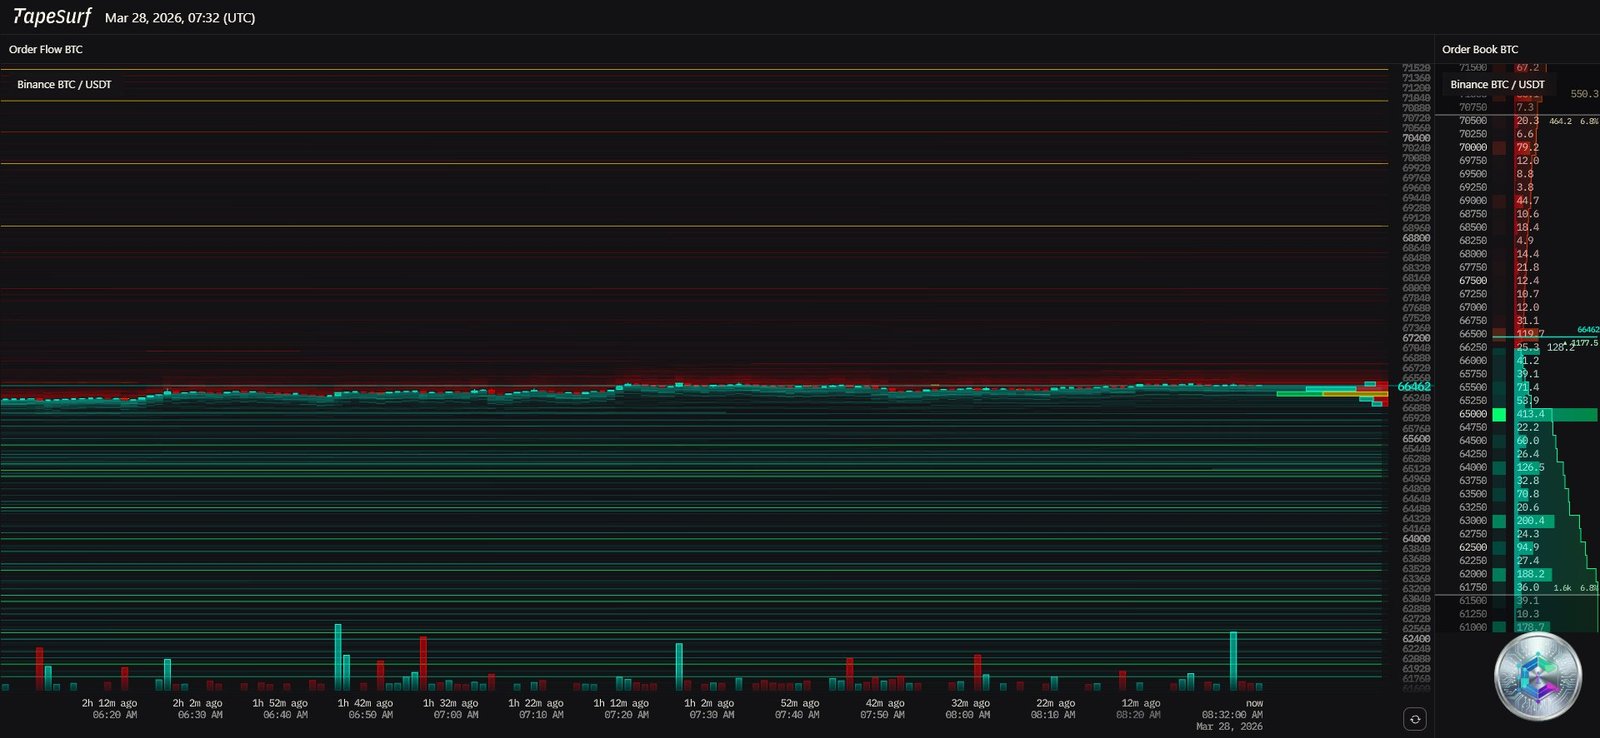
Combined Open Interest (OI) for BTC/ETH perpetual futures has exploded to approximately $30 billion ($23B allocated to BTC specifically) — the highest level since January. This concentration of leverage within a narrow range generates two major price attraction zones:
- ⬇ Bearish Danger Zone ($62,000–$65,000): Dense clusters of long position stop-losses. A decisive break below $62,300 would cascade-liquidate over $673 million in long positions, propelling price toward $57,000 through forced selling alone.
- ⬆ Bullish Attraction Zone ($72,000–$75,000+): Massive short squeeze potential. A break above $72,800 would trigger forced short-covering that acts as algorithmic fuel, with liquidation targets cascading all the way to $100,000–$115,000.
🗺️ Strategic Price Level Architecture — Q2 2026
| Zone | Level (USD) | Significance |
|---|---|---|
| 🎯 Macro Resistance | $79,000 – $80,000 | Bull market recovery. Fully invalidates the bearish cycle. |
| 🚧 Key Resistance (Pivot) | $72,000 – $72,800 | Glass ceiling. Confluence: EMA50 + Bear Flag + distribution. The most important level of the quarter. |
| ⚠️ Intermediate Resistance | $70,500 – $71,468 | Upper range boundary. Rejection likely without a catalyst. |
| 🔄 Current Pivot Zone | $68,242 | March 2026 center of gravity. No-trade zone for medium-term directional investors. |
| 🛡️ Short-Term Support | $67,500 | Intraday waterline. |
| 🔴 Macro Support (The Floor) | $62,300 – $63,700 | Ultimate defense line. Break = Bear Flag confirmation. |
| ☠️ Capitulation Target | $42,000 – $45,000 | Bear Flag Measured Move target. Generational buying zone. |
🎯 Directional Scenario Modeling
📗 Bull Case: The Macro-Fundamental Squeeze
The primary catalyst would be a Core PCE print significantly below expectations (<2.6% YoY), instantly rehabilitating the Fed rate cut narrative for summer 2026 and weakening the DXY. Combined with a diplomatic pause in Middle East hostilities, risk appetite would explode.
Bullish cascade: Break above $70,000 → absorption of $72,000 → Death Cross invalidation → violent short squeeze → projection to $80,000 and beyond ($110,000–$120,000 possible). Third-order implication: Bitcoin would confirm its mutation into an asset capable of navigating standard macroeconomic corrections (30–50%), aligning with behavior of global large-cap tech stocks.
📕 Bear Case: The Final Capitulation
A Core PCE above 2.8%–3.0% would force the Fed to maintain prolonged restrictive conditions. Geopolitical resurgence driving oil prices uncontrollably would trigger acute global risk-off sentiment.
Bearish cascade: Constant pressure on declining MAs → assault on $62,300 → Bear Flag + Death Cross validation → algorithmic liquidation cascade → freefall toward $42,000–$45,000. Paradoxically, this cataclysmic purge would be the necessary mechanism to fully flush excessive leverage from the system, resetting valuations to levels where miner production costs and pure institutional demand become the sole market arbiters — laying foundations for a new, healthy secular cycle.
✅ Conclusion: Walking a Mathematical Tightrope
Bitcoin at the end of Q1 2026 stands on a mathematical tightrope, pulled between repressive macroeconomic forces and an internal market architecture that refuses to collapse. The multi-timeframe analysis reveals a compression of volatility of absolute rarity: a macro Bear Flag on the daily chart restrained by the resolute accumulation of corporate entities and spot ETFs. The Death Cross looms above $72,000, ready to unleash if US inflation dictates continued monetary tightening.
The $65,000–$70,000 zone constitutes a technical « no man’s land » where risk-adjusted returns are unfavorable for medium-term directional positions. The binary resolution will not be nuanced: either the $72,000 pivot is broken with force and volume — invalidating the technical burden and opening the path to price discovery toward new highs — or the $62,300 rampart gives way, triggering the final algorithmic clearing toward the $45,000 depths. The outcome of this configuration will define Bitcoin’s identity for the remainder of the decade.
⚠️ Disclaimer: This article is written for exclusively educational and informational purposes. It does not constitute investment advice, nor a recommendation to buy or sell digital assets or any other financial instrument. Cryptocurrency markets are extremely volatile and carry significant risk of capital loss. Please consult a licensed financial advisor before making any investment decision.