


The digital asset market, led by Bitcoin (BTC), is navigating a major structural transition during the second week of May 2026. Following a prolonged correction from the all-time highs reached in September 2025, technical and macroeconomic data are now converging toward a phase of institutional re-accumulation — a fragile equilibrium, like a coiled spring ready to release.
🌐 Macroeconomic & Geopolitical Context
Bitcoin’s trajectory in May 2026 cannot be separated from the global geopolitical climate. Persistent tensions in the Middle East, particularly between Iran and the United States, have reignited the narrative of Bitcoin as a non-sovereign store of value. The partial blockade of the Strait of Hormuz and energy price uncertainty have driven increased volatility across traditional asset classes, while Bitcoin has demonstrated remarkable relative resilience over the past 30 days.
On the institutional front, adoption has reached a new milestone. US spot Bitcoin ETFs are now absorbing a significant portion of the circulating supply. BlackRock’s IBIT fund has emerged as a structural shock absorber, neutralizing selling pressure from long-term holders. This institutionalization of the market is fundamentally altering how price responds to idiosyncratic events.
| Macroeconomic Factor | Status (May 12, 2026) | Expected BTC Impact |
|---|---|---|
| US Consumer Price Index (CPI) | Imminent release | Immediate directional volatility |
| US Spot ETF Inflows | AUM in sustained growth | Long-term structural support |
| Geopolitical tensions (Iran) | Negotiations ongoing / Stalemate | Reinforcing « Digital Gold » narrative |
| Market Sentiment | Neutral to moderately bullish | Lateral accumulation |
📊 Daily Chart (D1) Analysis: Structural Reversal
The daily chart bears witness to a major technical paradigm shift. The confirmed breakout from the multi-month descending channel that had contained price action since the September 2025 all-time high represents the most robust signal of an ongoing trend reversal.
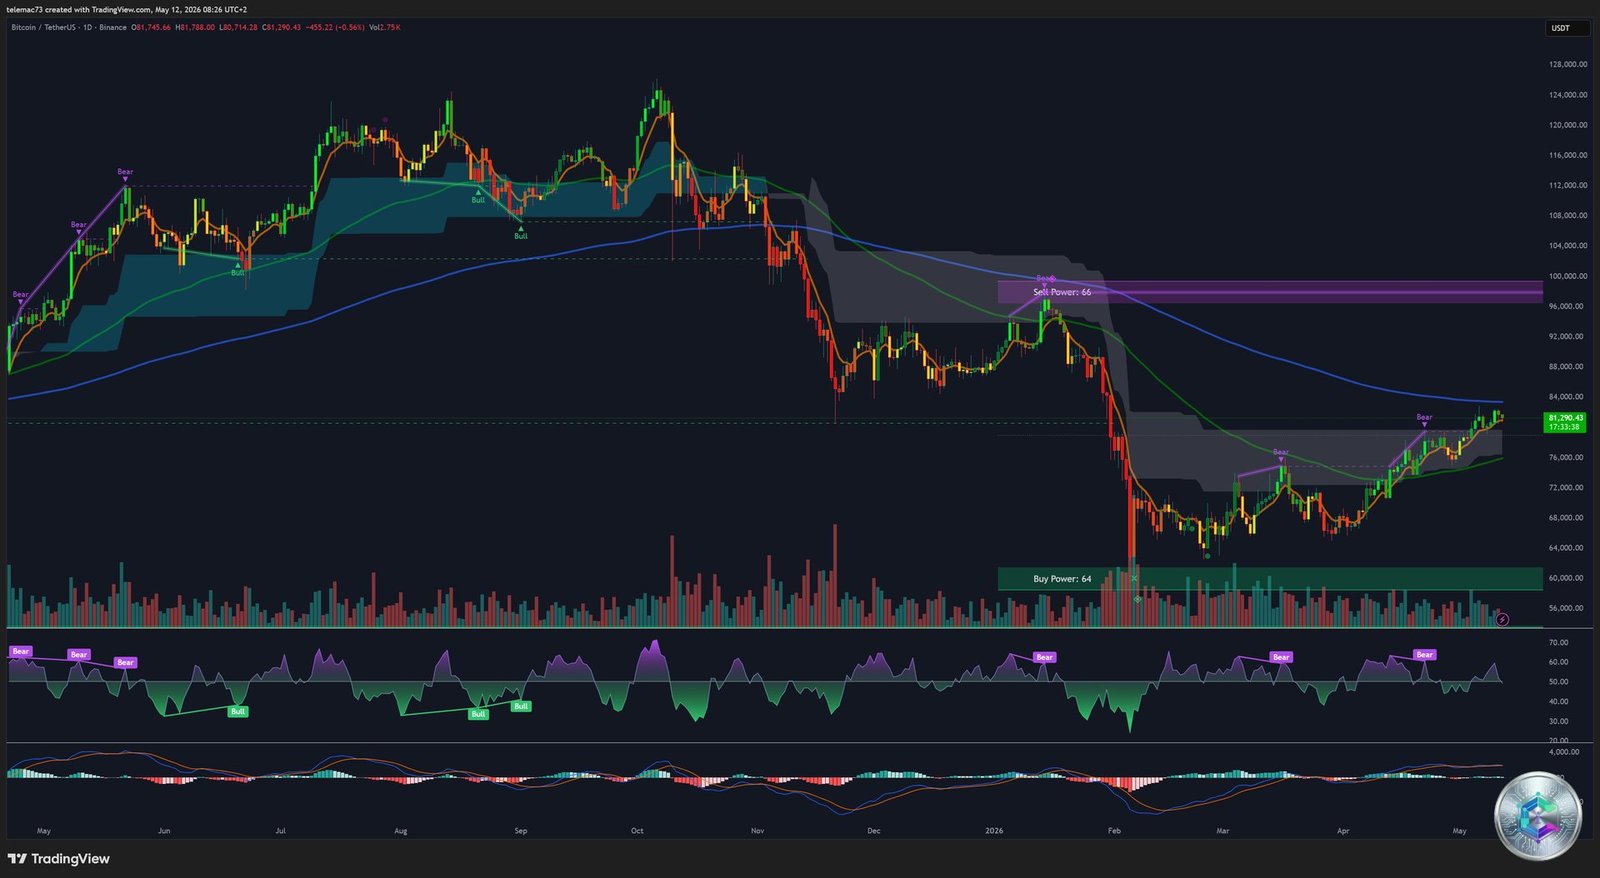
The exponential moving average (EMA) structure has improved significantly. Price is now trading above the 200-day EMA — the historic threshold that separates bear market phases from bullish recovery regimes. The 50-day EMA served as a critical dynamic support during the last liquidity test, confirming strong institutional demand at these levels.
The daily MACD reveals a pronounced bullish divergence with a positive signal line crossover below the zero line — a configuration that often precedes multi-week price expansions. Bitcoin has also reclaimed the « Bull Market Support Band, » a key on-chain indicator that had not been breached in six months.
| Technical Level (Daily) | Strategic Significance |
|---|---|
| Critical Resistance | Fibonacci Golden Ratio / CME Gap to fill |
| Trend Pivot | Bull/Bear demarcation line |
| Immediate Support | Psychological barrier / ETF flow support |
| Structural Support | 100-day MA / Institutional defense line |
| Consolidation Floor | February 2026 low — strategic buy zone |
⏱ 4-Hour Chart (H4) Analysis: Consolidation & Continuation
The 4-hour chart provides a granular view of the ongoing battle at the major psychological resistance level. Price action is characterized by a series of Higher Highs and Higher Lows, defining a healthy and progressive uptrend.
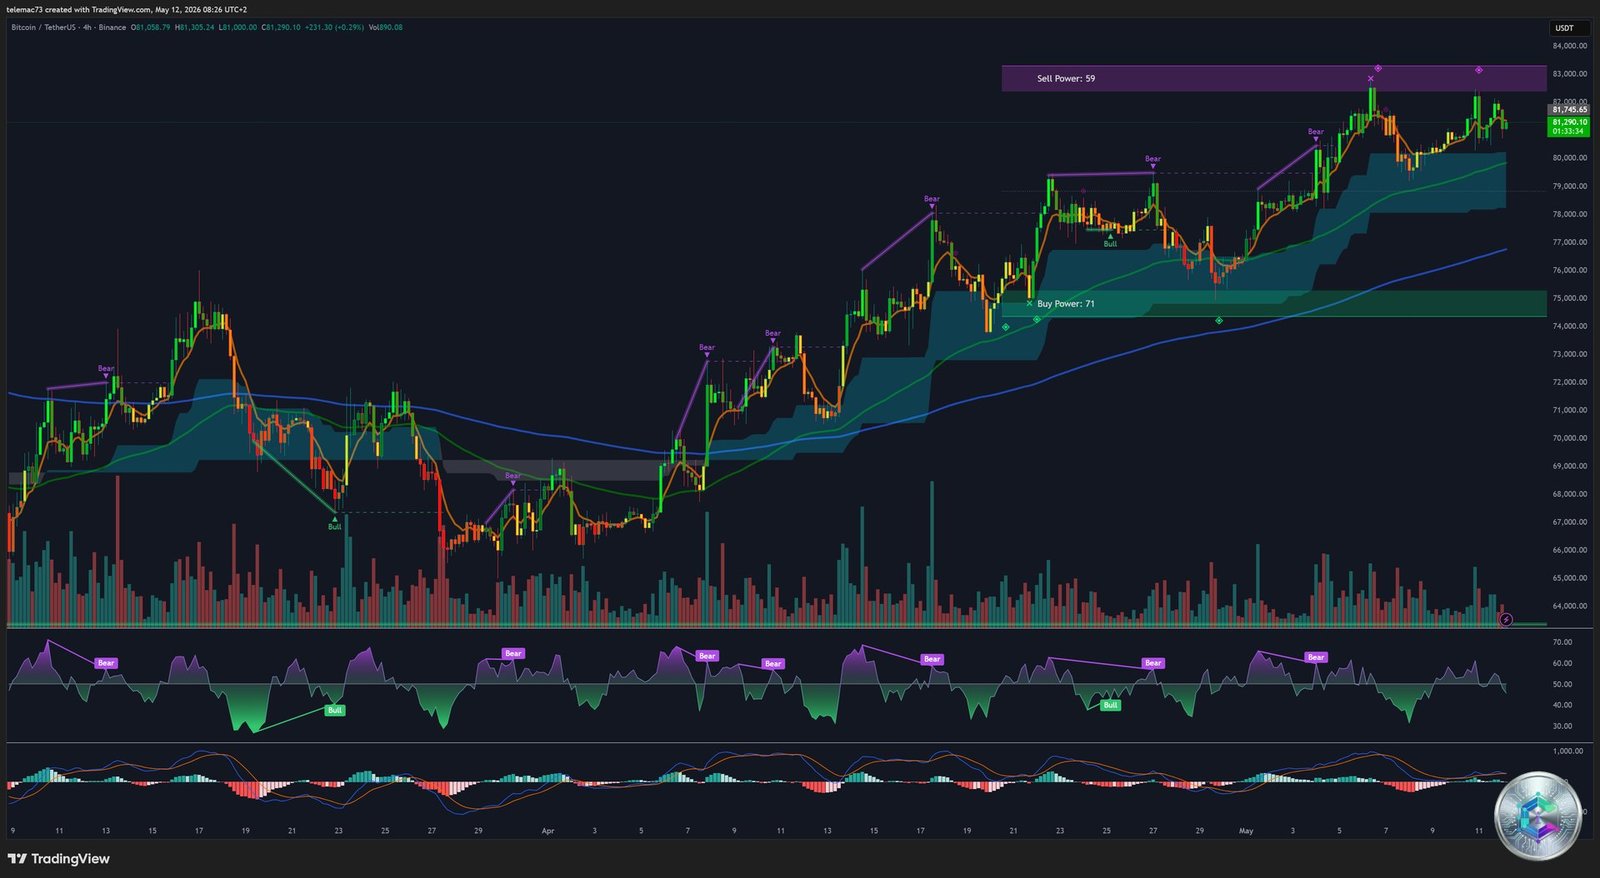
Chart pattern analysis reveals the formation of a Bull Flag following the major impulse move at the start of May. This continuation pattern manifests as a lateral consolidation with a slight downward slope, accompanied by a notable decrease in volume — a classic sign of a pause before the next bullish impulse.
Simultaneously, a symmetrical compression triangle illustrates the temporary equilibrium between institutional buyers (via ETFs) and short sellers defending the major resistance. A bullish breakout from this pattern would mathematically target significantly higher levels in line with the move’s theoretical extension objective.
The H4 RSI is oscillating in a mid-range zone — the market is not yet in an overbought condition despite the recent rally. The Stochastic RSI confirms the bullish momentum remains active while signaling a possible brief cooling phase before the next breakout attempt. The « Buy Power » indicator confirms buyers maintain statistical control over price action.
🔬 15-Minute Chart (M15) Analysis: Intraday Microstructure
In the very short term, Bitcoin is displaying signs of volatility compression ahead of the US macroeconomic data release. Price is evolving within a narrow horizontal channel, repeatedly testing the key psychological pivot while awaiting a directional catalyst.
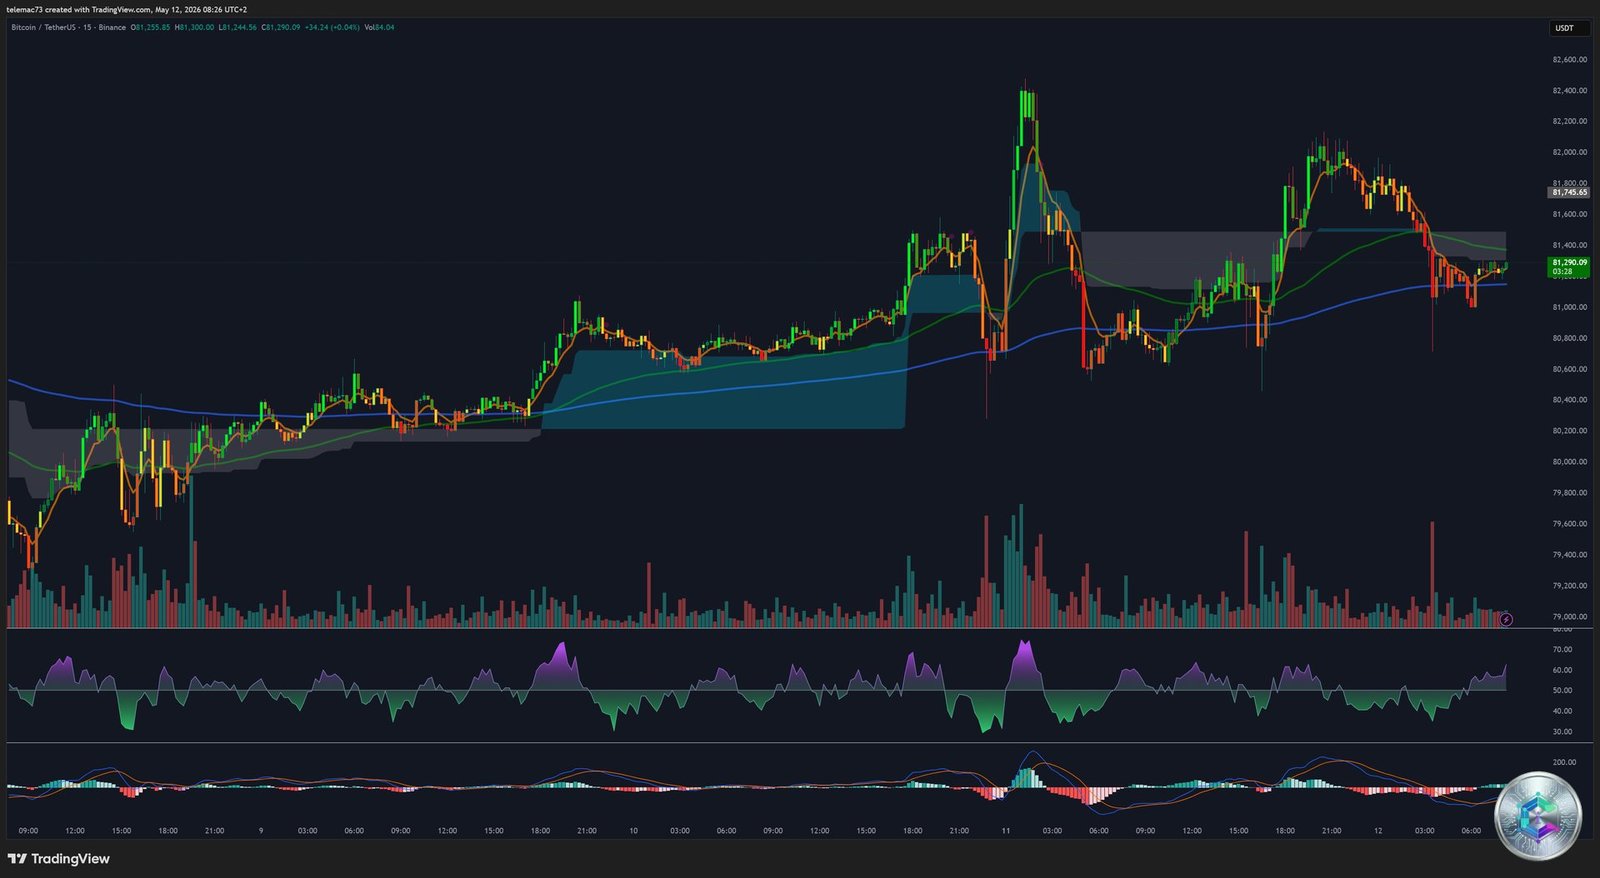
The 15-minute analysis reveals the determinant influence of CME Gaps (price gaps on the Chicago Mercantile Exchange). A gap identified in this zone is acting as a price magnet. The erratic movements observed during recent sessions are largely attributable to the market hunting liquidity to fill these zones before a major directional move. The M15 RSI recently reached oversold levels that were rapidly absorbed, demonstrating the solidity of the current floor.
🌡 Liquidity Heatmap: The Order Book Battle
The liquidity heatmap provides a crucial perspective on market maker intentions. A massive concentration of sell orders is visible just above the current price, forming a dense resistance wall that the market must absorb in order to advance.
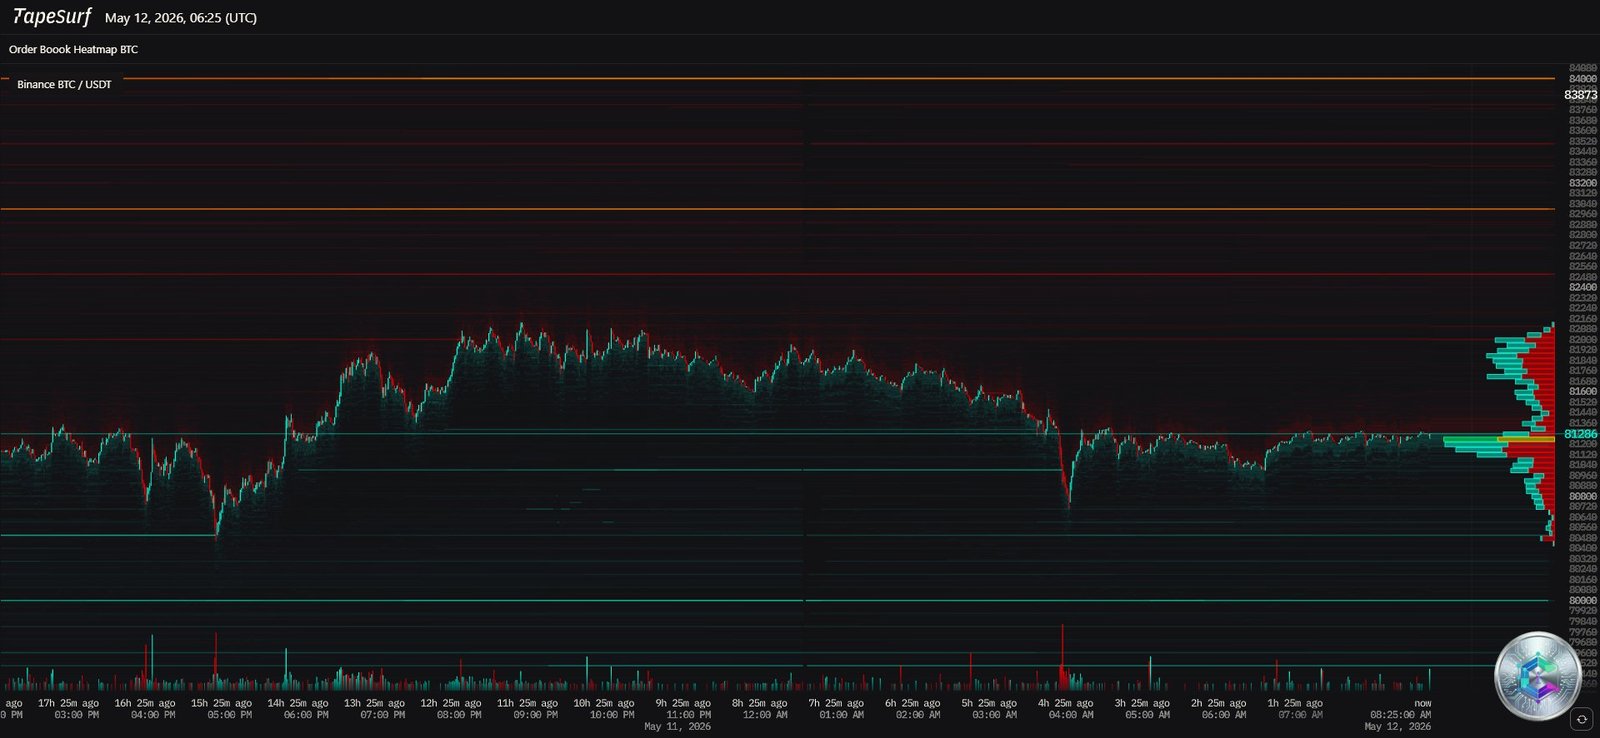
Bright horizontal lines (orange and red) indicate zones where sell orders are stacked — significant obstacles for any bullish breakout attempt. Conversely, liquidity support zones (green) form a safety net below the current price level.
The concept of a Short Squeeze is central to the current setup. After a significant purge of excess leverage over the past 24 hours, a decisive break above the major resistance would force remaining short sellers to cover their positions, creating a cascade of buy orders capable of propelling Bitcoin to higher levels in rapid fashion.
CVD (Cumulative Volume Delta) analysis reveals a significant divergence: while whales (large holders) have been quietly accumulating, retail participants appear to be taking profits. This absorption of supply by high-conviction entities reduces downside volatility and sets the stage for a sustained price expansion.
📐 Momentum Indicator Summary
| Technical Indicator | Current Reading | Market Signal |
|---|---|---|
| MACD (Daily) | Bullish Crossover | ✅ Buy |
| RSI (14-day) | Neutral-bullish zone | ✅ Neutral / Bullish |
| Stochastic RSI (4H) | Active momentum | ✅ Accumulation |
| ADX (Trend Strength) | Moderate trend strengthening | ⚠️ Emerging trend |
| Leverage Ratio | Stable post-purge | ✅ Moderate risk |
⚠️ Risk Analysis & Invalidation Factors
Despite a predominantly bullish technical structure, several factors could invalidate the breakout scenario:
- Macroeconomic Risk: A CPI report showing inflation above expectations would trigger an aggressive repricing of interest rates, driving a flight to dollar liquidity and downward pressure on BTC.
- Corporate Selling Pressure: Any policy shift from major institutional holders (MicroStrategy and equivalents) could break market confidence and test critical macro support levels.
- Whale Dormancy: The recent awakening of wallet addresses inactive since 2013, moving hundreds of millions in BTC, suggests some historical investors may be looking to secure gains as price approaches the major resistance zone.
🎯 Three Scenarios for the End of May 2026
🟢 Scenario 1 — Bullish Breakout (Probability: ~55%)
Bitcoin closes daily above the major resistance, fills the upper CME gap, and enters a price discovery phase toward new highs. This move is supported by positive net ETF inflows and geopolitical stabilization. Likely catalyst: favorable CPI data + sustained institutional inflows.
🟡 Scenario 2 — Lateral Consolidation (Probability: ~30%)
Price fails to break resistance but holds the intermediate psychological support. Bitcoin continues to fluctuate within the compression triangle, awaiting a clearer macroeconomic catalyst in June. Likely catalyst: ambiguous data releases, lack of directional volume.
🔴 Scenario 3 — Technical Correction (Probability: ~15%)
A macro surprise or massive whale sell-off pushes Bitcoin below key supports, triggering cascading liquidations toward the 100-day moving average. This level would then represent a strategic buying zone for high-conviction long-term investors. Likely catalyst: CPI beat to the upside or major geopolitical event.
📝 Conclusion
Rigorous analysis of charts and data flows demonstrates that Bitcoin is in a « coiled spring » phase. The breakout from the long-term descending channel is a first-class technical event that should not be underestimated. The market has shown exceptional maturity in absorbing geopolitical volatility and regulatory uncertainty.
The current major resistance represents the critical demarcation line. A daily close and acceptance above this level would confirm the start of a new parabolic leg. Conversely, while this resistance holds, a prudent approach favoring accumulation on dips toward identified support zones remains the strategy most consistent with the current market structure.
⚠️ Important Disclaimer: This article is written for educational and informational purposes only. It does not constitute investment advice, a recommendation to buy or sell, or an inducement to conduct financial market or crypto-asset operations. Cryptocurrency markets are highly volatile and carry significant risk of capital loss. Please consult a licensed financial advisor before making any investment decisions. CryptoInfo.ch assumes no responsibility for decisions made based on this article.

