
Executive Summary: A Market Under Systemic Pressure
As of June 3, 2026, Bitcoin (BTC) is navigating one of the most complex storms in its recent history. Trading in the range of $66,359 – $67,257, the flagship crypto asset is recording daily losses regularly exceeding 5%, with the Fear & Greed Index collapsing to a critical level of 11/100 — deep « Extreme Fear » territory. Total crypto market capitalization has contracted to a critical range of $2.37–$2.39 trillion, marking a period of acute stress for all market participants.
Far from being a simple technical retracement, this correction is the product of a rare confluence of exogenous and endogenous factors: persistent macroeconomic pressures, geopolitical tensions, record Bitcoin Spot ETF outflows, historic Mt. Gox blockchain transfers, and the shattering of MicroStrategy’s institutional dogma. Despite a decline of more than 45% from its October 2025 ATH (~$126,200), Bitcoin is consolidating its sector dominance at approximately 55.93–56.01%, illustrating a classic Flight to Quality phenomenon.
1. Macro & Geopolitics: The Perfect Storm
Geopolitical Escalation and Global Risk-Off
Risk asset pricing in early June 2026 is heavily dominated by a sharp deterioration in the global geopolitical landscape, particularly centered on the escalation of US–Iran tensions. In this paradigm, Bitcoin is behaving as a high-beta asset — tightly correlated with the Nasdaq 100 — rather than the decoupled digital gold that some narratives portray it as. Fears of a regional flare-up in the Middle East, with potential inflationary oil shocks, have pushed institutional portfolios into aggressive de-risking mode.
Furthermore, the Federal Reserve’s « higher for longer » rate environment closes the door to fresh liquidity injections, depriving the market of its usual fuel. The opportunity cost of holding non-yield-bearing assets like Bitcoin against remunerated bonds remains a persistent structural headwind.
OFAC Sanctions: An Unprecedented Regulatory Shock
On June 2, 2026, the Office of Foreign Assets Control (OFAC) deployed an unprecedented wave of sanctions aggressively targeting major Iranian crypto exchanges: Nobitex (the country’s largest exchange), Wallex, Bitpin, and Ramzinex. These entities are accused of facilitating the systematic circumvention of international sanctions and financing the Iranian regime.
The impact is colossal: Iran’s crypto ecosystem, valued at over $7.78 trillion in 2025, finds itself brutally isolated from the global digital financial system. Western institutional managers, terrified by the risk of « tainted coins » in their portfolios, have conducted massive preventive liquidations, temporarily draining buy-side liquidity from spot markets.
2. Institutional Flows: The ETF Hemorrhage & On-Chain Shocks
The Bitcoin Spot ETF « Flow Shock »
US Bitcoin Spot ETFs — the institutional backbone that powered the rally through mid-May 2026 — are experiencing a capital retention crisis of extraordinary violence. Aggregated data reveals a record sequence of 11 consecutive days of net outflows, totaling over $3.4 billion evacuated from these regulated financial products. May alone recorded net withdrawals of $2.43 to $2.8 billion.
Mechanically, the impact on spot price is merciless: when ETF shares are sold on secondary markets, Authorized Participants are forced to redeem shares and liquidate underlying Bitcoin on exchanges to maintain NAV parity, creating continuous algorithmic selling pressure that absorbs every attempted rebound.
The Mt. Gox Shadow & The End of the « Never-Sell » Dogma
Two major exogenous supply shocks hit the market near-simultaneously:
- Mt. Gox transferred a colossal 10,422 BTC (~$739 million) to unidentified wallets on June 2, in logistical preparation for creditor repayments (deadline: October 2026). The estate still holds ~34,500 BTC (~$2.4 billion), creating a permanent psychological overhang. This single preparatory move was enough to crash the price below $69,000 and trigger $744 million in leveraged liquidations within 24 hours.
- Strategy (formerly MicroStrategy) confirmed its first-ever Bitcoin sale in years: 32 BTC sold in late May for ~$2.5 million. While the amount is negligible compared to its holdings, the breach of the « never-sell » paradigm is symbolically devastating, signaling that even the most conviction-driven corporate hodlers are adjusting balance sheets in the face of restrictive credit conditions.
The Hashrate Divergence: Fundamental Network Strength
Amid this storm, a paradoxical divergence is emerging: in June 2026, the Bitcoin network’s hashrate has reached stratospheric levels. According to industry experts, the network’s computational power now surpasses the world’s 100 fastest supercomputers combined by a staggering factor of 600,000x. This computational dominance guarantees mathematical invulnerability to 51% attacks.
Historically, such a pronounced decoupling between massive hashrate expansion and price depreciation has invariably defined the most lucrative asymmetric accumulation zones for patient capital.
3. Derivatives Structure: The Weight of Options
No analysis is complete without understanding the gravitational impact of the options market. Current data reveals a total Open Interest of 104,300 BTC in call options (~$9.12 billion notional value), with 84% now out-of-the-money (OTM) following the 23% correction — the majority of strikes being set above $91,000.
Market Makers, previously forced to buy spot BTC to hedge their exposure (short gamma), can now unwind those hedges, adding invisible structural downward pressure. Nevertheless, accumulation of year-end positions targeting strikes between $100,000 and $112,000 demonstrates that a cohort of sophisticated actors maintains a medium-term bullish bias.
4. Multi-Timeframe Technical Analysis
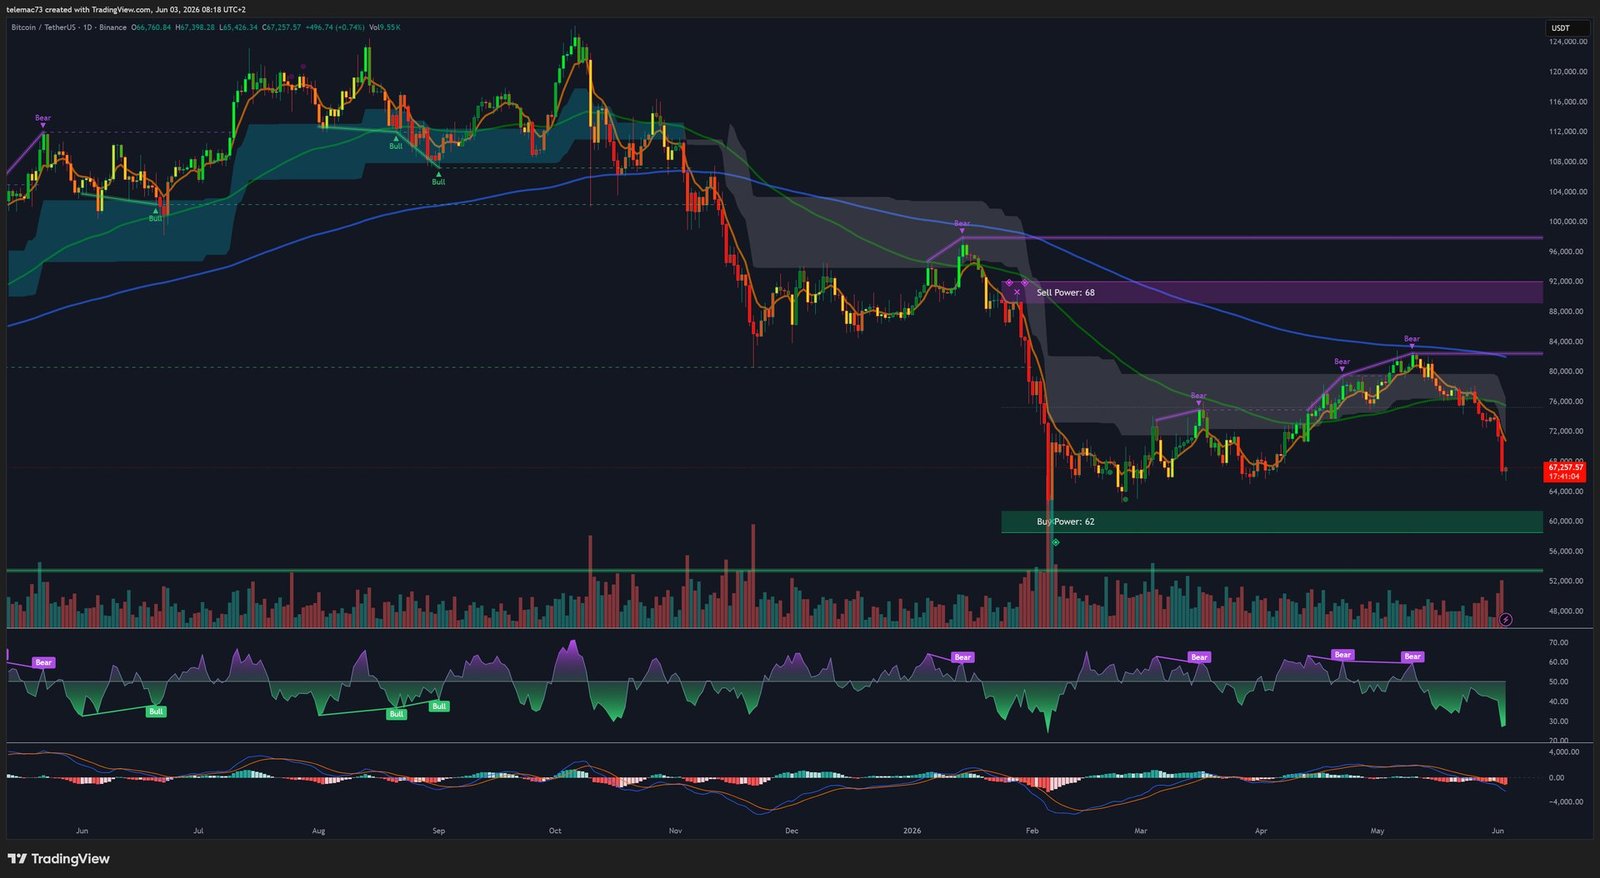
Daily Chart (1D): Structural Breakdown & Bear Dominance
The daily chart paints an unambiguous picture of a macro-structure in full decomposition. Bitcoin is locked in a relentless sequence of lower highs and lower lows. The $74,000–$74,800 zone acted as a textbook « bull trap, » catching billions of late long positions before a violent rejection to the downside.
Indicators confirm the distress:
- Death Cross printed on daily moving averages: the fast EMA has crossed below the long-term EMA at a steep angle, converting historical support lines into powerful dynamic resistance.
- Daily MACD: histogram dramatically widening in negative territory — selling kinetic energy is not yet exhausted.
- RSI: deep in severe oversold territory, with no clear bullish divergence visible at this macro stage.
- Ichimoku Cloud twisted to red (bearish twist): any rally into the cloud’s lower boundary will be treated as an algorithmic sell opportunity.
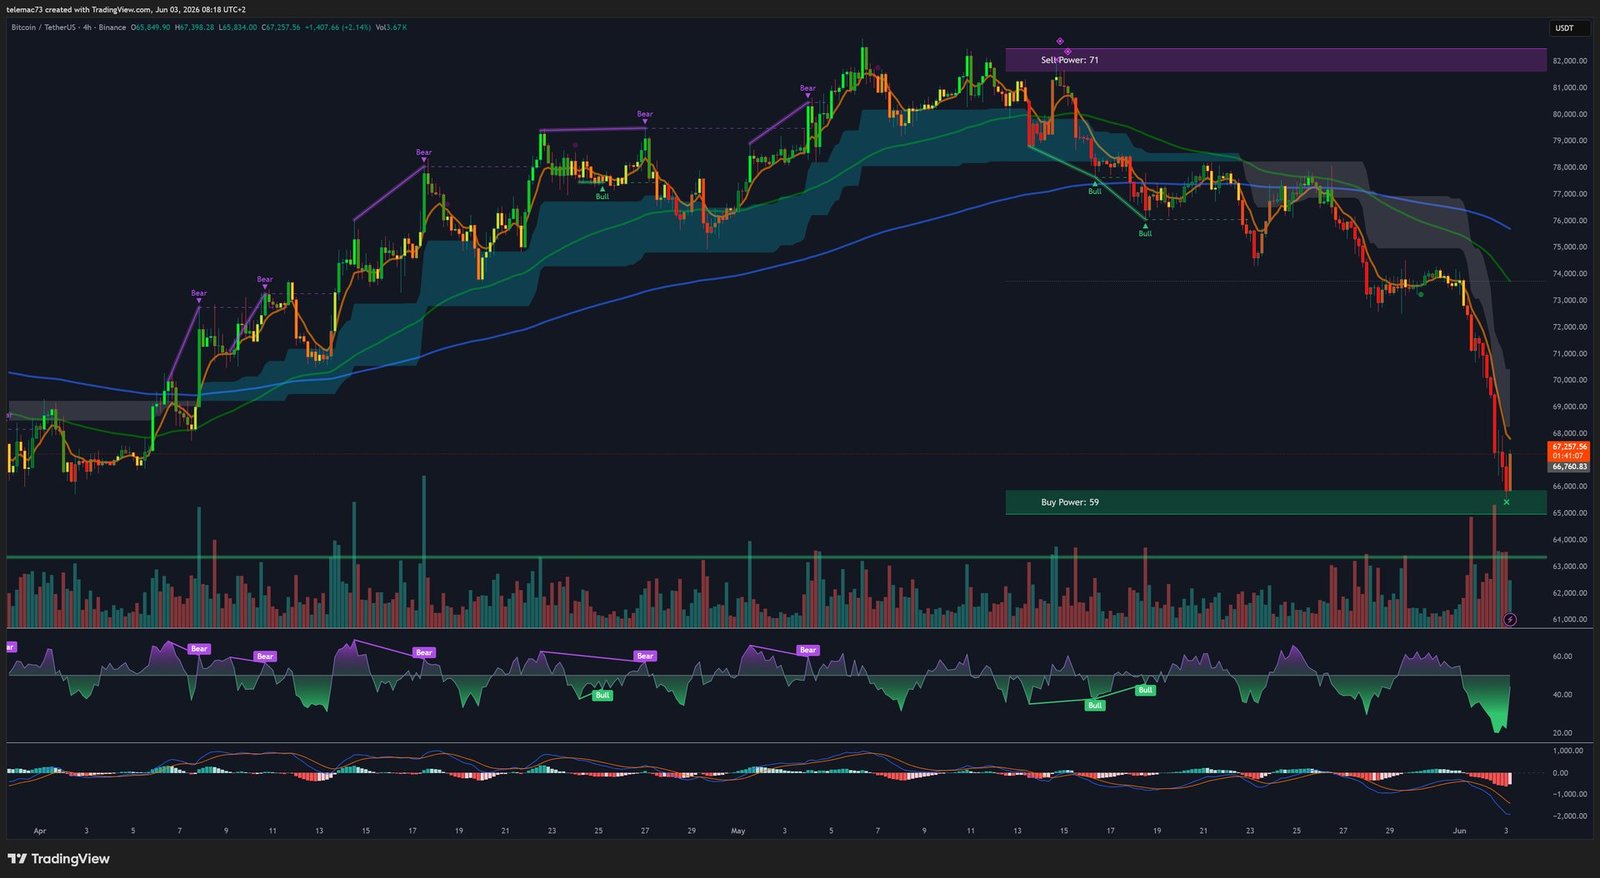
4-Hour Chart (4H): Compression & Early Stabilization Signals
On the 4H timeframe, the drop from $74,000 has been punctuated by multiple Bear Flags and descending compression triangles: after each bearish impulse, price consolidates with firm horizontal lows but increasingly crushed highs, before breaking down again. The recent triangle resolved violently to the downside.
However, crucial nuances emerge from the 4H oscillators:
- The 4H RSI is beginning to flatten its trajectory in extreme oversold territory.
- The 4H MACD histogram is showing deceleration: dark red bars are gradually giving way to shorter pink bars, suggesting a possible short-term golden cross.
These signals don’t indicate a macro reversal, but may foreshadow an emerging relief rally targeting the EMA 20 or the Ichimoku cloud base around $69,000.
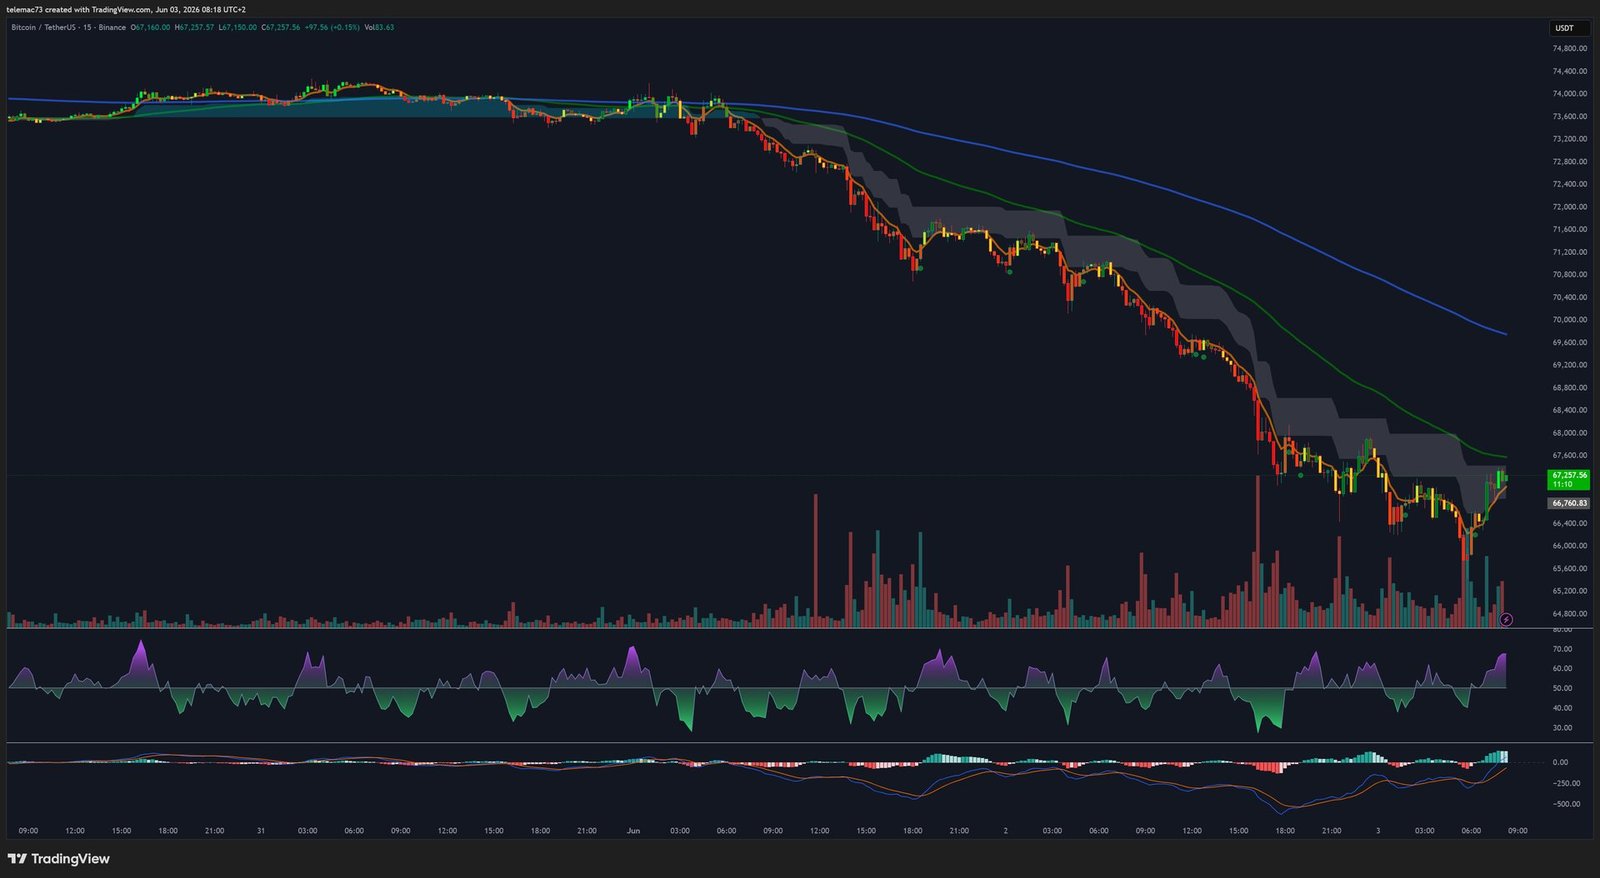
15-Minute Chart (15m): Market Microstructure & Scalping
The M15 highlights the algorithmic microstructure of the order book. Massive red volume bars coincide with liquidation cascades (margin calls) triggered at key support breaks. Each long wick to the downside (liquidity sweep) is algorithmically bought back, maintaining price within a very tight bear channel.
The 15m MACD oscillates around the zero line with minimal divergences: the market is awaiting a new fundamental catalyst. Retail traders are getting sliced by false signals in this high-frequency « chop » environment.
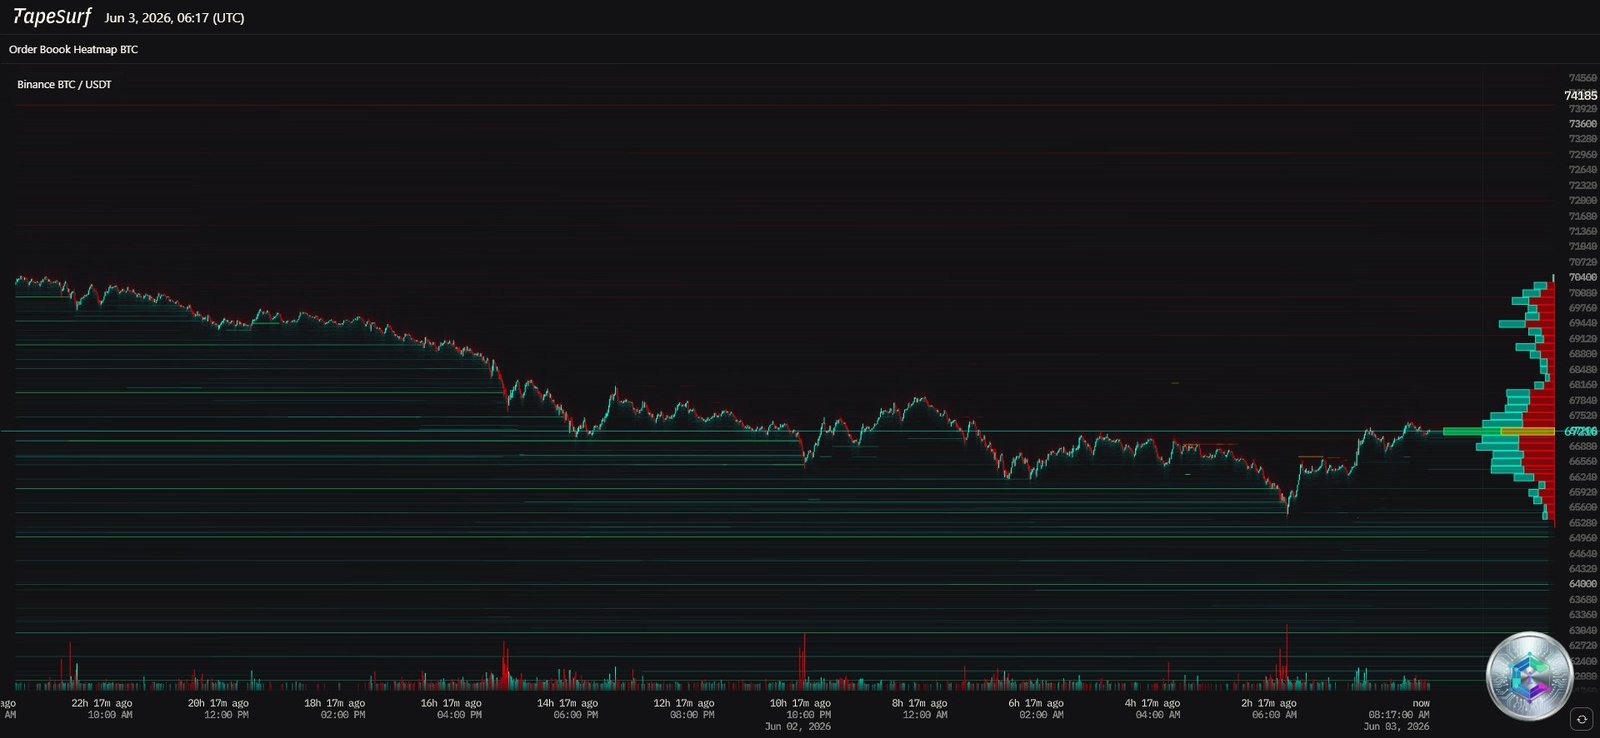
Liquidity Radiography: The TapeSurf Heatmap
The Binance BTC/USDT order book heatmap (June 3, 2026, 06:17 UTC) provides a true MRI scan of institutional intent. The map is dominated by crimson strata of sell orders:
- $67,200–$67,300: An opaque sell wall suffocating any intraday bullish attempt.
- $70,000: An even denser fortress defended by profit-taking algorithms — the former support metamorphosed into an impenetrable resistance.
Conversely, the bid side is remarkably sparse below current price. This liquidity void means that moderate market-sell orders would be sufficient to quickly slippage the price toward $64,000, and ultimately toward the ultimate support at $60,000.
5. Critical Technical Levels & Probabilistic Scenarios
| Level (USD) | Category | Role & Significance |
|---|---|---|
| $74,800 | Macro Resistance | Bull trap that initiated the decline. Long-term bullish trend demarcation line. |
| $70,000 | Major Resistance | Dense algorithmic sell wall. Former structural support broken by Mt. Gox transfer. |
| $68,200 | Local Pivot | Immediate dynamic resistance (EMA 20 / 4H). Crucial test to invalidate bearish momentum. |
| $67,257 | Current Spot Price | Precarious equilibrium post-liquidations. Walking the Bollinger lower band (4H). |
| $64,000 | Intermediate Support | Minor algorithmic speed bump. Low density in the liquidity heatmap. |
| $60,000 | Critical Support | The « Institutional Floor ». A breach would trigger systemic cascading liquidations. |
Scenario 1 — Structural Purge (Primary Probability)
Dominated by the inertia of ETF outflows ($3.4B) and the Damoclean sword of Mt. Gox’s 34,500 BTC, this scenario projects that any relief rally toward $68,200 or $70,000 will be smothered. Price should continue along the path of least resistance through the current liquidity void, heading toward a hard test of the $60,000 fortress zone — the ultimate stress test for institutional conviction.
Scenario 2 — Relief Short Squeeze (Secondary Probability)
With Fear & Greed at 11 and the daily RSI in critical oversold territory, the market is a coiled spring. A positive fundamental catalyst — a dovish Fed communication, or an unexpected pause in Mt. Gox liquidations — could trigger a short stop-hunt above $71,500, fueling a violent short squeeze.
Scenario 3 — Regulatory Contagion (Tail Risk)
Should OFAC extend its sanctions to other key jurisdictions, or if ETF hemorrhaging accelerates beyond the current 11-day record, panic selling could force a breach of the $60,000 macro support. In this case, a full capitulation would push valuations back toward pre-halving cycle lows.
Conclusion: Trench Warfare Between Fundamentals and Liquidity
Bitcoin’s ecosystem in June 2026 is the theater of trench warfare between absolute cryptographic solidity (record hashrate) and financialization dynamics that expose the asset to traditional macroeconomic hardships and geopolitical regulatory shocks. For professional asset managers, the current environment, while hostile in the short term, has historically offered exceptional risk premiums. Prudence demands strict position sizing and rigorous use of stop-losses, while closely monitoring ETF outflow exhaustion as the primary leading indicator of a trend revival.
⚠️ Disclaimer: This article is written for exclusively educational and informational purposes. It does not constitute investment advice, nor a recommendation to buy or sell any digital assets. Cryptocurrency markets are extremely volatile and carry the risk of total capital loss. Please consult a licensed financial advisor before making any investment decisions.