
The analysis of the Bitcoin ecosystem on February 19, 2026 reveals an asset in full transformation, precariously stabilized after an intense correction phase that began in the fourth quarter of 2025. Bitcoin no longer functions as a simple isolated speculative instrument — it has established itself as a macroeconomic asset whose valuation is intrinsically linked to institutional liquidity flows and the monetary policies of major central banks. At the start of 2026, the market is digesting the consequences of a tightening of global financial conditions and heightened volatility driven by uncertainty surrounding the decisions of the US Federal Reserve.
Macroeconomic and Fundamental Context
The macroeconomic environment of February 2026 is dominated by a persistent tension between deflationary forces and the resilience of inflation in several key economies. The Federal Open Market Committee (FOMC) minutes published on February 18, 2026 acted as a catalyst for caution, revealing a deep division among policymakers regarding the future trajectory of interest rates. While some members advocate for a pause, others openly raise the possibility of further hikes if inflation remains anchored above the 2% target.
Inflation Dynamics and Monetary Policy
Annual US inflation came in at 2.4%, showing a slowdown from the expected 2.5%, but the PCE (Personal Consumption Expenditures) index remains at 2.8%, nearly a full point above target. This divergence keeps the Fed’s neutral policy rate in a range of 3.50% to 3.75%. For Bitcoin, this policy means the opportunity cost of holding non-productive assets remains high, limiting retail capital inflows that prefer assets perceived as safer in a « risk-off » environment.
| Indicator | Value | Impact |
|---|---|---|
| Federal Funds Rate | 3.50% – 3.75% | Pressure on risk assets |
| US Inflation (CPI) | 2.4% | Moderate slowdown |
| PCE Inflation | 2.8% | Persistent resistance |
| US Unemployment Rate | 4.3% | Reduces urgency of rate cuts |
| US GDP Growth | +4.4% | Strengthens the Fed’s position |
| Fear and Greed Index | 12 / 100 | Extreme fear dominating sentiment |
| Open Interest (Futures) | $21.8B | Down from $30B in January |
The resilience of the US economy, with GDP growth of 4.4% in Q3 2025, paradoxically strengthens the Fed’s position by giving it room to maintain high rates without risking an immediate recession. This creates a structural ceiling for Bitcoin, which has historically benefited from a low-rate, liquidity-abundant environment.
International Flows and Regulatory Landscape
The geopolitical and regulatory landscape of 2026 adds a layer of complexity. Russia has announced its intention to block foreign cryptocurrency exchanges by summer 2026, a move that threatens to fragment global liquidity and reduce cross-border transaction volumes. In Europe, MiCA’s transition to a strict enforcement phase increases compliance costs for platforms, potentially limiting access for retail investors.
However, positive signals are emerging elsewhere. UK inflation fell to 3.0%, hinting at a Bank of England rate cut as early as March — potentially a harbinger of broader global monetary easing. Meanwhile, the Trump administration announced a significant reduction in the trade deficit, which could stabilize market conditions over the longer term.
Multi-Timeframe Technical Analysis
Examining charts across different timeframes reveals a market structure in a phase of descending consolidation, where long-term supports are being tested while short-term resistances prove difficult to break.
Macro View: Daily Chart
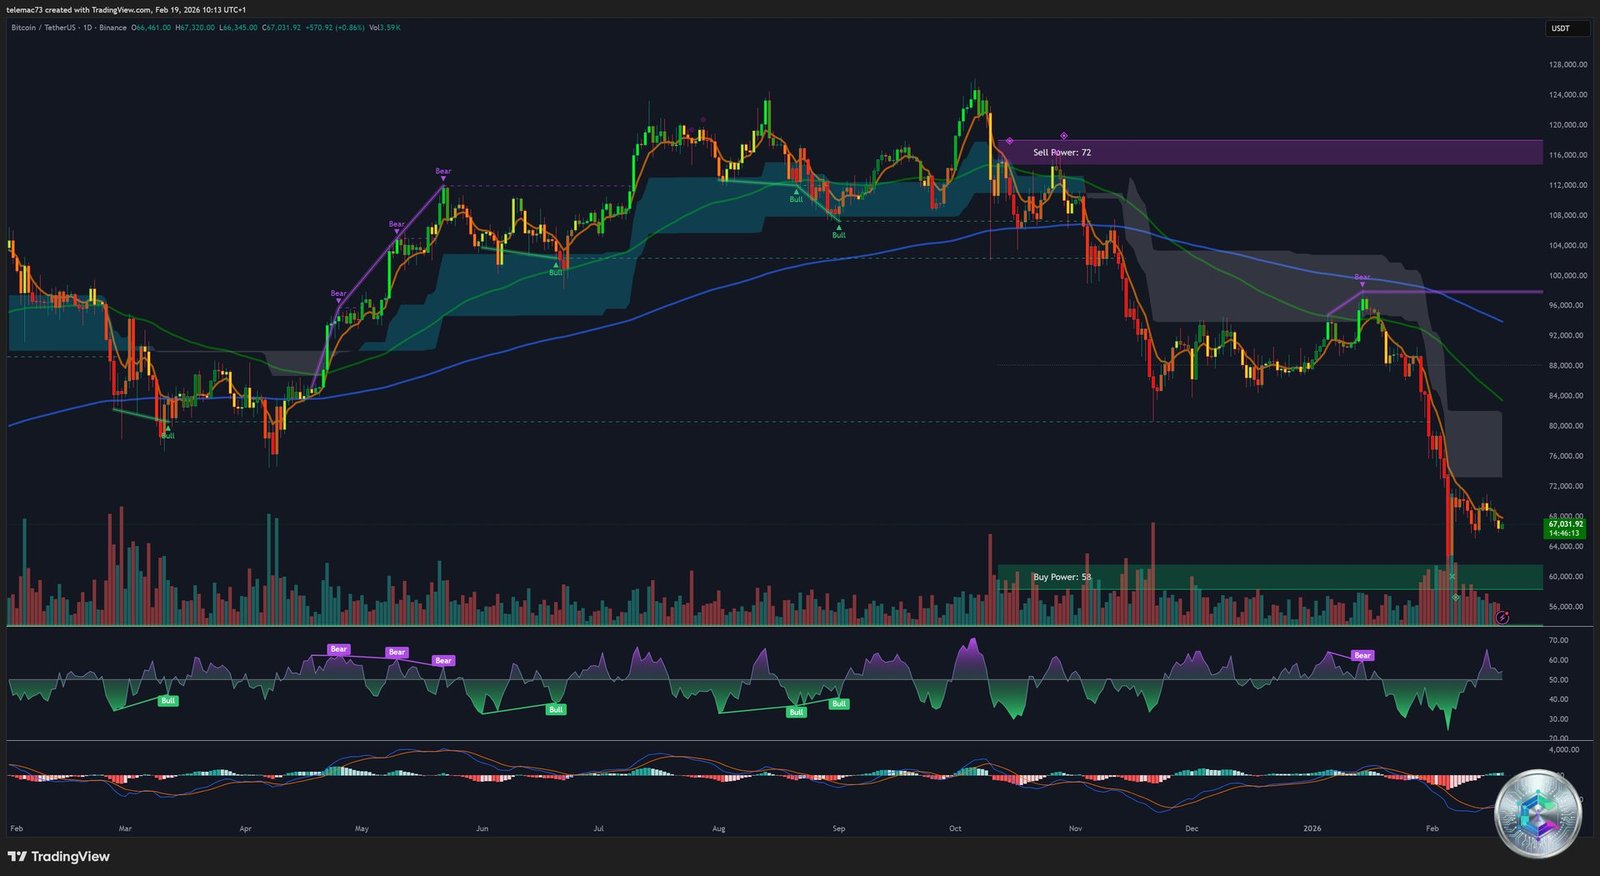
The daily chart shows Bitcoin engaged in a correction cycle since its all-time high in October 2025. The price is currently approximately 46% below its previous year’s closing record. This decline was marked by a brutal deterioration in technical structure at the start of February 2026, following higher-than-expected inflation data in key economies.
A proprietary indicator visible on the daily chart, « Sell Power: 72 » at the $115,000 level, indicates this zone acted as the peak of institutional distribution. Conversely, « Buy Power: 58 » manifested around $60,000, providing a crucial psychological and technical support where long-term buyers began defending their positions.
Intermediate View: 4-Hour Chart (4H)
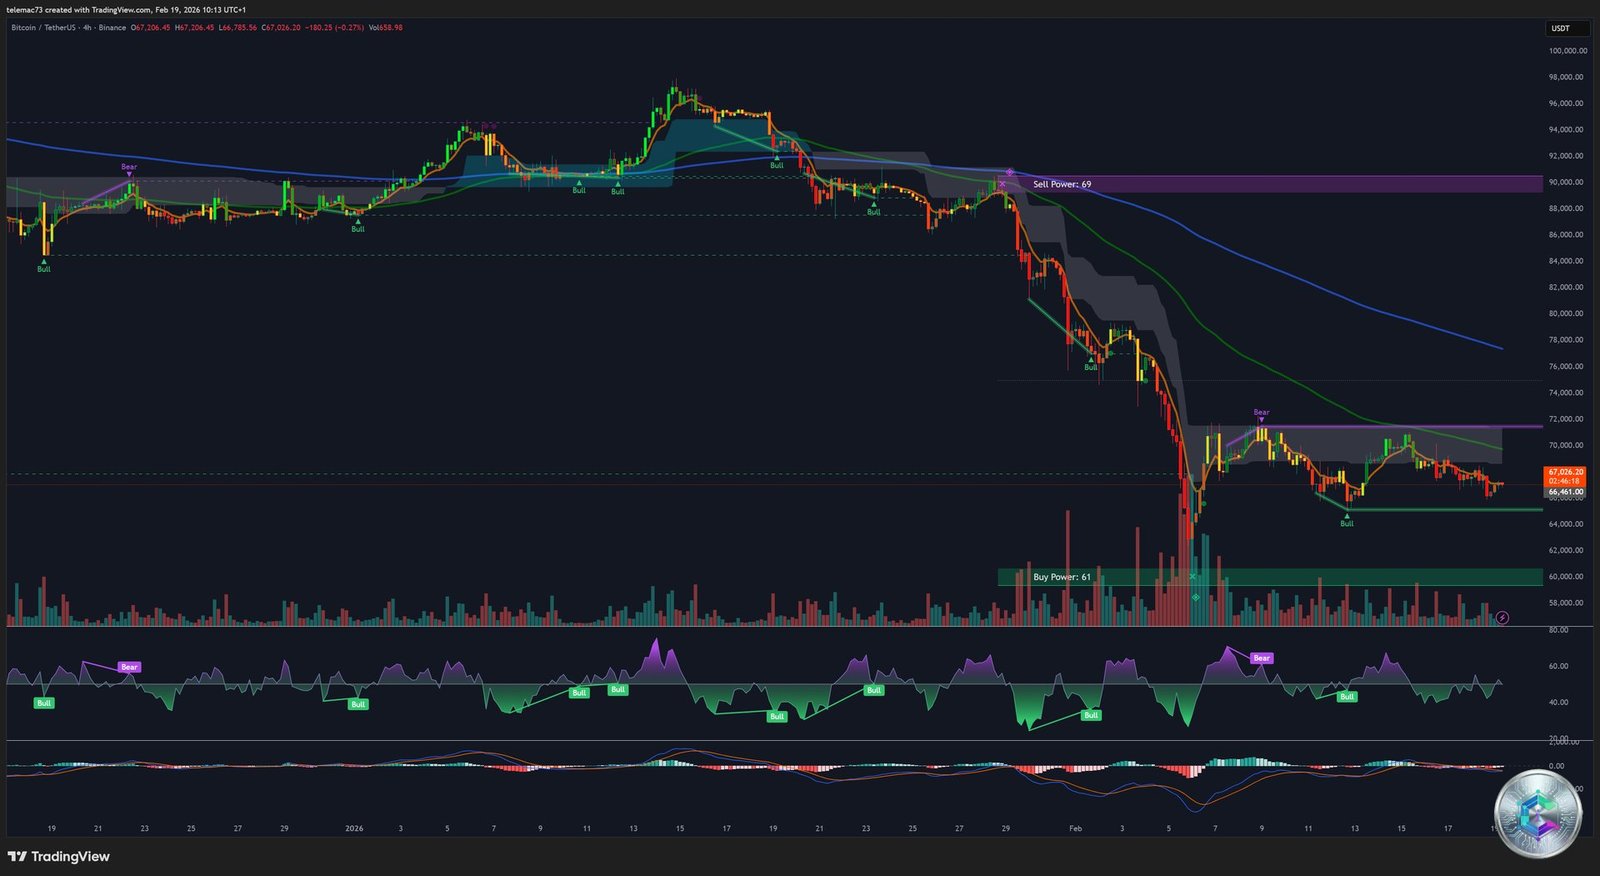
The 4-hour analysis zooms in on the current consolidation. After a sharp drop, price has stabilized between $65,100 and $72,000. A major resistance zone is identified by « Sell Power: 69 » at $90,000, representing a level of massive rejection during previous recovery attempts.
The long-term moving average acts as a dynamic ceiling, and Bitcoin remains unable to close durably above it. The momentum indicator shows signs of bullish divergence, suggesting a technical bounce may be building, although overall volume remains thin, reflecting investor indecision.
Micro View: 15-Minute Chart (15M)
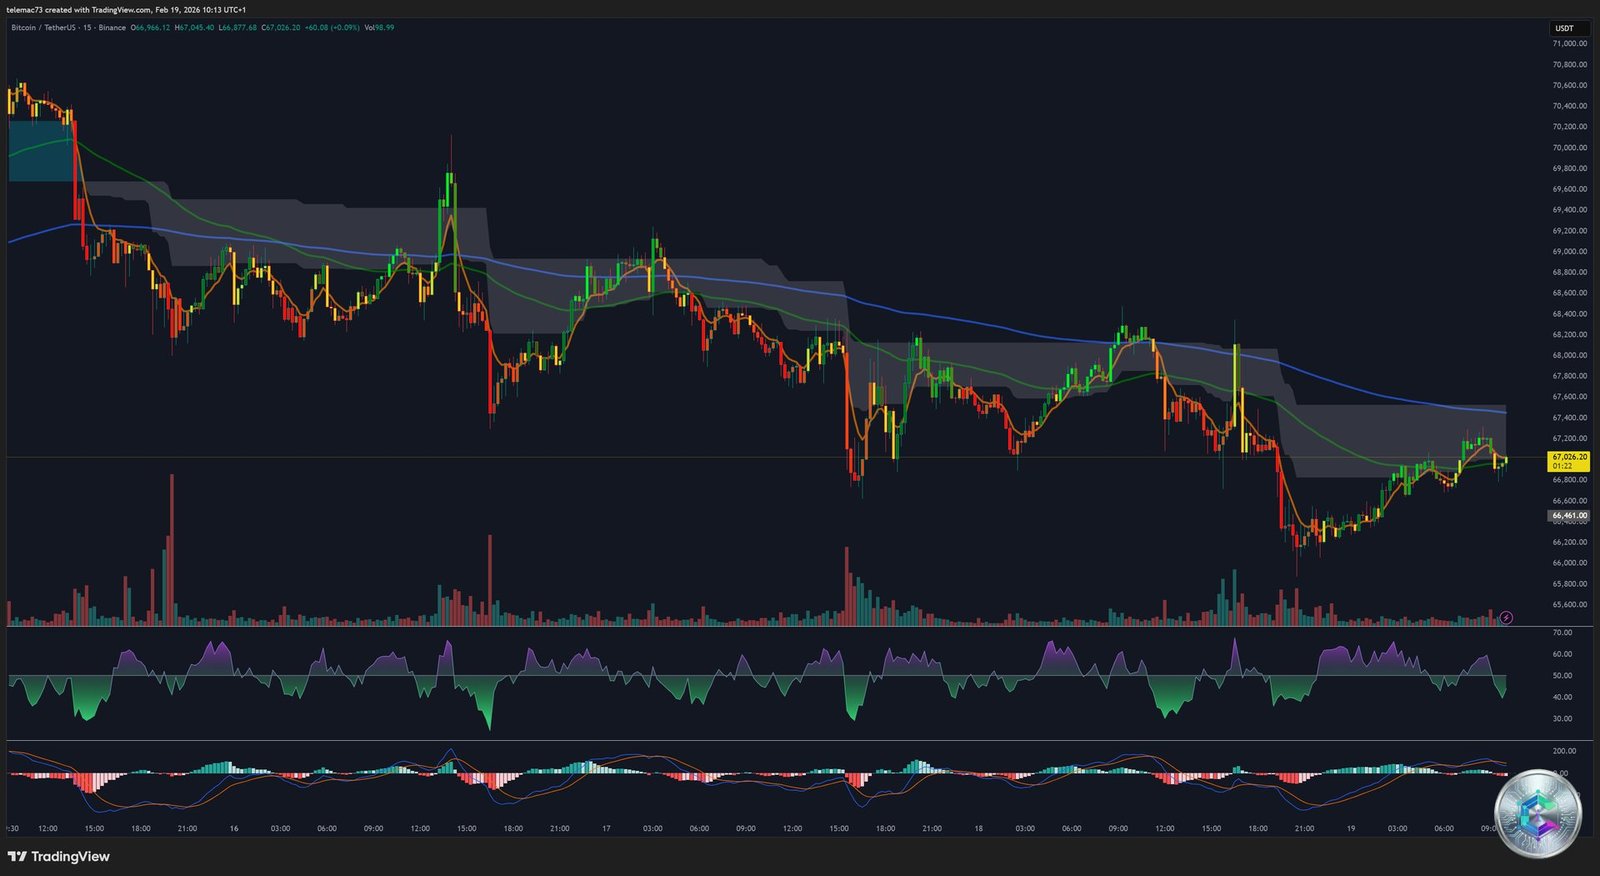
The 15-minute chart captures the immediate volatility linked to macroeconomic news. The FOMC minutes release on February 18 triggered a rapid 1.3% decline, pushing price toward $66,963. A « descending staircase » pattern is visible, where each bounce attempt is aggressively sold, often triggered by trading algorithms reacting to the Fed’s restrictive language.
Key Technical Levels: Supports and Resistances
| Level Type | Price (USD) | Characteristic |
|---|---|---|
| Peak Resistance | $115,000 | Sell Power: 72 – Major Distribution |
| Critical Resistance | $90,000 | Sell Power: 69 – Institutional Barrier |
| Key Resistance | $73,757 | March 2024 high / Neutral bias limit |
| Bounce Resistance | $71,800 | Post-February crash rejection point |
| Market Pivot | $67,000 – $68,000 | Current consolidation zone |
| Immediate Support | $65,650 | Bottom of the consolidation range |
| Annual Support | $60,132 | Lowest since October 2024 |
| Fibonacci Support | $57,800 | Long-term reloading zone |
| Psychological Support | $50,000 | Potential target in case of capitulation |
Microstructure and Order Flow: Heatmap Analysis
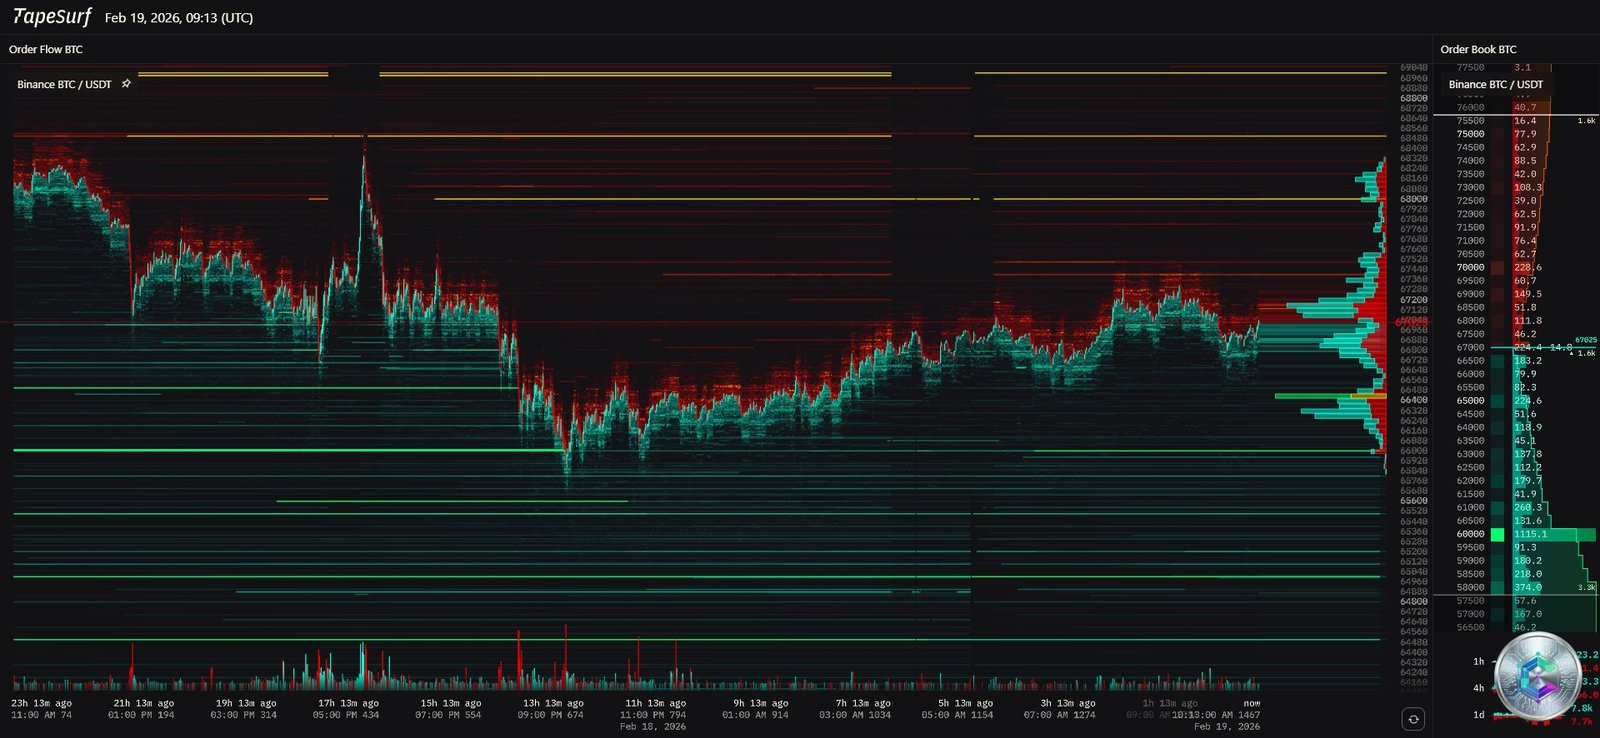
The order book and heatmap analysis provides crucial information on the positioning of large-volume players (Whales). The heat map shows a massive concentration of buy-side liquidity (in green/cyan) between $60,000 and $65,000. These « buy walls » suggest that institutions and sovereign funds are ready to absorb any additional selling pressure in this zone.
Conversely, a significant density of sell orders (in red/orange) spans from $72,000 to $75,000, indicating that the market faces considerable « liquidity resistance ». For price to break through these levels, a massive buying catalyst would be required — such as a surprise rate cut announcement or record ETF inflows.
Liquidation Dynamics and Leverage
In 2025, the market was purged of its excess leverage during the October 10 liquidation cascade, where more than $20 billion was wiped out. By February 2026, open interest has stabilized at healthier levels around $21.8 billion. This leverage reduction means the market is less susceptible to « flash crash » events triggered by forced liquidation cascades, but it also means upward moves are more organic and less driven by short squeezes.
Institutional Players and ETF Flows
Bitcoin in 2026 has become an asset driven by institutional flows. ETFs are now the dominant channel for price discovery. However, this institutionalization has introduced a new form of reflexivity: during periods of macroeconomic stress, portfolio managers mechanically reduce Bitcoin exposure to comply with their risk management models.
Whale Behavior
MicroStrategy (Strategy) purchased an additional 2,486 BTC in February 2026 for $168.4 million. While this brings their average cost basis to approximately $76,027, the company carries an unrealized loss of over $5.7 billion. Their persistence remains a strong market signal, though their cost basis at $76,027 acts as a psychological resistance for investors fearing a potential liquidation.
Abu Dhabi Sovereign Wealth Funds — Mubadala Investment Company and Al Warda Investments — have increased their stakes in BlackRock’s IBIT ETF, holding over 20 million shares valued at more than $1.1 billion at end-2025. Their continued accumulation signals that long-term institutional capital views Bitcoin as an essential component of reserve diversification.
The US Retirement Sector: The 401(k) and defined-contribution retirement plan ecosystem, worth $22 trillion, is beginning to open up to Bitcoin. An allocation of just 1% of this market would represent inflows of $90 to $130 billion, providing massive structural support for the years ahead.
Correlations and Market Sentiment
Bitcoin’s correlation with gold has fallen close to zero and has shown no signs of strong recovery. Similarly, its historically negative correlation with the US dollar index (DXY) has eroded toward neutral. This suggests Bitcoin is now perceived as a « tech risk asset » rather than an alternative safe haven.
The most persistent correlation remains with the Nasdaq 100, maintained between +0.35 and +0.6 over the past year. However, a recent disconnect is notable: while the S&P 500 and Nasdaq attempted to stabilize near their highs, Bitcoin failed to follow, reflecting specific mistrust of digital assets in the wake of the February crash.
Market sentiment is currently at its lowest point in months. The Fear and Greed Index stands at 12, indicating « extreme fear ». Historically, such levels often signal proximity to a market bottom, but in today’s macroeconomic environment they also reflect genuine concern about Bitcoin’s ability to maintain its value proposition against positive real interest rates.
Three Scenarios for 2026
🟡 Base Scenario: $100,000 – $110,000
The most likely scenario if ETF flows remain moderate, inflation continues its gradual decline, and the Fed begins cutting rates toward end-2026. Bitcoin would benefit from a « Goldilocks » environment of modest economic growth and controlled inflation.
🟢 Bull Case: $150,000 – $180,000
This scenario assumes a renewal of the global liquidity cycle, driven by de-escalation of geopolitical tensions and accelerated corporate treasury adoption. Bitcoin would be re-rated as an essential alternative reserve asset.
🔴 Bear Case: $50,000 – $60,000
In the event of a prolonged recession, aggressive monetary tightening, or a major failure of a crypto service provider, Bitcoin could retest its 2024 lows. A sustained break below $56,148 would open the door to $50,000, potentially retesting the August 2024 low of $49,217.
Conclusions and Strategic Watch Points
The comprehensive analysis of February 19, 2026 indicates that Bitcoin is navigating a complex maturity phase. The technical structure is currently bearish to neutral, with strong resistance in the $70,000–$76,000 zone and aggressively defended support at $60,000.
Three key signals to watch: a daily close above $73,757 to invalidate the bearish trend; FOMC minutes and PCE inflation as the primary macro catalysts; and net ETF flows, now the most reliable indicator of institutional demand. Sustained net outflows would signal institutional capitulation, while consistent inflows would support price despite adverse macro conditions.
Bitcoin in 2026 is no longer « early » — it is in a phase of deep integration into the global financial system. This integration brings long-term stability but reduces the explosive volatility that characterized previous cycles. The asset’s ability to hold the $65,000 support will be the true test of resilience for this new institution-dominated market structure.
⚠️ Disclaimer: This article is written for educational and informational purposes only. It does not constitute investment advice or a recommendation to buy or sell any digital asset. Cryptocurrencies are highly volatile and speculative assets. All investments carry risk, including the total loss of capital invested. Please consult a licensed financial advisor before making any investment decision.