
Bitcoin (BTC) is experiencing one of its most violent corrections since October 2024. From its late-May peak above $80,000, the leading cryptocurrency has shed nearly 20%, hitting a local low of $59,100 and erasing approximately $250 billion in global market capitalization. Over one billion dollars in leveraged positions were liquidated in the cascade. This report provides an exhaustive multi-timeframe dissection of this market structure: macroeconomic drivers, institutional dynamics, and a chartist breakdown across all relevant timeframes.
1. Anatomy of the Crash: A Convergence of Exogenous and Endogenous Shocks
Unlike typical cyclical corrections, the June 2026 breakdown is the result of four simultaneous pressure vectors converging on a market already dangerously overleveraged. Each force acted as an amplifier for the others, turning an ordinary pullback into a systemic unwind.
1.1. The Fed Holds the Line: Monetary Policy Headwinds
Non-Farm Payrolls data released in early June significantly beat forecasts, reigniting fears of persistent inflation. In response, probability models pricing a prolonged hold on interest rates by the Federal Reserve surged above 70%. Mechanically, a stronger dollar (DXY at a two-month high) and rising Treasury yields impose crushing gravity on BTC/USD, draining liquidity from crypto markets toward traditional monetary instruments offering competitive risk-free returns.
1.2. Geopolitical Shock: The Digital Gold Thesis Under Fire
Renewed tensions in the Middle East (US/Iran strikes breaking a previously expected ceasefire) triggered a flight-to-cash rather than a flight to digital assets. In an overleveraged environment, the immediate reaction to geopolitical shock is margin-call-driven liquidation — not orderly rotation into alternative stores of value. Physical gold itself fell approximately 1.5%, breaking below its 200-day EMA, confirming a global liquidity crisis rather than a structured safe-haven rotation.
1.3. Capital Rotation Into Artificial Intelligence
While Bitcoin was declining sharply, US equity indices and Japan’s Nikkei 225 were reaching new all-time highs. Available risk capital is aggressively reallocating toward the AI sector, the perceived dominant growth asset of the current macro cycle. This structural decoupling from traditional equity markets represents a critical warning signal for the broader crypto asset class.
1.4. Bitcoin ETF Hemorrhage and Token Unlocks
Spot Bitcoin ETFs recorded massive net outflows, with more than $3.7 billion evaporating over just a few sessions. Simultaneously, major token unlock events for projects including Sui, Aptos, and Arbitrum injected significant additional selling pressure across the digital asset market, compounding the bearish momentum.
2. Multi-Timeframe Technical Analysis
Daily Chart — Macro Structure
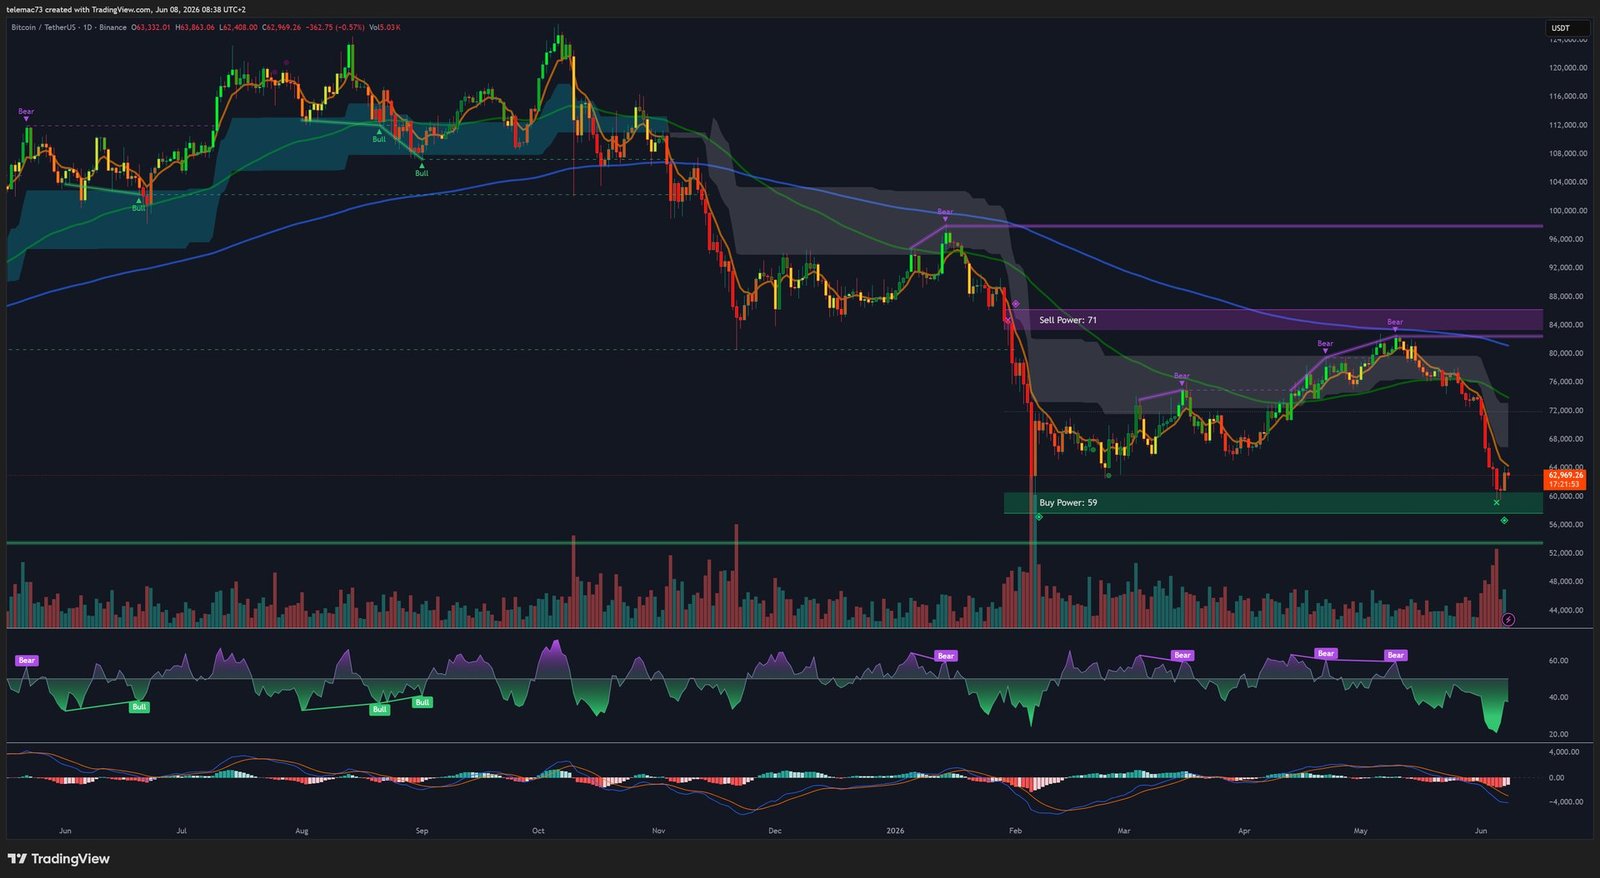
The decisive break below the 200-day Simple Moving Average (SMA 200) is the defining technical event of this correction. Price is now trading beneath the thick Ichimoku cloud (Kumo), a structural bearish signal. The daily RSI has collapsed toward secular lows while the MACD confirms a pronounced bearish crossover. Key levels to monitor:
- Critical resistance: $63,900 – $64,100 (massive wall of limit sell orders identified on heatmap)
- Current support: $59,100 – $60,000 (psychological floor)
- Bearish target: $53,000 liquidity void (capitulation scenario)
4-Hour Chart — Intermediate Structure
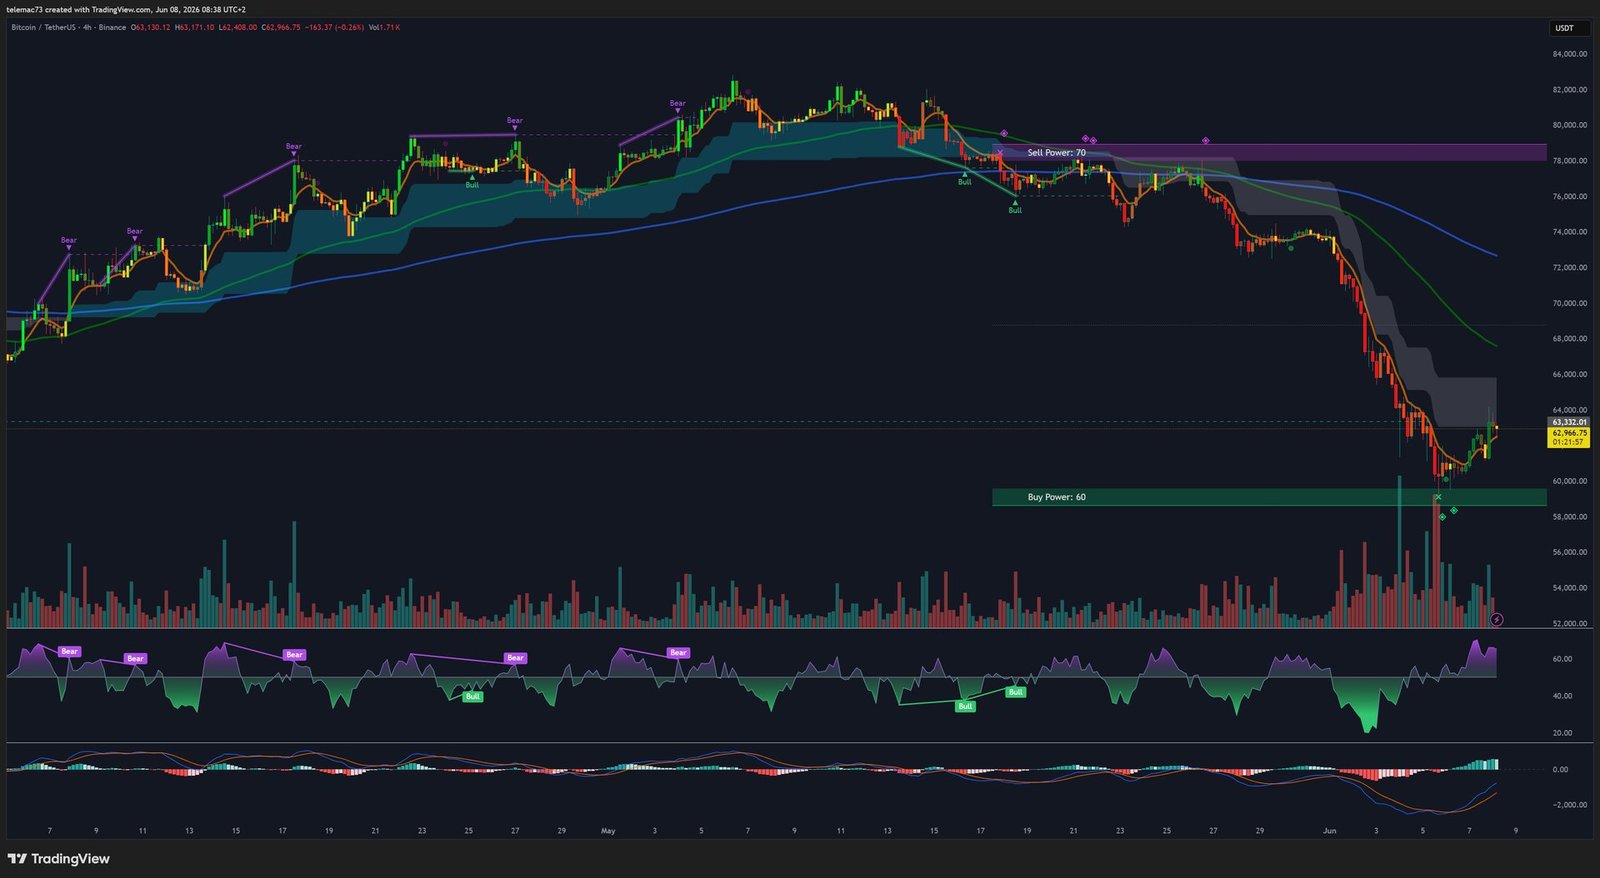
On the 4H timeframe, price is carving out a bearish flag structure within the post-crash descending channel. Intraday V-shaped bounces off $60,000 consistently lack the volume required to constitute a credible reversal. The 4H RSI oscillates in oversold territory without any meaningful bullish divergence. The $62,000 – $63,000 zone represents the first intermediate resistance to reclaim before any constructive consolidation can develop.
15-Minute Chart — Microstructure and Intraday Flow
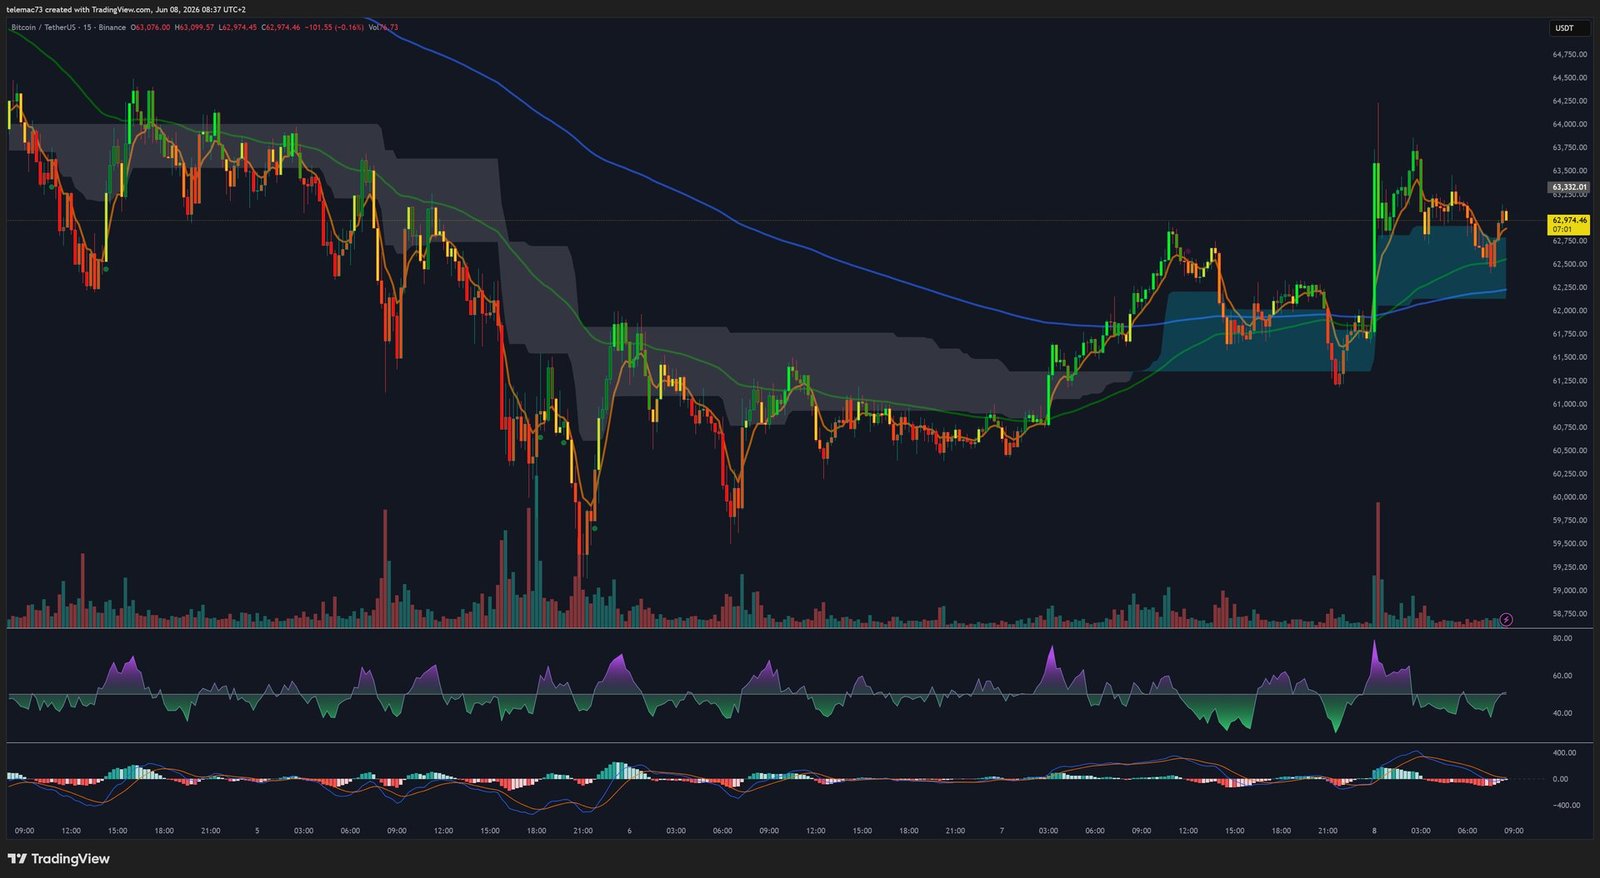
The 15-minute chart reveals a progressive volatility compression, forming a symmetrical triangle typical of indecision phases that precede a directional breakout. Order flow remains seller-dominated on every bounce attempt. Key absorption zones for intraday traders are clustered around $60,500 (demand) and $61,800 (supply).
Liquidity Heatmap — Order Book Depth
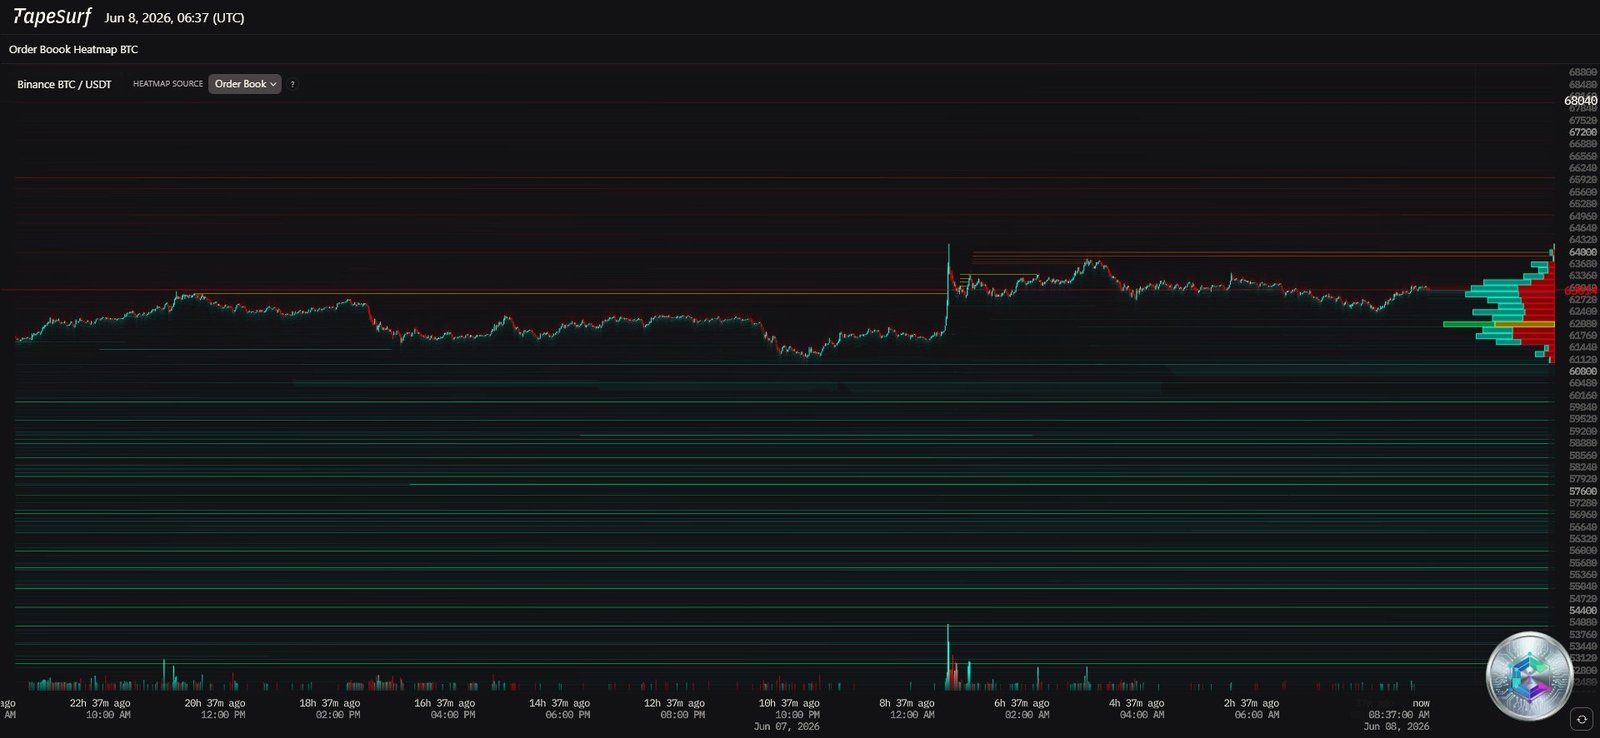
The order book heatmap corroborates the chartist analysis with striking precision: a dense wall of limit sell orders is parked in the $63,900 – $64,100 range, acting as a ceiling of lead on any recovery attempt. On the downside, significant buy-side liquidity clusters around $58,000 – $58,500, a zone capable of generating a technical bounce if reached.
3. Upcoming Catalysts to Watch
Several macroeconomic events could materially alter the market equation in the coming weeks:
- CPI (Consumer Price Index): Any upside surprise will strengthen the DXY and trigger reflex selling of risk assets including BTC.
- FOMC Meeting: Jerome Powell’s tone and the Summary of Economic Projections (dot plot) will set the trajectory for US interest rates.
- Bank of Japan (BOJ): Any adjustment to Yield Curve Control (YCC) will ripple through global carry trades and Asian liquidity conditions.
- ETF Flows: A return to positive net inflows on spot Bitcoin ETFs would be the first institutional signal of market stabilization.
4. Conclusion: A Market Seeking Capitulation
The exhaustive analysis of Bitcoin’s market structure in June 2026 establishes that the asset has violently transitioned from a parabolic expansion regime to a systemic contraction regime. The confluence of pressures — restrictive monetary policy, geopolitical destabilization, ETF outflows, token unlocks, and massive derivatives liquidations — paints a fundamentally bearish short-term picture.
The technical configuration strongly argues for a summer capitulation process: the risk of a breakdown below current support toward the $53,000 liquidity void represents the dominant probabilistic scenario. Bitcoin will not reclaim its structural uptrend toward $100,000 until global liquidity conditions ease and institutional sentiment rotates back toward the digital gold narrative.
⚠️ Disclaimer: This article is published for educational and informational purposes only. It does not constitute investment advice or a recommendation to buy or sell any financial asset. Cryptocurrency markets are highly volatile and carry significant risk of capital loss. Please consult a qualified financial advisor before making any investment decisions.