


As May 2026 draws to a close, Bitcoin (BTC) finds itself navigating a razor’s edge between prolonged consolidation and an imminent directional breakout. Anchored in a tight range between $75,000 and $77,000, the flagship digital asset is traversing a complex equilibration phase fueled by persistent macroeconomic headwinds, a tactical rotation in institutional capital flows, and a revealing volatility compression visible across medium-term charts. A complete breakdown of all forces at play.
🌍 Macroeconomic Context: Persistent Headwinds
The macroeconomic substrate conditioning risk appetite remains dominated by persistent U.S. inflation. The Consumer Price Index (CPI) is stuck at 3.8%, keeping the Federal Reserve in a resolute hawkish posture. The direct consequence: 10-year Treasury yields hold at 4.58% — a level that mechanically raises the opportunity cost of holding zero-yield assets like Bitcoin or gold.
Globally, central banks are diverging: the Reserve Bank of New Zealand holds rates at 2.25%, Australia shows encouraging disinflation signals, and Switzerland’s economic sentiment improves (ZEW survey). These dynamics indirectly influence USD-denominated pairs, with ripple effects on Bitcoin’s valuation.
Against this backdrop, the Crypto Fear & Greed Index reads at a critical 25 — firmly in « Extreme Fear » territory. Historical analysis of crypto market cycles consistently shows that such deep anxiety readings have preceded the most vigorous recovery phases. A similar dynamic played out between November 2025 and February 2026, when BTC bounced from $60,000 to new highs.
📊 ETF Flows and Institutional Rotation
Spot Bitcoin ETFs have become the backbone of the new institutional market structure. Yet late-May 2026 flow data reveals a significant tactical rotation following Q1’s euphoria.
After weeks of massive inflows regularly exceeding $1 billion per week, ETFs suffered six consecutive days of net outflows, draining $1.55 billion from institutional vehicles. The week of May 11–17 set a record with $1.26 billion in outflows — the worst reading since January 2026. BlackRock’s IBIT and Fidelity’s FBTC recorded $68.9M and $36.3M in single-day redemptions respectively.
| ETF Metric (May 2026) | Value |
|---|---|
| Net outflows over 6 consecutive days | -$1.55 billion |
| Record weekly outflow (May 11–17) | -$1.26 billion |
| IBIT (BlackRock) single-day outflow | -$68.9 million |
| FBTC (Fidelity) single-day outflow | -$36.3 million |
| Revised YTD 2026 net inflows | +$536 million |
| All-time cumulative Bitcoin ETF volume | > $65 billion |
Crucially, this is not an institutional capitulation. Analysts at The Block emphasize that the institutional bid hasn’t disappeared — it represents a sectoral rotation and portfolio rebalancing in response to persistent macro uncertainty. Historical cumulative flows stable above $65 billion provide a massive gravitational floor preventing symmetrical crashes of prior cycles.
🏛️ Corporate Treasuries, SpaceX IPO and Financial Innovation
Beyond ETFs, corporate balance sheet structuring around Bitcoin is accelerating. By late May 2026, 4.20 million BTC are permanently held by corporations, government entities, DeFi protocols, and ETFs — approximately 20.94% of total supply locked away from exchange order books.
The most seismic upcoming event is the imminent IPO of SpaceX (Nasdaq: SPCX), scheduled for June 12, 2026 at a $1.75 trillion valuation. SpaceX’s S-1 prospectus reveals a treasury holding of 18,712 BTC — approximately $1.29 billion in indirect Bitcoin exposure for future shareholders. On derivatives platforms (Hyperliquid, Binance, OKX), synthetic pre-IPO SPCX contracts already generated $33 million in volume on day one.
On the traditional markets side, the SEC granted Nasdaq approval to list Bitcoin index options — European-style contracts settled exclusively in cash, based on the CME CF Bitcoin Real Time Index updated every 200 milliseconds. A pivotal step in the full institutionalization of the asset class.
⚖️ Global Regulatory Landscape: Fragmentation and Clarification
Late May 2026 is characterized by significant regulatory fragmentation globally. In the U.S., the SEC published a formal guidance clarifying the application of federal securities laws to crypto assets, specifying reclassification conditions for airdrops, mining, staking, and wrapping.
In Europe, the European Commission launched consultations for MiCA 2.0, targeting non-EU CASP access and the weaknesses of the reverse solicitation exemption. In Minnesota, a landmark law now allows state banks to offer crypto custody services (effective August 2026). In Japan, foreign stablecoins may operate from June 1st under strict asset coverage requirements.
🔬 Market Microstructure and Liquidity Sweeps
Anticipating directional moves requires a surgical understanding of limit order book microstructure. Institutional market makers operate around two critical liquidity concentration zones:
- Buyside Liquidity (BSL): Positioned above major resistances and recent highs. It aggregates buy stop orders from short sellers as capital protection, plus breakout orders from trend-following algorithms.
- Sellside Liquidity (SSL): Lodged below critical supports and recent lows. It compiles stop-loss orders from long-term holders seeking to limit losses.
The liquidity sweep mechanism is mathematically devastating: an institution wishing to build a massive long position initiates artificial selling pressure to pierce a visible support level. This cascade of sell orders provides the institutional buyer with the exact counterparty needed for optimal execution. Once the level is « swept, » the imbalance reverses instantly and price makes a brutal move in the opposite direction — leaving retail traders trapped outside the position.
🌡️ Liquidation Heatmap Analysis
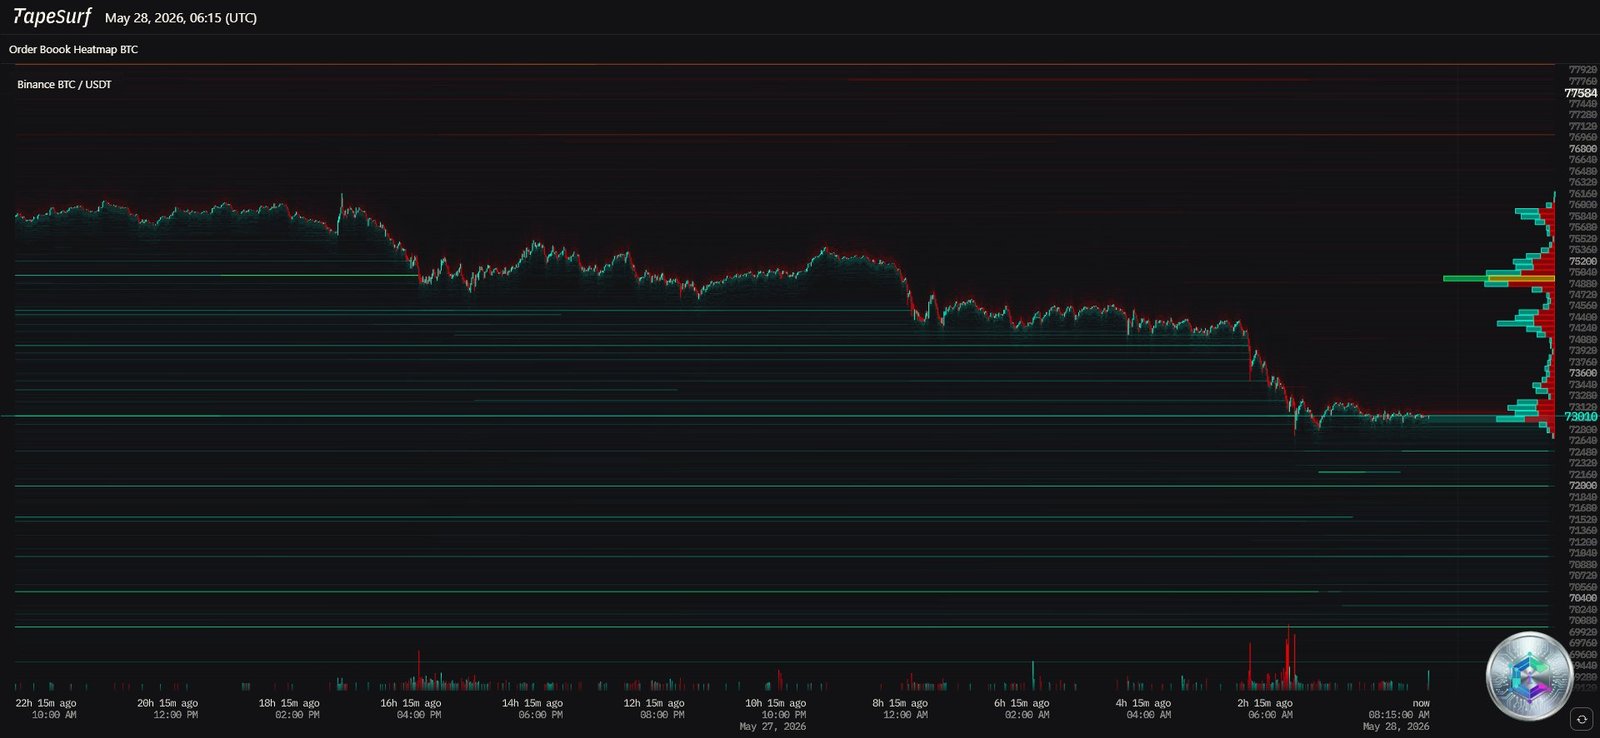
The Liquidation Heatmap (via CoinGlass, aggregating Binance, Bybit, OKX data) is the most advanced tool for mapping the fault lines of speculative leverage. Unlike a conventional order book (modifiable at will), the Heatmap reveals an unavoidable vulnerability: the exact price levels where overleveraged traders’ collateral will be wiped out, forcing an irrevocable market liquidation order.
Current analysis highlights two critical phenomena:
- Magnet Effect: Dense yellow clusters are identified between $78,000 and $80,000. These zones represent a potential graveyard for vulnerable short sellers and exert gravitational attraction on price.
- Liquidation Cascade below $73,000: A concentrated layer of overleveraged long positions sits below this support. A breach would trigger a self-sustaining domino effect toward $68,000–$70,000.
📈 Multi-Timeframe Technical Analysis
Daily Chart — The Macro Structure
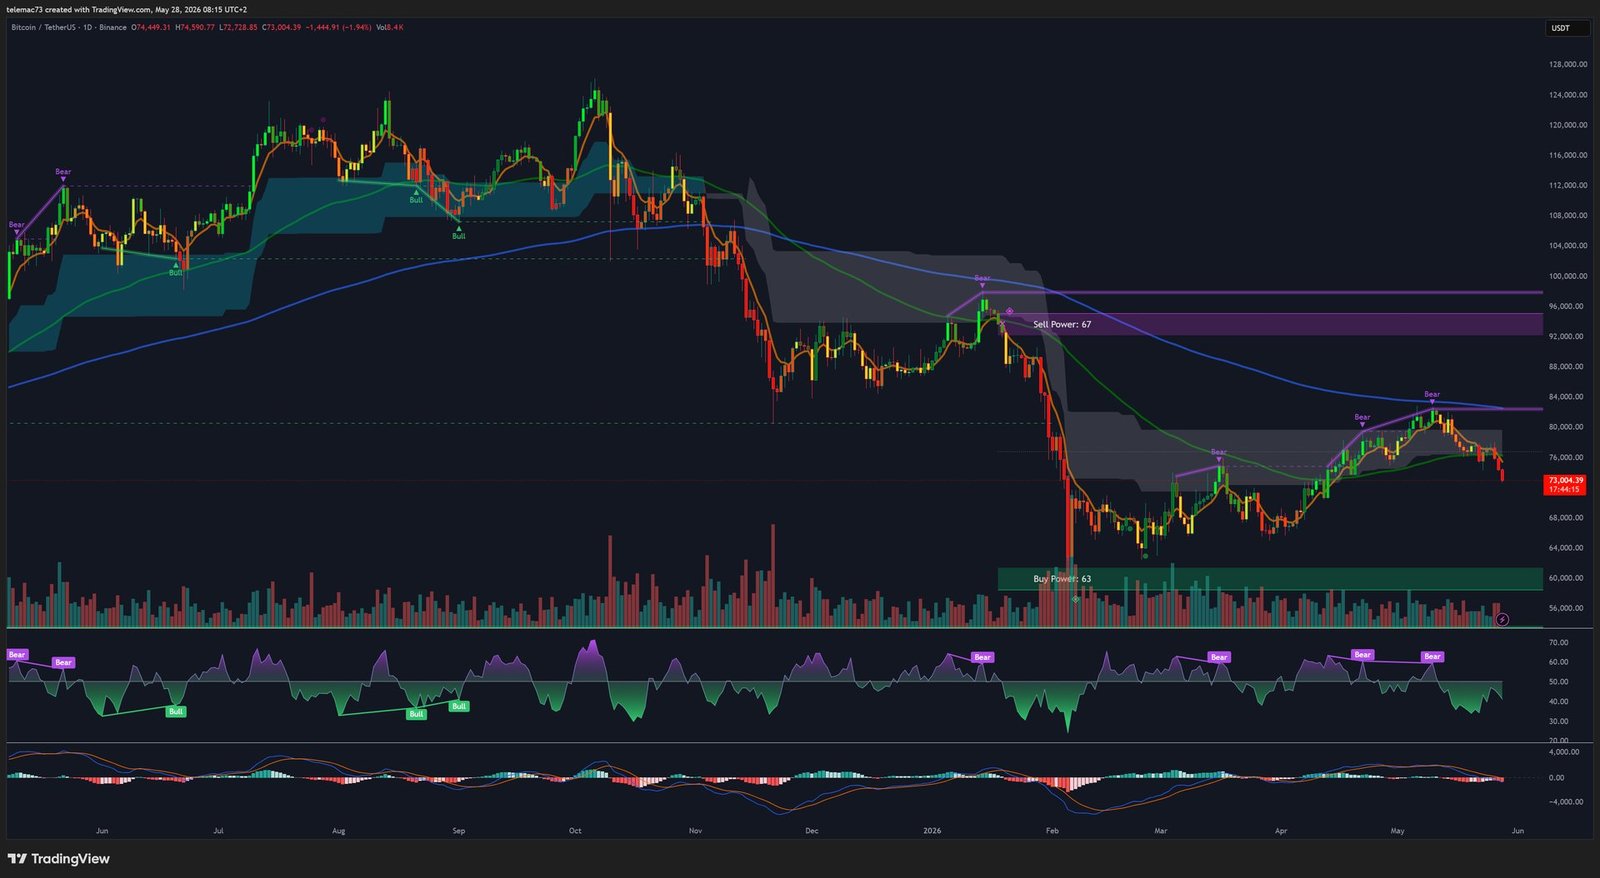
The daily chart defines the market’s macroscopic polarity. Price is evolving within a wide consolidation channel between $75,000 and $77,000 following a large-amplitude correction. This phase is not a trend deterioration signal but rather a healthy institutional re-accumulation, allowing the purging of excess leverage.
Key levels to monitor:
- Primary Support: $73,000–$75,000 — Historical absorption zone coinciding with major Fibonacci retracements.
- Psychological Support: $70,000 — Intermediate defense line.
- Ultimate Structural Support: $65,000 — A weekly close below this level would constitute a systemic trend reversal signal.
- Immediate Resistance: $78,000 — Current channel ceiling.
- 200-Day EMA at $81,500 — Converting this moving average into support is the absolute prerequisite to validate a new phase of irrational exuberance targeting six figures.
The daily RSI is painfully climbing out of oversold territory (<30), stabilizing in the median band — a « kinetic reloading » phase. Elliott Wave theory places this prolonged lateral movement within a corrective Wave 4 structure, preparing the launchpad for a Wave 5 impulse.
4-Hour Chart (H4) — Volatility Compression
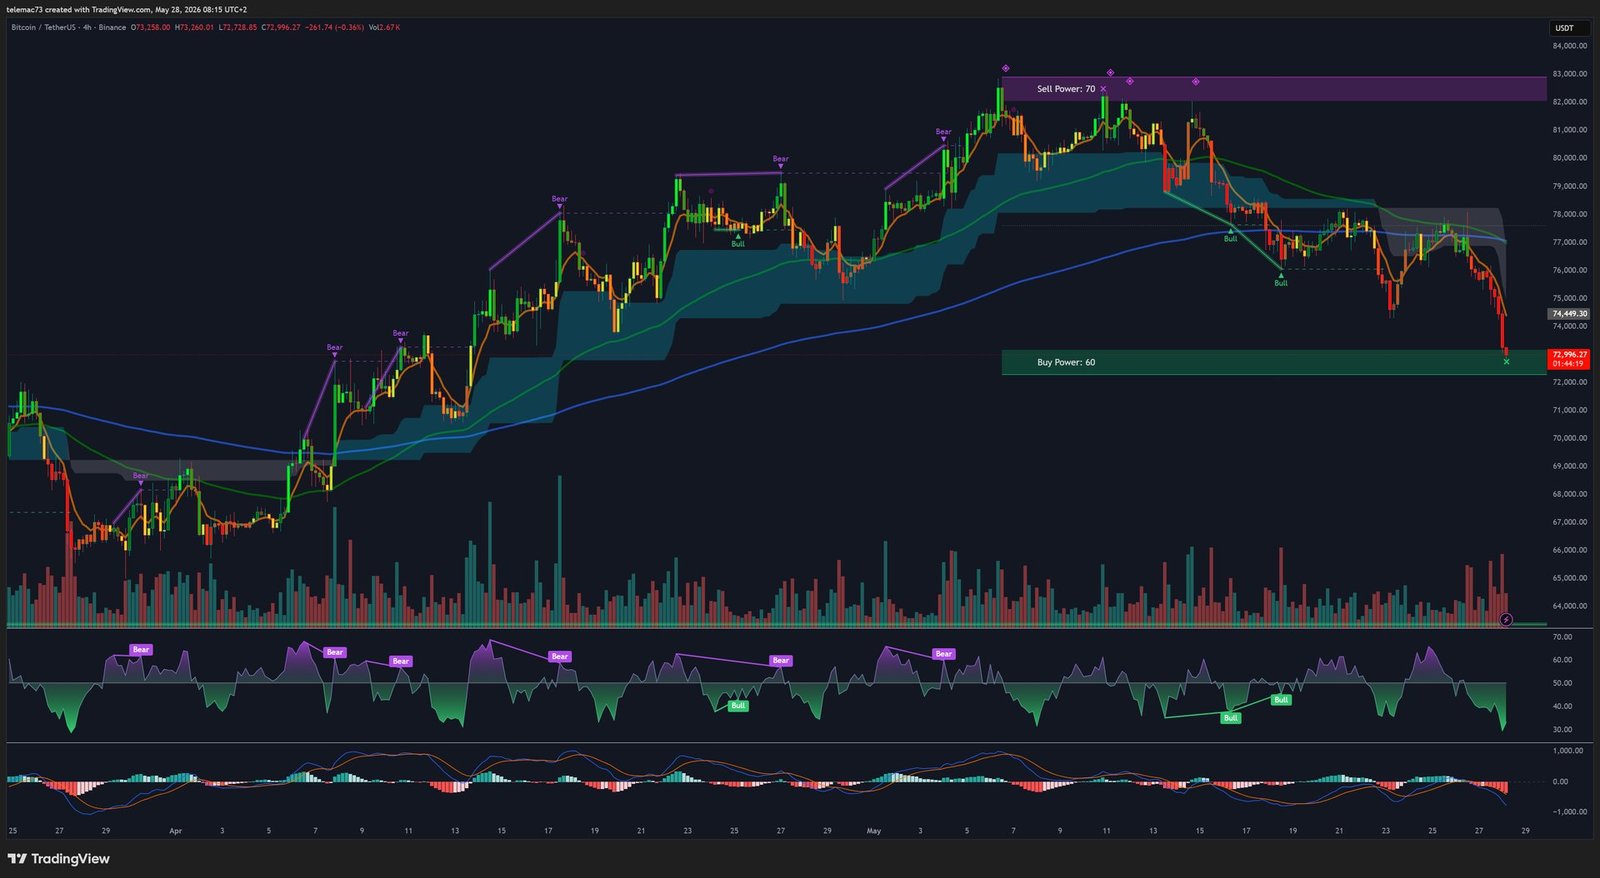
The H4 timeframe reveals the distinct morphology of a symmetrical compression triangle: a sequence of lower highs pressing against higher lows, coiling price into an apex of minimal residual volatility. Charting theory indicates that the resolution of such a structure is typically violent and explosive.
The 50-day and 100-day EMAs converge in a corridor between $76,800 and $76,900, forming a critical gravitational node. The H4 RSI hovers around 46–50 (neutral territory), with close monitoring of hidden divergences. The MACD is wrestling around the zero line: a Golden Cross confirming a bullish triangle breakout would trigger a magnetic pull toward $78,000–$80,000, while a Death Cross at these levels would signal buyer capitulation and precipitate an attack on supports.
15-Minute Chart (M15) — Execution and Market Noise
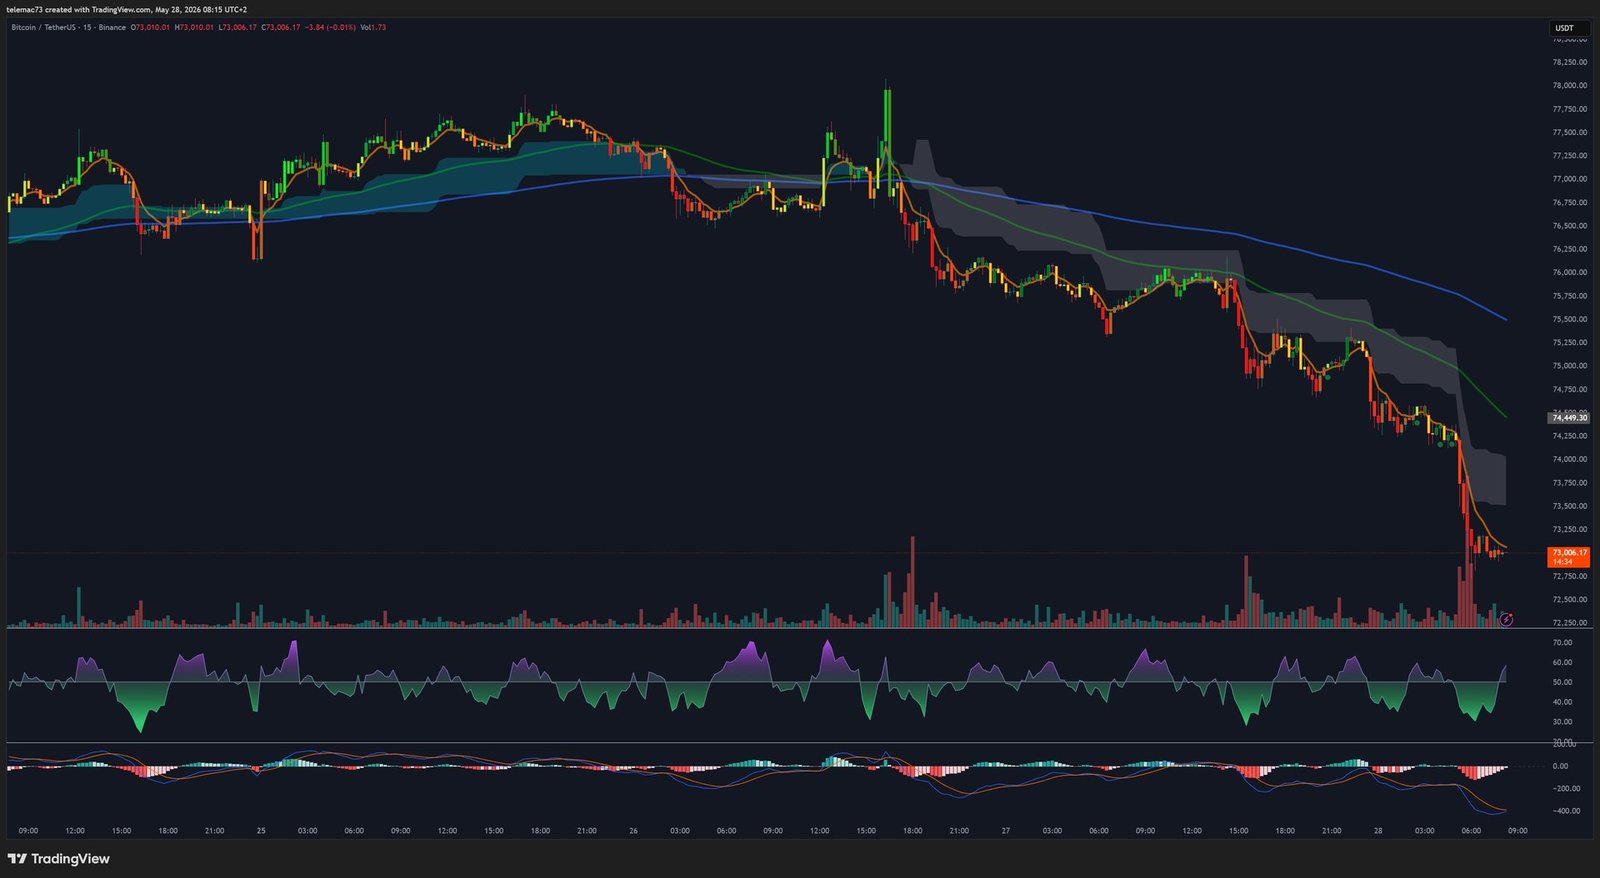
The M15 scale is the domain of intraday microstructure and liquidity manipulation. A rapid succession of EMA crossovers is observed: local Death Crosses during temporary mass sell-offs, almost instantly corrected by Golden Crosses as market-making algorithms buy the dips around the gravitational level of $75,250.
The M15 RSI swings violently between oversold extremes (<20) during SSL sweeps and overbought levels (>80) during BSL « fakeouts » designed to trap breakout traders. Precisely identifying these extremes, combined with Heatmap readings, is the key to filtering false signals before they manifest on higher-timeframe charts.
🤖 AI Models and On-Chain Fundamentals
Meta AI’s (Mark Zuckerberg) predictive model anticipates, from the $75,650 consolidation level, an organic breakout driven by spot buying (spot-led breakout). The dramatic decline in put option premiums signals that institutional « smart money » has silently repriced directional risk to the upside. The base case models a methodical grind toward $95,000, followed by a parabolic acceleration toward a summer 2026 terminal zone of $100,000–$105,000, conditional on clearing the 200-day EMA at $81,500. Should $75,000 fail, the model integrates a violent flush toward $68,000–$70,000.
| AI / Algo Model | Price Target | Timeframe | Validation Condition |
|---|---|---|---|
| Meta AI – Base Case | $95,000 → $100k–$105k | Summer 2026 | 200-day EMA flip to support ($81,500) |
| Meta AI – Bear Case | $68,000–$70,000 | Near-term | $75,000 primary support failure |
| Intellectia.ai / CoinDCX | ~$80,500 | Late May 2026 | Current consolidation channel preserved |
| Quantitative Consensus | $75,000–$118,000 | Full year 2026 | Structural institutional net flows |
On the on-chain front, the Bitcoin network demonstrates remarkable structural resilience: hashrate at 989 exahashes/second, market cap at $1.54 trillion (13th globally), 20.03 million BTC in circulation out of 21 million. Mining difficulty stands at 136.61 trillion for a precise block time of 9.93 minutes — infrastructure that guarantees technological solidity despite price turbulence.
🎯 Synthesis: Bull Case vs Bear Case
Bull Case: ETF flow stabilization and preservation of the $73,000–$75,000 gravitational shield form the foundations of the optimistic scenario. A bullish breakout from the H4 triangle apex, confirmed by a MACD Golden Cross, would trigger a massive liquidity sweep of shorts clustered above $78,000, with sufficient kinetic energy to clear the 200-day EMA at $81,500 and validate the six-figure trajectory.
Bear Case: A prolonged Fed high-rate policy exacerbating ETF outflows, combined with failure to hold the 50–100 EMA confluence ($76,800), would expose the market to a liquidation cascade. Breaching $73,000 would trigger a self-sustaining domino effect toward $68,000–$70,000, potentially accompanied by a miner capitulation as margins are already under extreme pressure.
⚠️ Disclaimer: This article is written exclusively for educational and informational purposes. It does not constitute investment advice, a recommendation to buy or sell digital assets, or an inducement to invest. Cryptocurrency markets are extremely volatile and carry the risk of capital loss. Please consult a licensed financial advisor before making any investment decision.

