


After flirting with $126,000 in October 2025, Bitcoin went through one of the harshest purges of its cycle, bottoming out at $57,700 in late June 2026 — a 21-month bear-market low. Since then, the asset has been fighting to build a solid base between $62,850 and $64,000, caught between explosive geopolitics, a bond market under severe stress, and on-chain signals that are, surprisingly, turning constructive again. Here is a full map of that battle, from the macro backdrop down to the technical levels that will decide what comes next.
A macroeconomic backdrop under heavy strain
The recent announcement of the end of the US-Iran ceasefire immediately reinjected a sizeable geopolitical risk premium across global markets. Renewed tension around the Strait of Hormuz has fueled fears of imported inflation via oil prices, pushing capital away from volatile assets such as Bitcoin, which briefly pulled back toward $61,500.
The bond market is adding further pressure: Japanese 10-year government bond yields have hit a 30-year high, dragging US and European yields along with them. Rising risk-free rates mechanically increase the cost of capital and weigh on the valuation of speculative assets. The Federal Reserve, for its part, remains firmly hawkish, with futures markets currently pricing a 70% probability that the FOMC holds rates unchanged at its July 28-29, 2026 meeting.
Yet US economic fundamentals are sending mixed signals. June’s Non-Farm Payrolls report came in strikingly weak, with only 57,000 jobs added versus 113,000 expected, alongside downward revisions to prior months. Traders read this slowdown as an early sign of coming monetary easing, triggering nearly $450 million in short covering across crypto markets within 24 hours.
On the regulatory front, the picture is brightening: the SEC is preparing a new framework dubbed « Regulation Crypto, » creating a safe harbor for early-stage crypto projects, while in Europe the ongoing rollout of MiCA continues to standardize the landscape and encourage institutional adoption.
Institutional flows: a fragile return of confidence
June 2026 will be remembered as a month of institutional capitulation: spot Bitcoin ETFs suffered their worst month since launch, with $4.5 billion in net outflows — the main driver behind the break below $60,000. But early July tells a different story: products like IBIT logged $266 million in net inflows in a single day, following $143 million the day before, signaling an asymmetric return of institutional appetite for what is increasingly seen as a discounted zone.
The Coinbase Premium Index, which tracks the price gap between Bitcoin on Coinbase and the global volume-weighted price, confirms the shift. After fifty straight days in negative territory, it has recovered to -0.062 — still negative, but with a clearly positive rate of change, pointing to a sharp slowdown in US seller aggression.
On-chain, Bitcoin demand is emerging from its sharpest contraction since the 2022 crypto winter, with spot selling pressure falling to its lowest level since mid-May. Bitcoin dominance is holding between 56.08% and 56.33%, confirming that capital remains concentrated in the most liquid asset rather than rotating into altcoins.
Order book and liquidations: the heatmap that gives the market away
A close look at order book microstructure reveals a market tightly boxed in by liquidity walls. The Point of Control — the highest-volume node of recent trading — sits almost precisely at $63,914, effectively acting as the market’s current center of gravity.
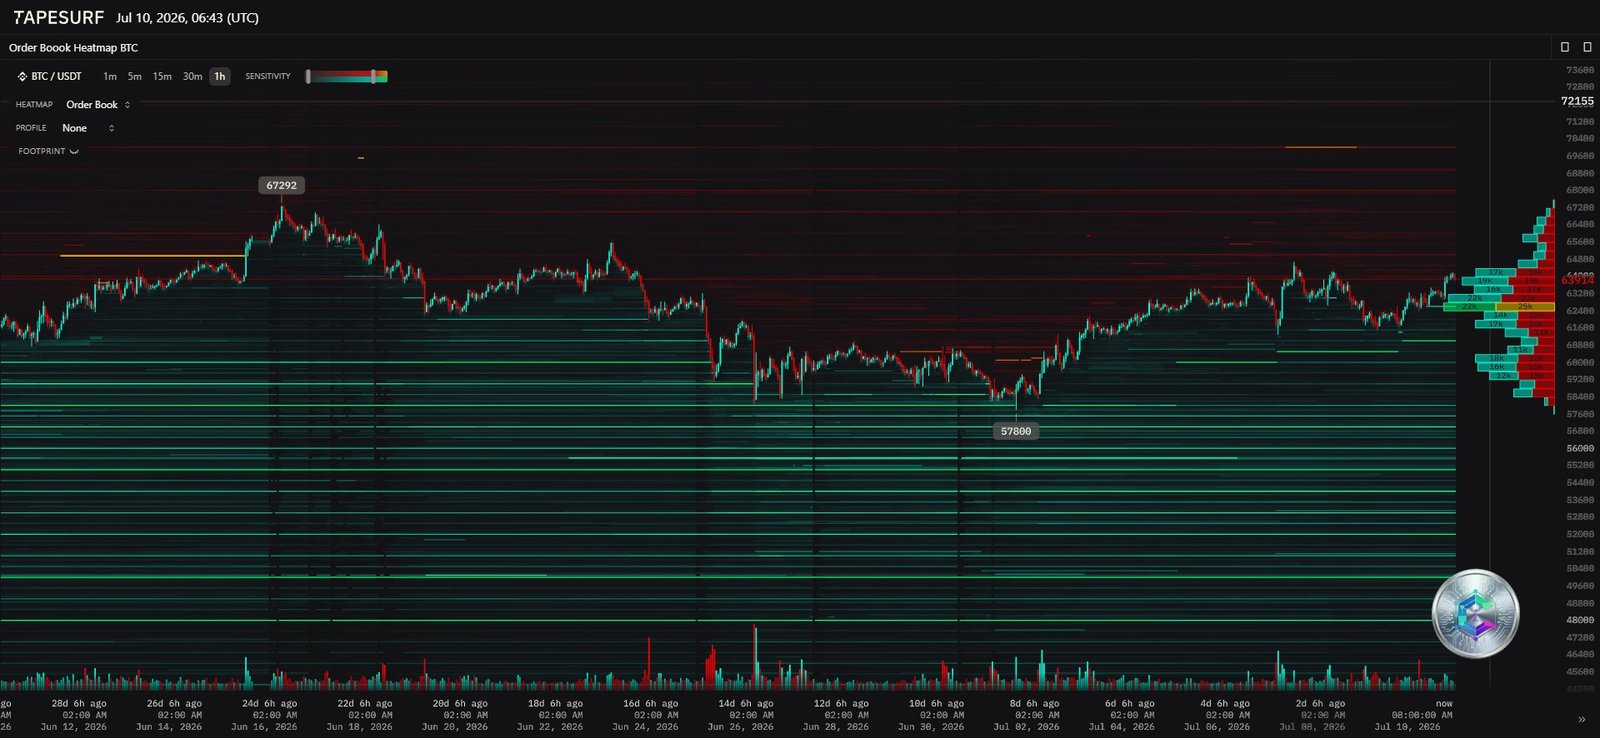
Above the market, a dense sell wall sits at $67,292 — an institutional ceiling where profit-takers have heavily stacked their sell orders. Below, a sizeable buy wall is anchored at $57,800, the last line of defense where large wallets have historically stepped in as buyers.
More intriguing still: the distribution of leveraged liquidations reveals a « magnet zone » around $67,645, holding roughly $247 million in short leverage, within a broader $2.26 billion pool of at-risk short positions. If Bitcoin manages to clear resistance at $64,500 and approach that zone, the classic short-squeeze mechanism could kick in — each forced liquidation of a short seller triggers an automatic buy-back that pushes the price higher, in turn triggering the next liquidation.
The symmetric risk exists to the downside too: sizeable clusters of long liquidations sit between $60,000 and $64,000, with a broader red zone from $56,000 to $63,000 on the monthly view. Losing the $60,000 level could therefore trigger a « long squeeze » toward the $50,000-$53,000 capitulation zone.
Daily chart: buyers versus sellers in a tug of war
On the daily chart, two algorithmic power blocks frame the market: a sell zone (« Sell Power: 65 ») between $64,000 and $66,000, and a buy zone (« Buy Power: 65 ») between $57,000 and $59,000. Price is currently trading in the gap between these two forces.
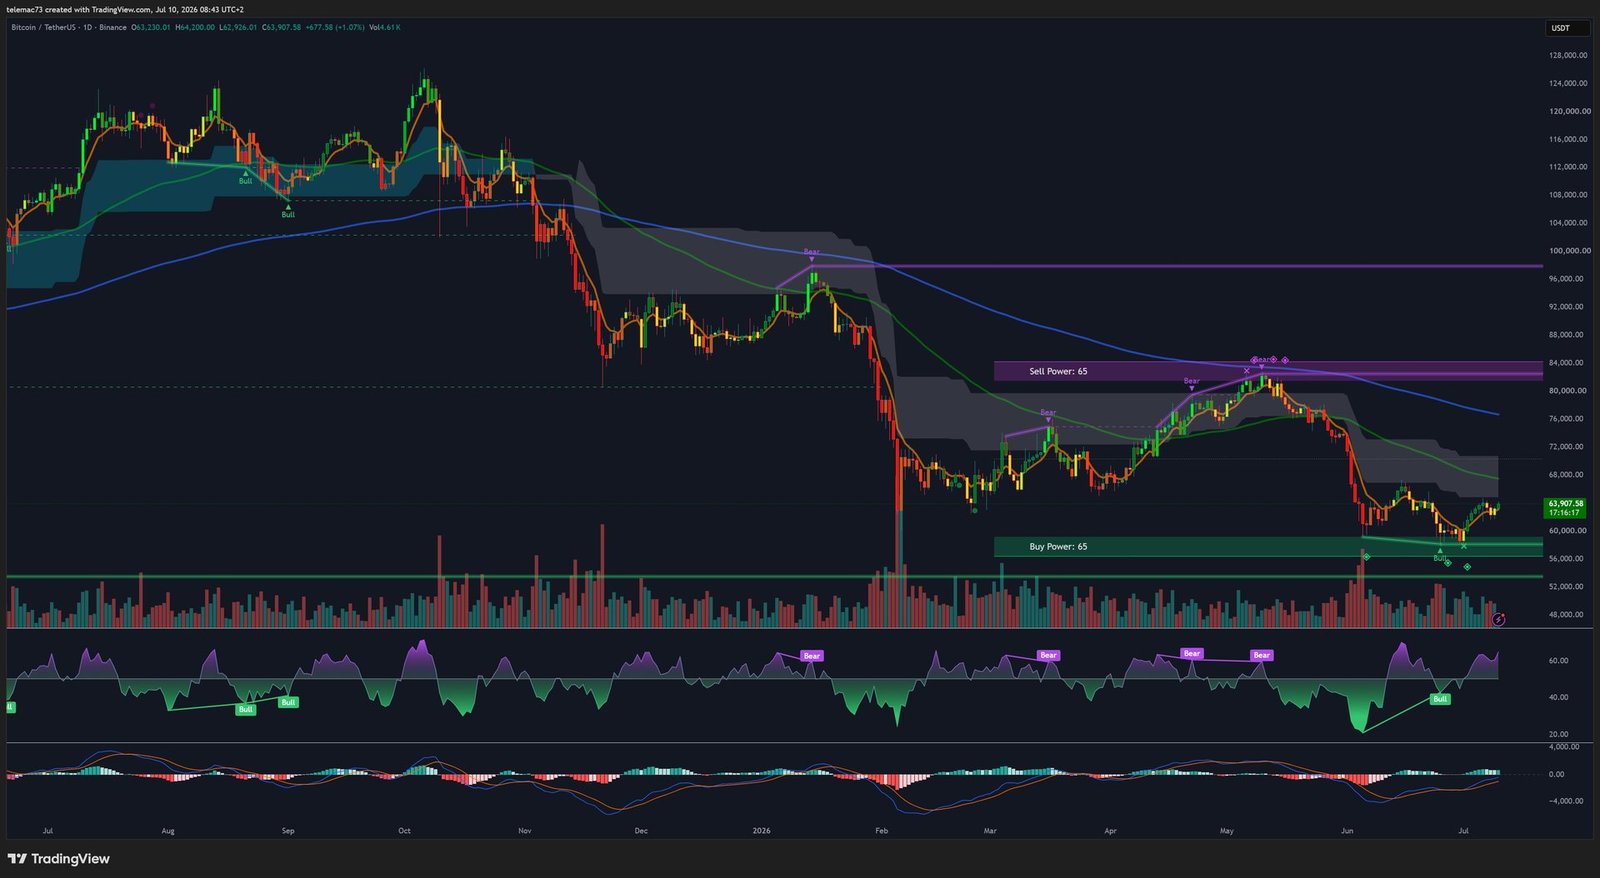
The moving-average structure remains bearish in the short term. The 50-day EMA (around $65,400-$65,450) converges with the resistance zone, while the 200-day SMA — recently lost — sits near $62,445, the classic dividing line between bull and bear regimes. Further out, the daily 200 EMA near $75,821 would act as the ultimate ceiling in an extreme upside scenario.
The daily RSI is hovering around 48.5, a neutral zone that reflects indecision more than a lack of strength. The MACD is sending a more encouraging signal: the bearish histogram bars are shrinking and both lines are flattening below the zero line, opening the door to a potential bullish crossover. The main technical threat remains the bear-flag pattern formed since the highs — its confirmation would mathematically project prices toward $50,000-$55,000.
4-hour chart: a squeeze that won’t hold much longer
Zooming into the 4-hour timeframe, the rebound from $57,700 is unfolding inside a rising triangle: higher lows, but highs consistently rejected by supply. The « Sell Power » block here reads 67, spanning $64,500-$66,000, while « Buy Power » at 63 forms a defensive trench between $58,000 and $60,000.
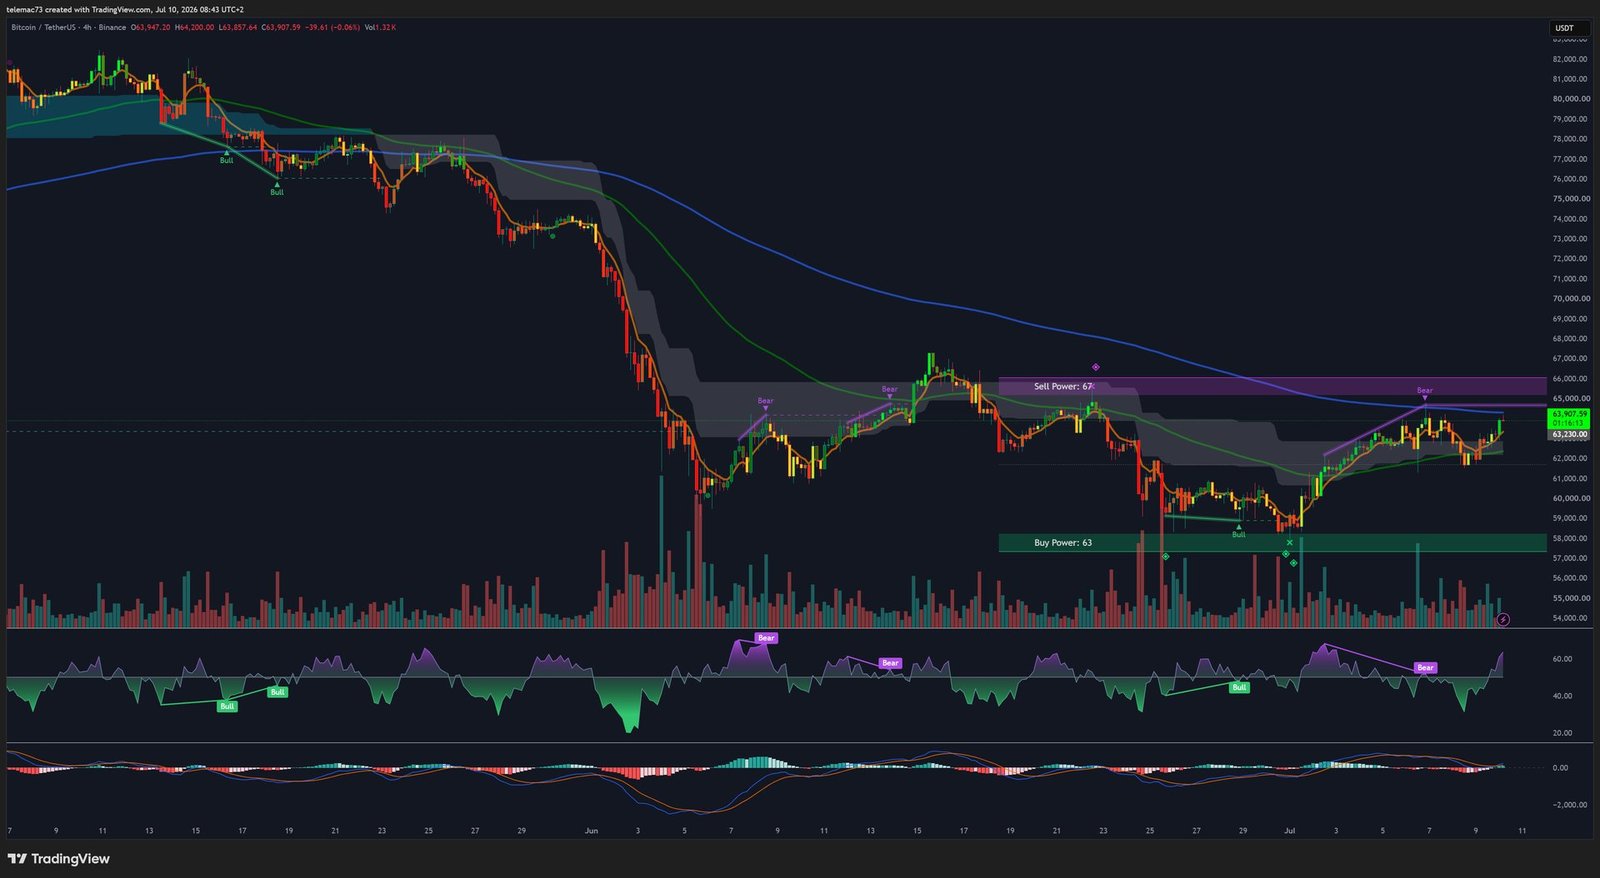
This tightening between the rising support line and horizontal resistance cannot persist indefinitely: it is building up energy that will need to release, potentially through a 10-15% move in either direction. The 4H RSI keeps failing to hold above 70, while the MACD stays tangled with no clear direction — the signature of an accumulation phase ahead of the real directional move.
15-minute chart: the execution dashboard
On the shortest timeframe, Bitcoin is trading around $63,900 in choppy, whipsaw price action — typical of a market waiting on a catalyst. Short-term moving averages keep crossing back and forth around the price axis, the RSI zigzags near 50, and the MACD drifts with no clear direction on either side of zero.
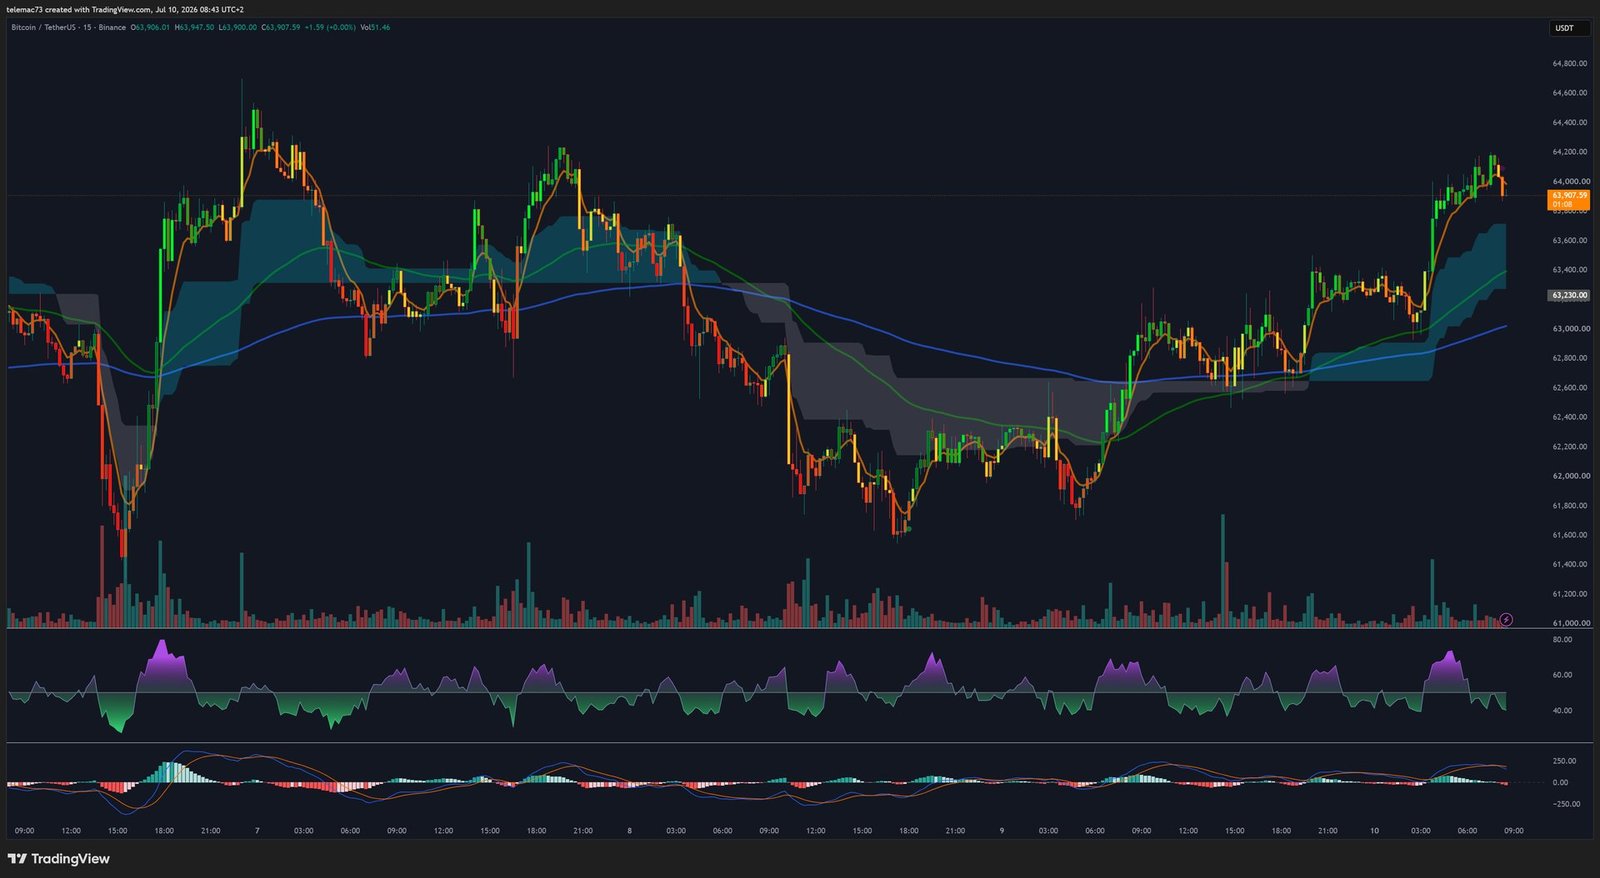
This timeframe isn’t meant to judge the broader trend, but it confirms the market remains patiently boxed into a tight range, waiting for either a macro catalyst or the activation of the liquidation levels identified above.
The July seasonal effect: a statistically favorable tailwind
Historically, June tends to be a corrective month for Bitcoin, while July often acts as a repair month. Data compiled by CoinGlass and CryptoQuant show an average July return between 7.5% and 7.6%, with a median of 8.2% — and that edge has held up even deep in bear markets: +20.96% in July 2018, and roughly +17% in July 2022.
With 2026 being a US midterm election year, historical July seasonality during such years rises to an average return of 10.3%. Applied to the current base, these statistical scenarios project Bitcoin between $64,500 and $66,100 in the median case, and as high as $73,500-$76,000 should the pattern of major July rallies repeat.
On the behavioral side, the Fear & Greed Index remains stuck in « extreme fear » territory (20-25), a level that has historically coincided with capitulation points offering favorable entries. But one counter-signal deserves attention: as soon as Bitcoin briefly reclaims $60,000, retail sentiment flips to extreme bullishness — an emotional swing that has historically acted as a bearish counter-signal, often exploited through stop-loss hunts.
Two scenarios to settle the debate
Bullish scenario: ETF inflows continue, miner supply gets absorbed, and Bitcoin invalidates its bear flag by closing durably above the 200-day SMA ($62,445) and then the 50-day EMA ($65,449). A break above $66,000 could then trigger the $67,645 magnet zone and its associated short squeeze, propelling prices toward $70,000-$75,000, in line with historical July seasonality.
Bearish scenario: a more hawkish-than-expected Fed and continued upward pressure on Japanese bond yields drain institutional liquidity, the Coinbase Premium rolls over again, and Bitcoin fails to reclaim the 50 EMA and 200 SMA. Losing $60,000 would act as the trigger for a long squeeze toward $56,000, with a risk of extension into the $50,000-$53,000 terminal zone.
The verdict will likely be decided as the current compression phase resolves, somewhere between upcoming US macro data releases and the July 28-29 FOMC meeting.
Disclaimer: This article is provided for informational and educational purposes only. It does not constitute investment advice, a recommendation to buy or sell, or a solicitation to trade any financial asset. Cryptocurrency markets are highly volatile and carry significant risk of capital loss. Always do your own research and consult a qualified financial advisor before making any investment decision.

