
Bitcoin (BTC) is navigating one of the most structurally damaging corrections in its history as of June 2026. After reaching an all-time high of $126,198, the asset has shed more than 50% of its value from its absolute peak and is down 30% year-to-date. This comprehensive analysis dissects the macro catalysts, on-chain data, order book structure, and multi-timeframe technical projections to map out the most likely scenarios ahead.
I. Macroeconomic Context: A Confluence of Headwinds
Unlike previous corrections — triggered by regulatory uncertainty in 2018 or systemic collapses in 2022 (Terra/Luna, FTX) — the June 2026 downturn is fundamentally macroeconomic in nature. Three converging forces explain this dynamic:
- Persistent Inflation: The May 2026 CPI print came in at 4.2% year-over-year — more than double the Fed’s 2% target. Markets are now pricing in the systemic risk of an additional 25 basis point rate hike, mechanically reducing the appeal of non-yield-bearing assets like Bitcoin.
- Geopolitical Flashpoints: Escalating US/Iran tensions around the Strait of Hormuz — a chokepoint for 20% of global oil supply — have fueled a powerful risk-off move, strengthening the dollar (DXY) and weighing on all risk assets.
- Opportunity Cost: Rising real bond yields are rotating capital toward traditional safe-haven assets at the expense of cryptocurrencies.
II. Market Structure and Institutional Behavior
The institutional landscape reveals unprecedented fragility. Spot Bitcoin ETFs have recorded the longest streak of net outflows in their history: over $4 billion withdrawn across 13 consecutive sessions. This mass disengagement reflects a deep reassessment of portfolio allocations in a hostile macro environment.
The major psychological shock was the revelation that Strategy (formerly MicroStrategy) — the unassailable bastion of perpetual Bitcoin holding — officially liquidated a portion of its reserves for the first time since 2022. While modest in volume, this event shattered the « diamond hands » institutional narrative.
The Historic Divergence: Miners Pivot to AI
A striking market anomaly: while BTC drops 30%, a representative basket of publicly traded mining company stocks posted a gain of over 56% over the same period. The explanation lies in a massive strategic pivot: mining infrastructure is being redirected toward AI/HPC data centers, with multi-year energy contracts signed with hyperscalers such as Alphabet and Microsoft. This pivot reduces miners’ exposure to BTC price cycles while structurally altering the market’s supply/demand equilibrium.
III. On-Chain Data: Advanced Capitulation Zone
| On-Chain Metric | Current Value | Historical Reference | Implication |
|---|---|---|---|
| STH Supply in Profit | 3.3% (low at 0.6%) | 55% (4-year average) | 95% of recent buyers are in unrealized losses → massive capitulation risk |
| Realized Price | $53,500 | — | Global average acquisition cost; holding above preserves the macro bull cycle integrity |
| SOPR | Below 1 | Equilibrium at 1 | Market participants are selling at a loss → globally defensive posture |
| Realized Losses | 17% – 19% | — | Terminal phase of portfolio washout |
The vast majority of Bitcoins acquired over the past five months were purchased at prices above current levels. This situation transforms the market into a powder keg: sellers have temporarily exhausted their ammunition, but fresh demand is lacking to establish a durable floor.
IV. Liquidation Heatmap Analysis
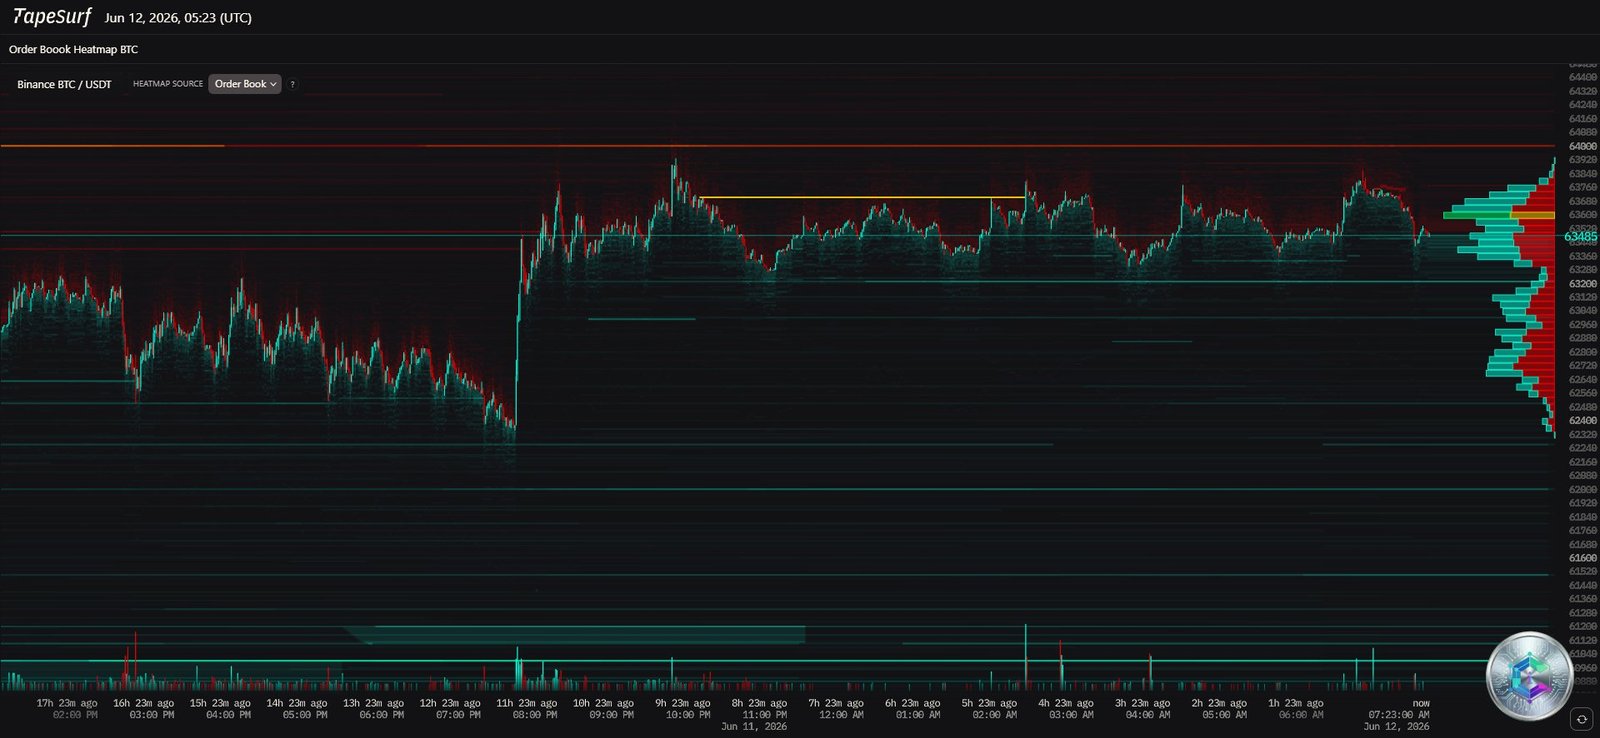
The June 4th session was the scene of a historically brutal deleveraging event: $1.8 billion in margin positions liquidated within 24 hours, with 85% being long positions ($777 million in BTC contracts wiped out). The heatmap analysis reveals three critical zones:
- Sell Wall ($63,500 – $64,000): Massive concentration of sell orders and short position stop-loss orders. An unexpected breach above $64,000 could trigger an extreme short squeeze, with liquidity suddenly vacuumed upward by forced buybacks.
- Liquidity Void Below $63,500: The order book is remarkably thin. The next significant liquidity concentration sits around the critical psychological threshold of $60,000.
- The Abyss Below $60,000: Wintermute has identified a latent liquidity zone between $50,000 and $59,000 where numerous institutional margin calls would be triggered.
V. Multi-Timeframe Technical Analysis
Daily Chart — Long-Term View
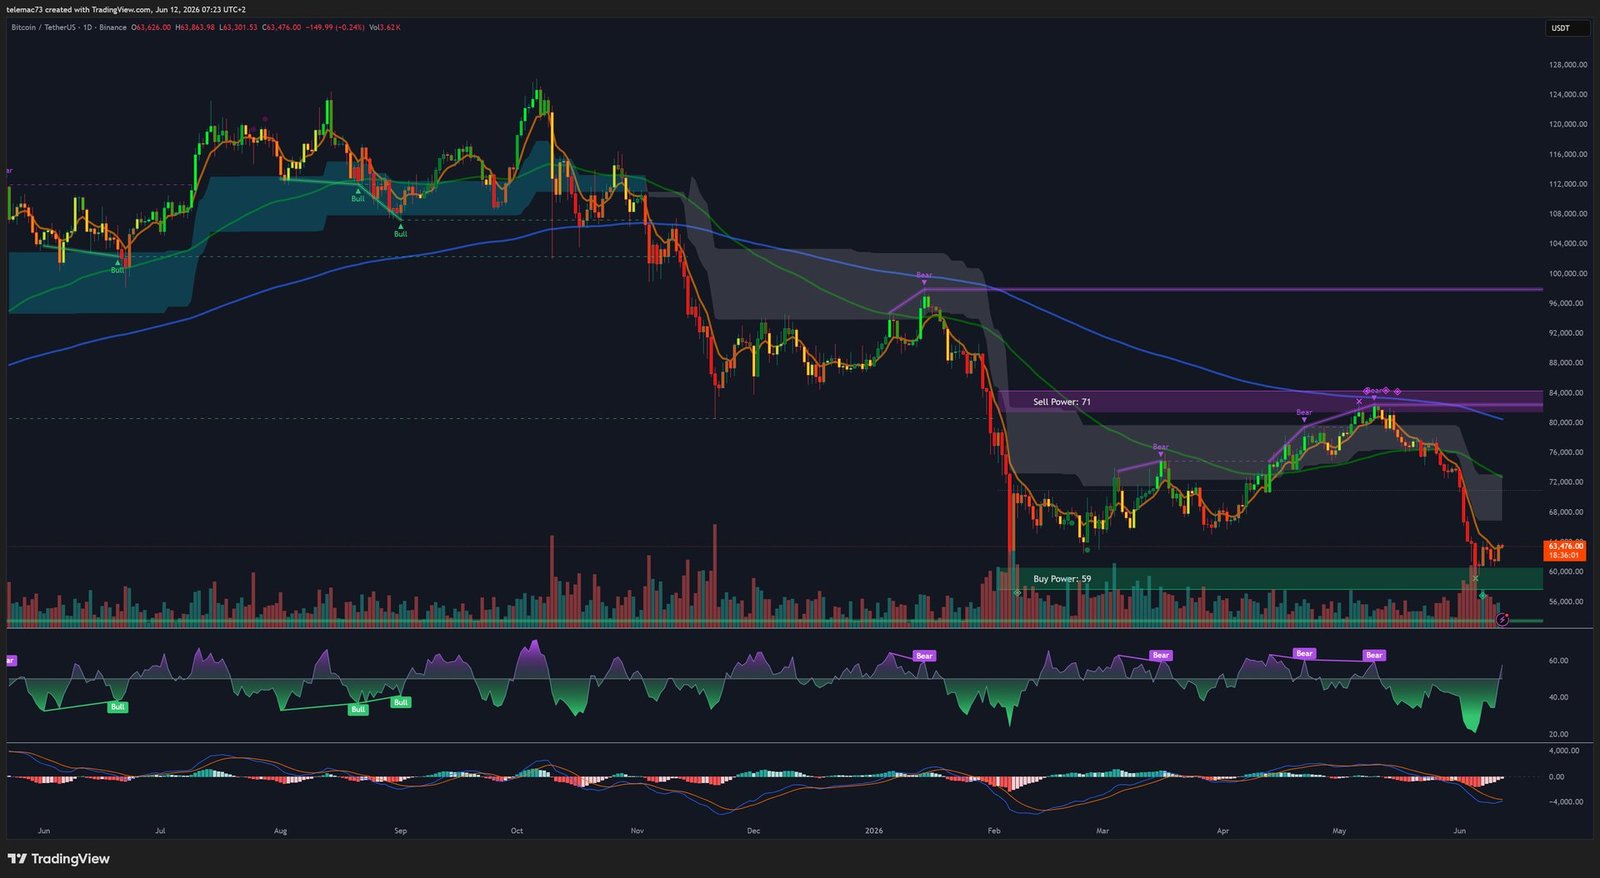
The daily chart presents a heavily deteriorated market structure. The asset is trading within a descending channel, printing a systematic succession of lower highs and lower lows. Key observations:
- 200-Day EMA: Located between $80,500 and $83,300 — more than 20% above current price. The asset is firmly in confirmed bear market territory.
- 200-Day SMA: At $61,968, violently breached to the downside — a historical equilibrium level whose loss exacerbated liquidations.
- Imminent Death Cross: The converging trajectories of the 50 EMA (≈$75,000) toward the 200 EMA signal an impending Death Cross, triggering algorithmic sell pressure from quant funds programmed to follow trend.
- Head & Shoulders Formation: The neckline broke below $63,000. The 100% Fibonacci extension projects a bear target at $49,000.
- Daily RSI: Hit 25.75 at peak panic — extreme oversold territory historically associated with capitulation phases.
4-Hour Chart (H4) — Medium-Term View
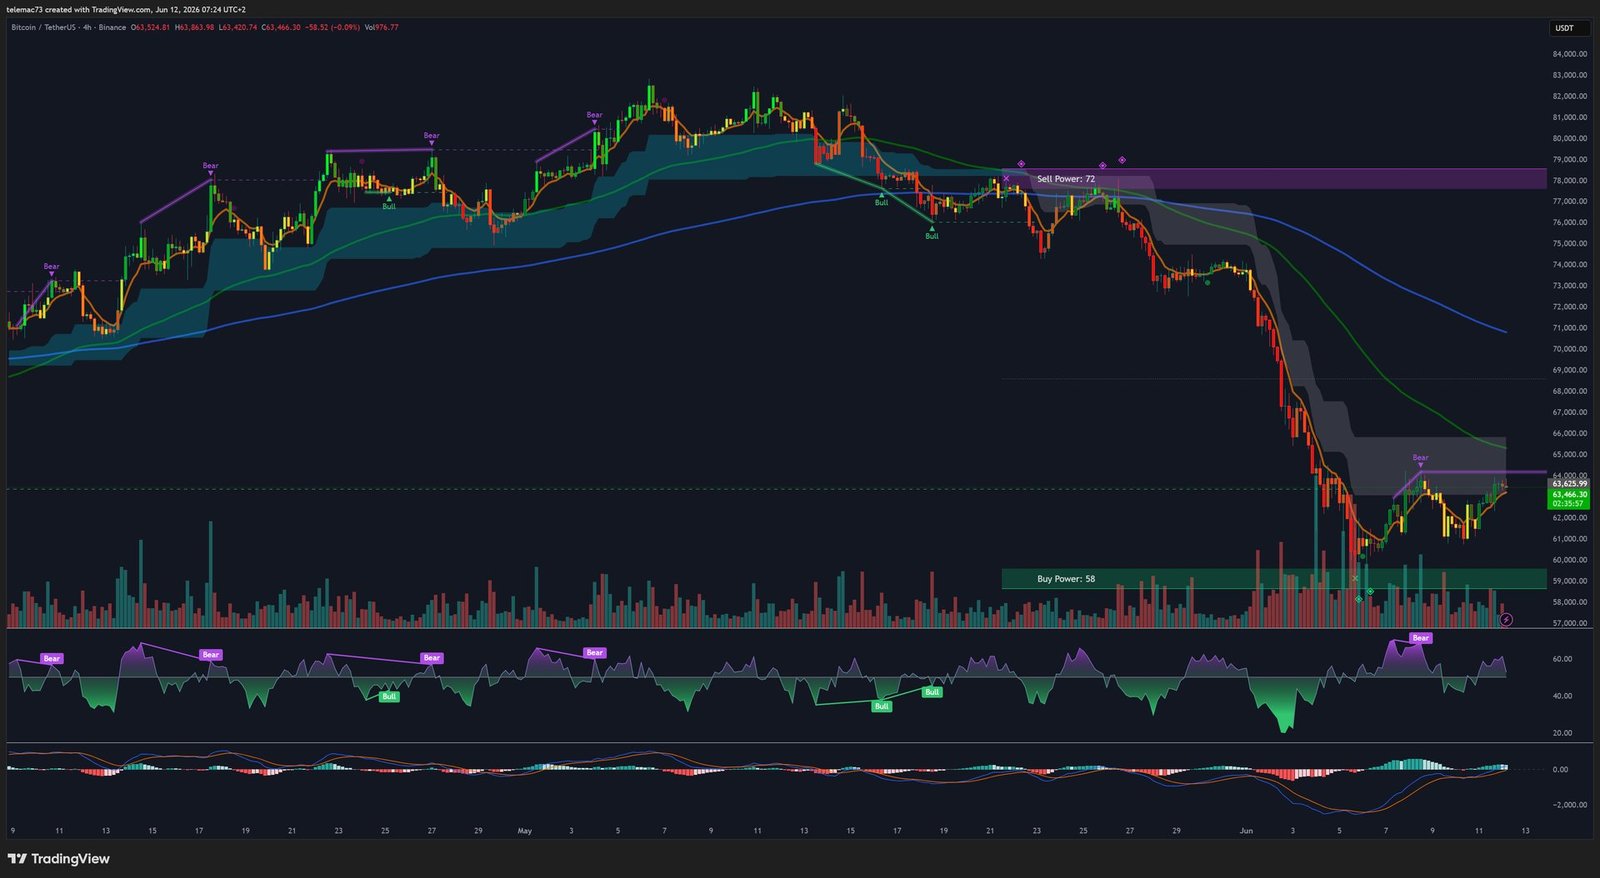
The H4 chart perfectly illustrates the staircase decline mechanism. A classic series of Bear Flags is visible: massive red candle (flagpole) followed by a narrow ascending consolidation on declining volume (flag), then a downward breakdown. The « Sell Power: 72 » marker detected prior to the main collapse signals aggressive institutional distribution. The MACD shows a faint bullish crossover, but positioned so far below the zero line that it resembles a dead cat bounce rather than a genuine recovery.
15-Minute Chart (M15) — Short-Term View
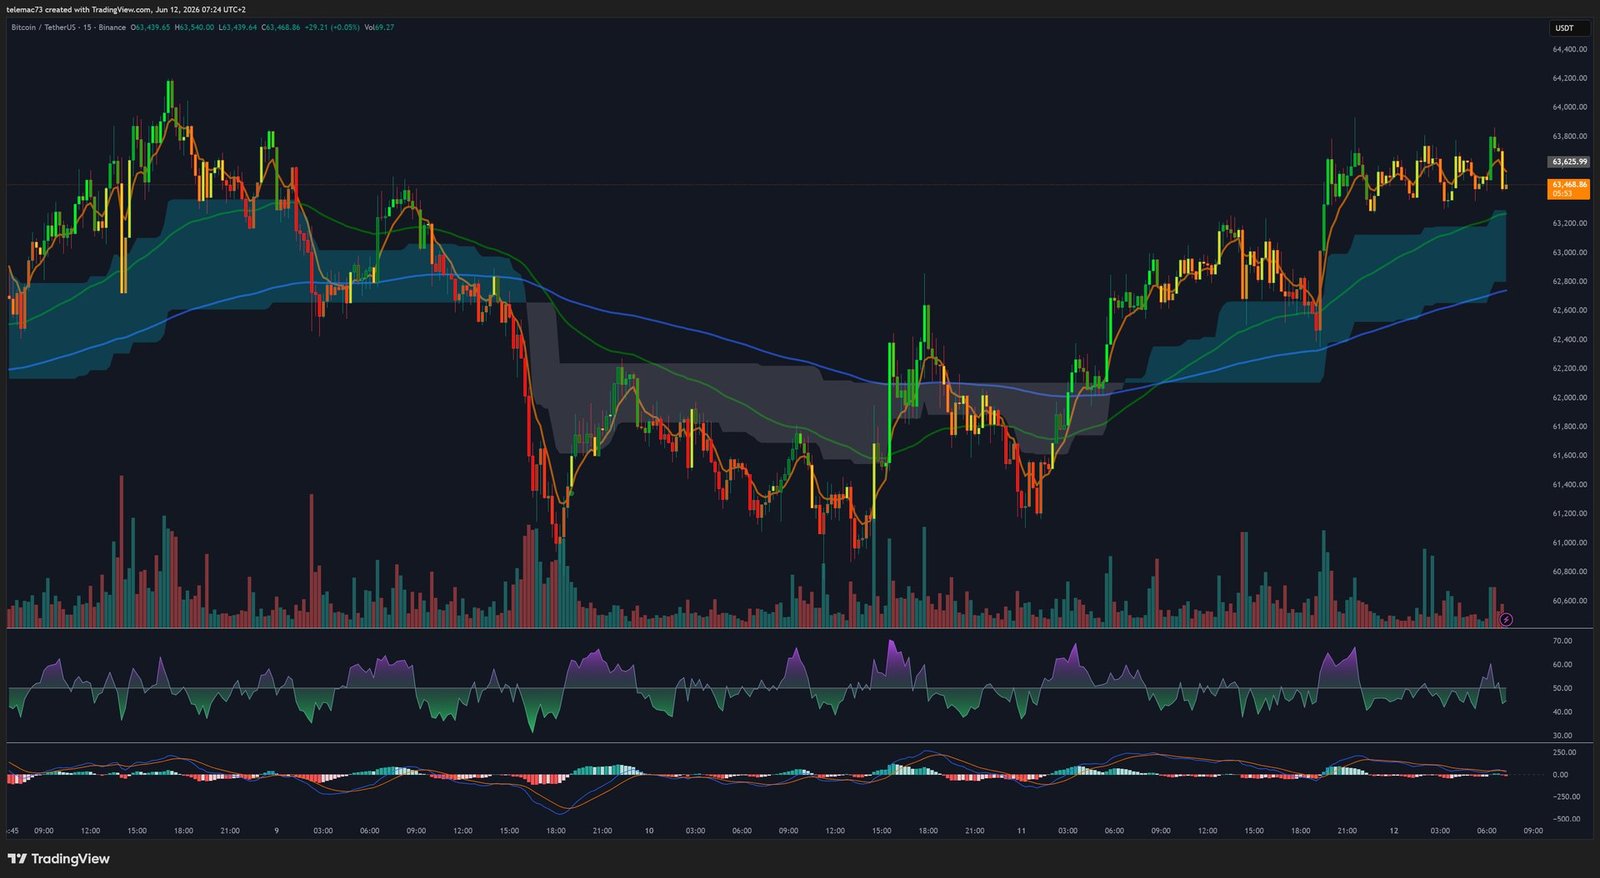
The M15 chart reveals an extremely choppy price action, dominated by HFT scalping bots. Repeated symmetric compression triangles form and resolve. The numerous Golden Crosses generated on this timeframe systematically morph into bull traps: the order book lacks sufficient depth to sustain breakouts, and trapped buyers’ stop-losses fuel the bearish reversals. The $63,800 level acts as an impenetrable ceiling on this timeframe.
VI. Key Price Level Map
| Price Level | Status | Significance |
|---|---|---|
| $80,500 – $83,300 | 🔴 Absolute macro resistance | 200-Day EMA — the long-term bear/bull market boundary |
| $75,000 | 🔴 Dynamic resistance | Falling 50-Day EMA — first line of the secular bearish defense |
| $70,000 | 🟠 Pivot / Key resistance | Major psychological level — reclaiming this would invalidate the local bearish structure |
| $63,800 – $64,000 | 🟠 Immediate barrier | H4 channel top + heatmap sell wall — potential short squeeze ignition zone |
| $61,968 | 🟡 Reclaimed resistance | 200-Day SMA — former equilibrium line, now acting as resistance |
| $60,000 | 🟡 Critical psychological support | Ultimate short-term institutional buyer defense line |
| $53,500 | 🟢 On-chain floor | Global Realized Price — ultimate bastion of the macro bull cycle |
| $49,000 | 🔵 Projection target | 100% Fibonacci extension post H&S neckline break |
| $44,000 – $45,000 | 🔵 Secular support | August 2024 institutional floor — gravitational bottom in a prolonged crypto winter |
VII. Probabilistic Scenario Analysis
🎯 Scenario 1 — Ultimate Purge and Macro Floor Formation (Dominant Probability)
The repeated failure to break above the $63,800 – $64,000 sell wall is progressively exhausting buyers. The base case scenario anticipates an inevitable breakdown below $60,000, triggering a stop hunt and liquidity vacuum into the void between $50,000 and $59,000. The asset would then test the Realized Price at $53,500 — the point of total capitulation for short-term holders. This violent washout would lay the foundations for a prolonged summer accumulation phase, setting up a trend reversal in Q3-Q4 2026, consistent with the historical post-halving cycle timeline.
⚡ Scenario 2 — Short Squeeze and Recovery (Moderate Probability)
With the daily RSI having touched 25.75, the seller overextension is monumental. An unexpected macro catalyst (dovish Fed statement, geopolitical de-escalation) could serve as the detonator. A breach of $63,800 would trigger a cascade of forced buybacks, instantly launching the asset above $65,000 toward the key pivot at $70,000. This move would break the H4 bearish continuation structures.
☠️ Scenario 3 — Macro Black Swan and Extended Crypto Winter (Low Probability, Systemic Impact)
In the event of systemic deterioration — stubborn inflation forcing multiple unexpected rate hikes — the institutional flight to risk-free yield would become absolute. The convergence of TradFi (IBIT) and crypto-native (Deribit) options markets would produce synchronized devaluation. The $53,500 on-chain support would give way without resistance, opening the path to $49,000 and ultimately the secular support zone of $44,000 – $45,000. A multi-quarter crypto winter would necessitate a complete reset of the mining industry and institutional investment architecture.
Conclusion
Navigating the Bitcoin market in June 2026 is an exercise in extreme financial precision. The singular alignment of macroeconomic headwinds (inflation, rates, geopolitics), structural demand deterioration through ETF outflows, and a heavily bearish technical asymmetry demands mathematical, disciplined risk management. Closely watching the $63,800 and $60,000 levels remains the top priority for market participants, as the resolution of this compression will dictate the asset’s secular trajectory for the remainder of the decade.
⚠️ Disclaimer: This article is written for educational and informational purposes only. It does not constitute investment advice, nor a recommendation to buy or sell any digital asset. Cryptocurrency markets are highly volatile. All investments carry risk, including the total loss of capital invested. Please consult a licensed financial advisor before making any investment decision.