
The Bitcoin market is experiencing a historic transition phase in early February 2026. After peaking at $126,210 in October 2025, the leading cryptocurrency has undergone a massive correction of nearly 50%, now fluctuating around $69,795. This in-depth analysis examines technical dynamics, institutional flows, and the impact of new U.S. monetary policy to identify key levels and likely market trajectories.
Macroeconomic Context: The Warsh Era and Its Implications
The major event of 2026 remains Kevin Warsh’s appointment as Federal Reserve Chairman by the Trump administration. This decision sent shockwaves through markets, introducing complex duality into monetary policy.
A Monetary Paradox
Kevin Warsh presents a paradoxical profile for markets. On one side, he’s perceived as favorable to interest rate cuts, traditionally bullish for risk assets like Bitcoin. On the other, his commitment to Fed balance sheet reduction (Quantitative Tightening) raises fears of brutal global liquidity contraction.
This uncertainty triggered a 14% Bitcoin drop the week following the announcement. The market struggles to anticipate a stimulus scenario amid persistent 3.4% inflation. Bitcoin, once considered an inflation hedge, now behaves more like a high-beta tech asset, unable to attract defensive flows unlike gold which has crossed $5,000.
Key Events Calendar
Current volatility is amplified by the absence of clear economic data, consequence of partial U.S. government shutdown since January 31, 2026. Investors closely monitor upcoming events:
- February 10: Robinhood Q4 Results – Retail trading activity indicator
- February 11: China CPI – Global demand measure
- February 12: Coinbase Q4 Results – Institutional adoption signal
- February 13: U.S. CPI (January) – Major determinant for rate expectations
Multi-Timeframe Technical Analysis
Examining charts across different timeframes reveals a market structure stabilizing after a major capitulation phase.
Daily View: A Structural Floor?

On the daily chart, Bitcoin shows signs of exhaustion from the downtrend initiated in October 2025. The fall from $126,000 to $60,000 represents a significant Fibonacci retracement. The $60,000 level acted as a robust psychological floor, reinforced by miners’ average electricity production cost, estimated at $58,740.
The RSI indicator reached extreme oversold levels, similar to those observed during the 2022 bottom at $15,000. This configuration suggests that while the macro trend remains fragile, further downside risk is limited by solid on-chain fundamentals, notably active accumulation by whales (holders of more than 1,000 BTC).
4-Hour Perspective: Critical Structure
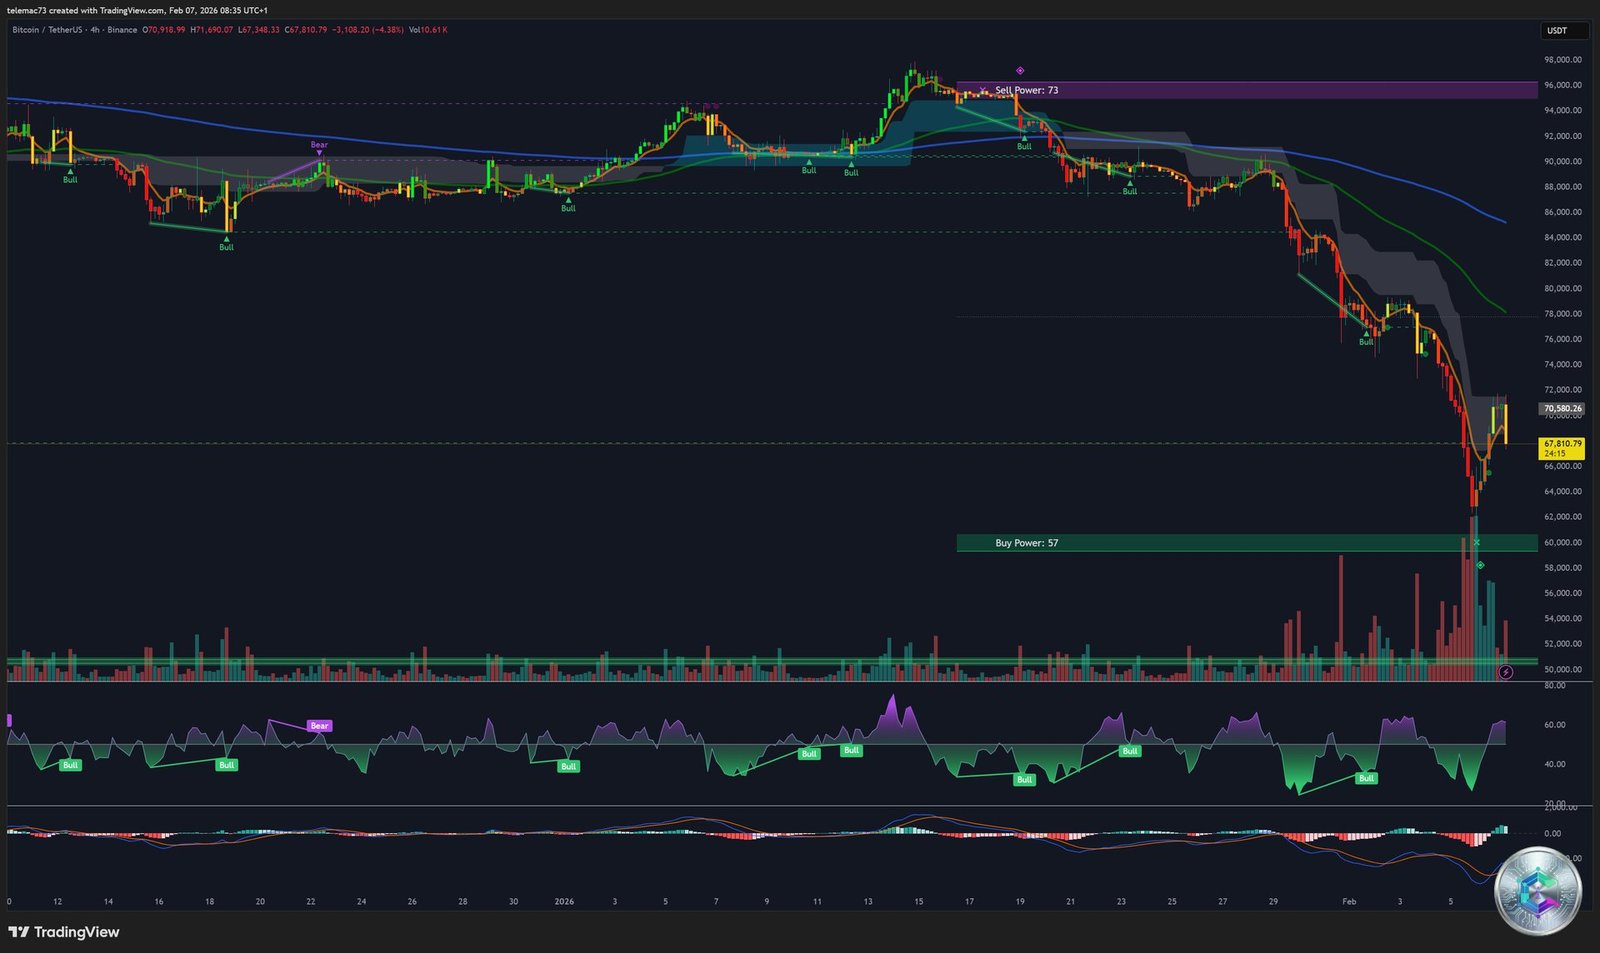
The 4-hour chart highlights a bearish wedge structure that resolved downward in January, leading to the $60,000 test. Currently, price attempts to form a higher low around $67,000. The 50-day moving average, located near $88,790, remains the primary target for a relief rally, but its recapture seems improbable without a major monetary catalyst.
Intraday Dynamics: Extreme Volatility
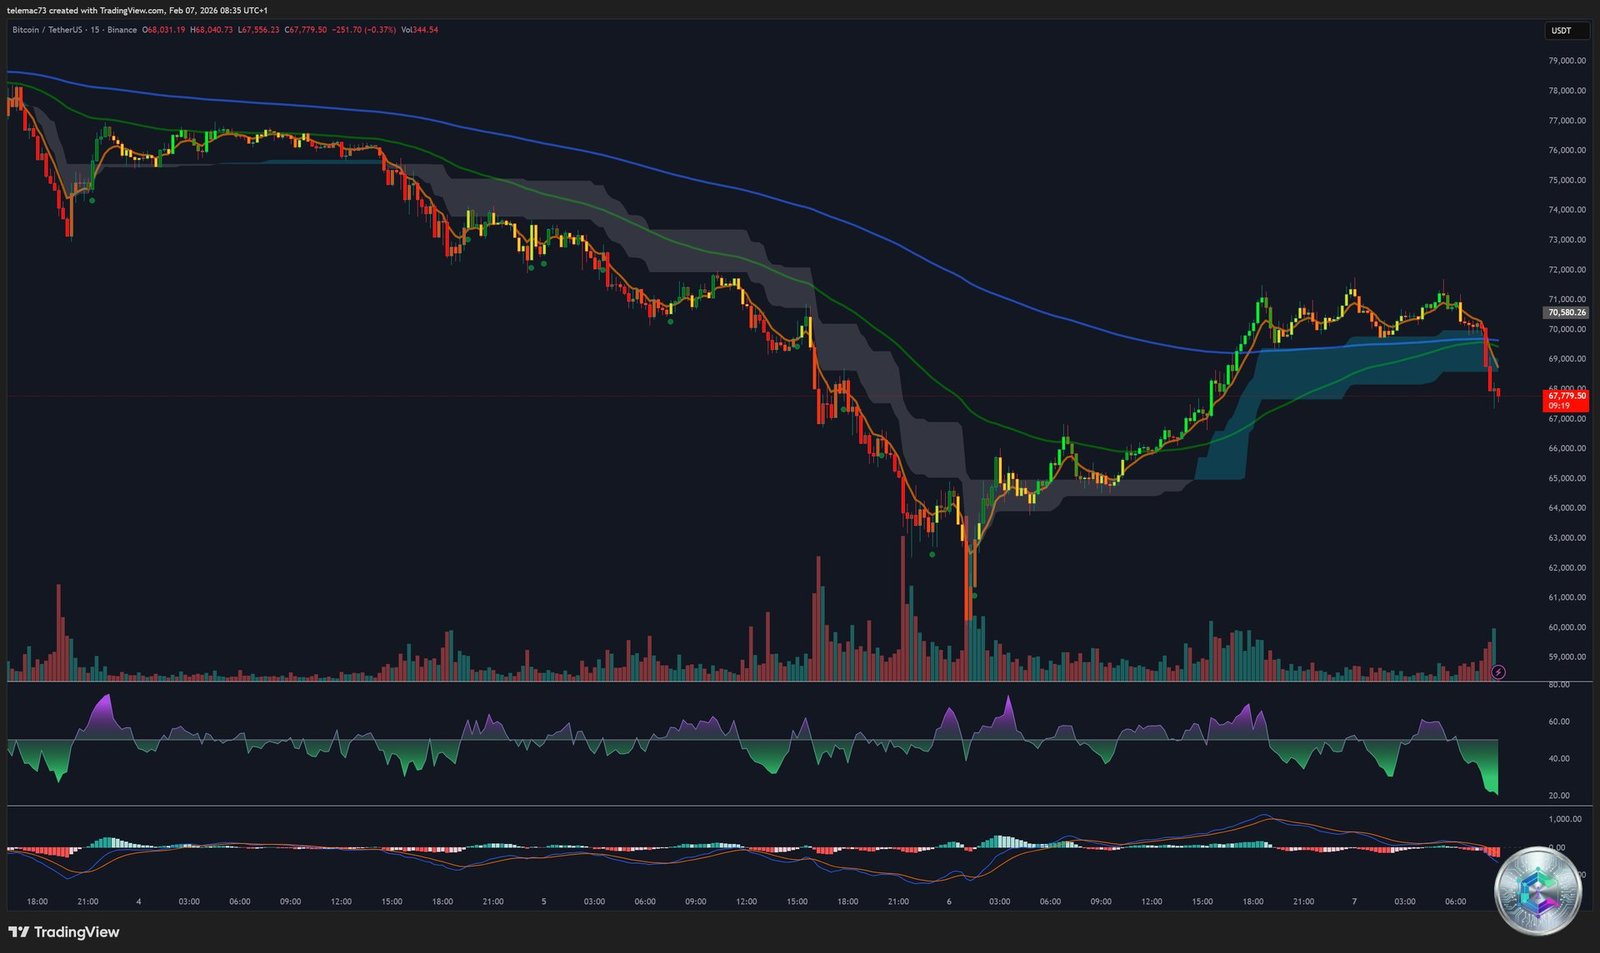
The 15-minute timeframe illustrates sawtooth volatility. Movements are largely dictated by high-leverage position liquidations. Regular sweeps of short liquidity zones above $70,000 are observed, followed by quick returns to the $67,500 support. The recent flash crash on Bithumb exchange to $55,000, though anomalous, left psychological traces.
Microstructure Analysis: The Liquidation Heatmap
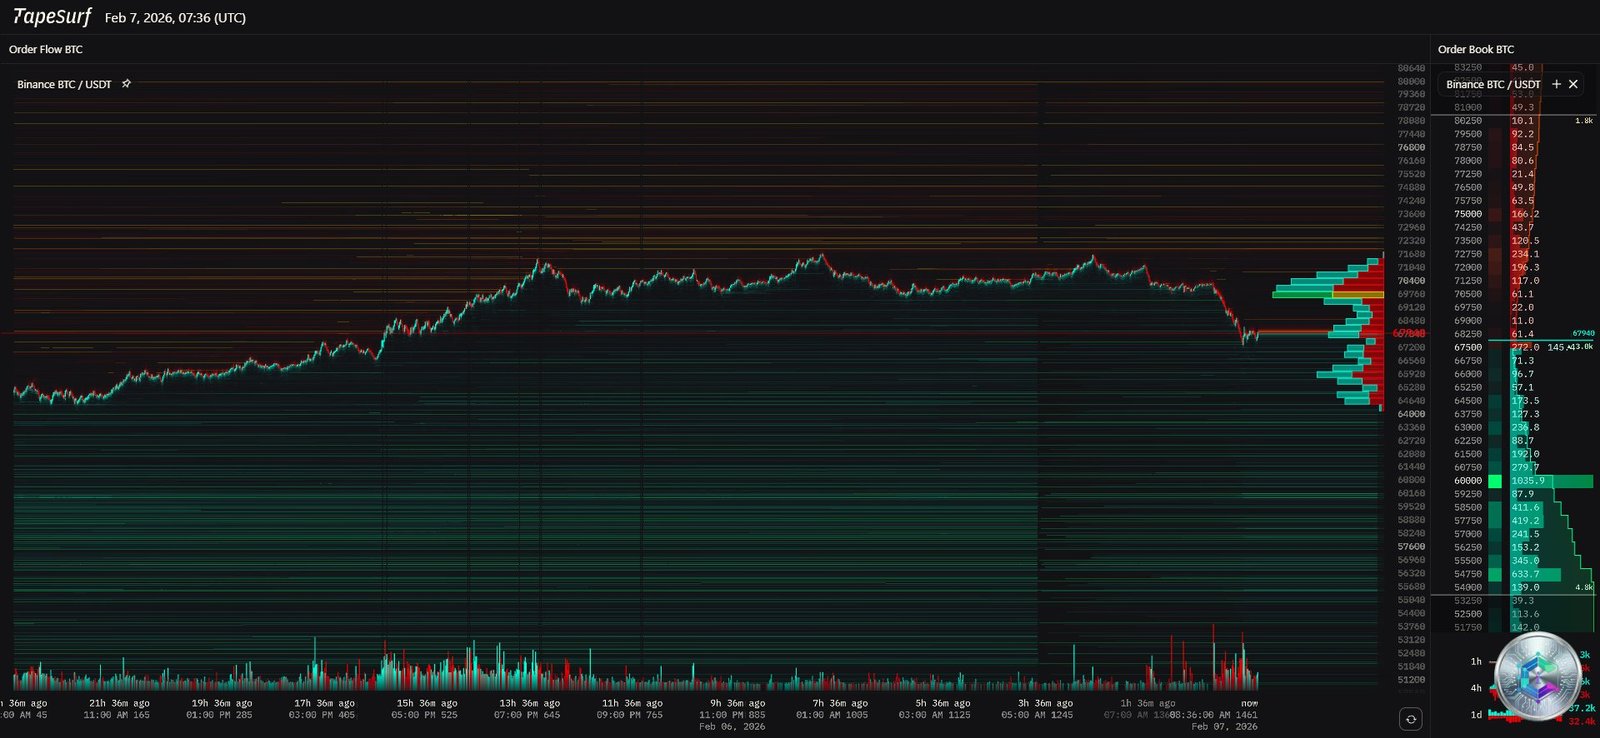
The liquidation heatmap reveals massive concentrations of stop-loss orders and leveraged positions. Key identified zones show:
- $72,000 – $74,600: Major short concentration, critical resistance zone
- $67,000 – $68,000: Current support with progressive accumulation
- $60,000 – $62,000: Floor zone with significant liquidity
These levels represent zones where market makers and institutions can trigger liquidation cascades to capture liquidity before reversing the trend.
Institutional Flows: The ETF Barometer
Bitcoin spot ETF flows constitute a crucial indicator of institutional confidence. Since November 2025, the market has registered $6 billion in net outflows, with BlackRock alone losing $3.1 billion. Despite these alarming figures, BlackRock’s IBIT ETF displays remarkable resilience with $272 million in inflows during the last week of January.
This divergence suggests a selective accumulation strategy by the most sophisticated asset managers, potentially anticipating a rebound once macroeconomic clarity is restored.
Key Technical Levels
Professional traders closely monitor these strategic levels:
Resistances
- R1 – $74,600: Critical short-term pivot, downtrend invalidation
- R2 – $84,000: Former major support, now psychological resistance
- R3 – $100,000: Major psychological threshold, recapture would signal complete reversal
Supports
- S1 – $67,500: Immediate support, active accumulation zone
- S2 – $60,000: Psychological floor tested early February
- S3 – $58,740: Average miners’ electricity production cost
2026 Scenarios
Bullish Scenario
If the Fed stabilizes its balance sheet while cutting rates to support employment after the shutdown, the U.S. dollar could weaken. This would trigger massive return to Bitcoin as an alternative to the fiat system. The current correction wave would end, opening the path to a final wave targeting $164,000 by year-end according to Elliott Wave analysis.
Bearish Scenario
If inflation remains above 3.5% and Kevin Warsh maintains aggressive Quantitative Tightening, the vampire effect on liquidity will continue weighing on the market. Bitcoin could then revisit the $50,000 level, or even $45,000, to completely purge institutional positions entered late in 2025.
Recommended Trading Strategy
Facing this market configuration, several strategic approaches emerge:
- Range Trading: Favor purchases in the $60,000-$63,000 zone and profit-taking toward $72,000-$74,000
- Progressive Accumulation: DCA (Dollar Cost Averaging) on major supports for long-term investors
- Risk Management: Tight stops below $58,000 to limit exposure in case of technical floor break
- Catalyst Monitoring: Special attention to February 13 inflation data and weekly ETF flows
Conclusion
Comprehensive February 2026 analysis indicates Bitcoin has likely reached a structural value bottom between $58,000 and $63,000. The financial leverage purge, materialized by record liquidations, has cleaned the market of its speculation excess. Although sentiment remains anchored in « Extreme Fear » (Index at 5/100), on-chain indicators like Z-Score and production cost suggest a historic accumulation zone.
The $74,600 pivot remains the keystone of the short-term trend. Recapturing this level would invalidate the prolonged bear market thesis. Conversely, as long as Bitcoin remains below this bar, the dominant strategy of institutional players seems to be « Sell-the-Rally ». Monitoring BlackRock’s IBIT ETF flows will be the ultimate barometer of institutional confidence in coming weeks.
For market operators, caution remains necessary until U.S. inflation data is clarified. The current structure favors range trading strategies between $60,000 and $76,000, awaiting clear macroeconomic resolution.
Disclaimer: This article is provided for educational and informational purposes only. It does not constitute investment, financial, or trading advice in any way. Cryptocurrency markets are extremely volatile and carry significant risks. Always conduct your own research (DYOR) and consult a professional financial advisor before making any investment decision. Past performance does not guarantee future results.