
Introduction: An Unprecedented Confluence of Dynamics
Bitcoin’s trajectory at the dawn of Q2 2026 unfolds within a paradigm of rare complexity. This pivotal period is defined by an unprecedented convergence of restrictive macroeconomic dynamics, a profound restructuring of institutional ownership, and critical technical configurations observed across multiple timeframes.
After registering a meteoric all-time high (ATH) of $126,021 in October 2025, Bitcoin now navigates a volatility channel between $64,000 and $71,000, sustaining a structural correction of approximately 45–50% from its peak. This comprehensive, multidimensional analysis dissects the forces at play to anticipate the asset’s probable trajectories over the coming weeks.
🌍 Macroeconomic Environment: The Weight of the Fed and Inflation
Assessing Bitcoin’s directional trajectory requires a nuanced understanding of global macroeconomic variables. As the asset has become institutionalized, its behavior is now intrinsically correlated with fiat liquidity fluctuations and central bank policy expectations.
The Federal Reserve and the Inflationary Enigma
By late March 2026, markets assign only a 50% probability to rate cuts for the current year — a dramatic revision from the accommodative expectations at the start of the year. This uncertainty is compounded by a resurgence of inflationary pressures, driven by an energy shock that pushed crude oil prices above $100 per barrel.
This « higher for longer » rate regime mechanically reduces liquidity available for speculative assets and increases the opportunity cost of holding non-yielding Bitcoin. With the BTC/S&P 500 correlation currently at 78%, every U.S. economic release (NFP, JOLTS, ADP, retail sales) acts as a continuous stress test for the entire crypto ecosystem.
Geopolitics and Risk Premiums
Persistent Middle East tensions triggered a classic flight-to-quality movement, pushing capital toward gold, Treasuries, and stablecoins. Stablecoin market capitalization hit a record $210 billion, reflecting an enormous pool of dormant capital waiting to be redeployed.
Quantitative models estimate that a confirmed ceasefire could trigger a 8–15% relief rally within hours, fueled by the reallocation of these idle reserves back into risk assets.
🏦 Fundamental Market Structure: ETFs, Corporate Treasuries & Mining
The Bitcoin ETF Revolution
March 2026 witnessed a striking trend reversal. U.S.-domiciled Bitcoin spot ETFs collectively recorded approximately $2.5 billion in net inflows over recent weeks. BlackRock’s iShares Bitcoin Trust (IBIT) exemplifies this resurgence, ranking in the top 2% of all U.S. ETFs for capital attraction.
Remarkably, these inflows occurred after a 40% price decline over six months — demonstrating unprecedented institutional conviction. The institutionalization extends to Europe, with BNP Paribas integrating crypto ETNs into its French brokerage platform as of March 30, 2026.
| Issuer (Ticker) | Type | Estimated AUM | 24h Change |
|---|---|---|---|
| BlackRock (IBIT) | Spot (Physical) | $55.5B USD | -3.66% |
| Fidelity (FBTC) | Spot (Physical) | $13.1B USD | -3.67% |
| Grayscale (GBTC) | Spot (Physical) | $11.4B USD | -3.69% |
| Bitwise (BITB) | Spot (Physical) | $2.7B USD | -3.68% |
| Ark / 21Shares (ARKB) | Spot (Physical) | $2.5B USD | -3.65% |
| ProShares (BITO) | Futures | $1.8B USD | -3.72% |
Holder Concentration and the Latent Supply Shock
Of Bitcoin’s 21 million maximum supply, approximately 20 million have been issued. Their growing concentration in corporate and sovereign hands significantly reduces the free float available for trading:
| Category | Holder | Volume (BTC) | % of Supply |
|---|---|---|---|
| Creator (Inactive) | Satoshi Nakamoto | ~1,100,000 | ~5.50% |
| Custodian / Exchange | Coinbase | 982,000 | ~5.00% |
| ETF Issuer | BlackRock (IBIT) | 775,000 | ~3.80% |
| Listed Company | MicroStrategy (MSTR) | 762,099 | ~3.50% |
| Sovereign State | U.S. Government | 328,000 | ~1.64% |
| Stablecoin Issuer | Tether | 96,000 | ~0.48% |
MicroStrategy stands as the principal architect of corporate adoption, unveiling a $44.1 billion capital raise program exclusively dedicated to Bitcoin acquisition. The firm accumulated nearly 90,000 additional BTC in the first three months of 2026 through innovative financial engineering mechanisms.
Mining Economics: A Sector Under Pressure
On-chain analysis reveals a critical asymmetry within the mining industry. Efficient mega-operators display production costs between $34,000 and $43,000 per BTC and remain comfortably profitable at current prices. However, a substantial portion of the global hashrate carries extraction costs between $75,000 and $87,000 — these miners are currently operating at a loss.
This imbalance represents a systemic risk: should key support levels fail sustainably, these marginal actors would be forced into mass capitulation, amplifying downside dynamics.
📊 Market Microstructure: Order Book Analysis (Heatmap)
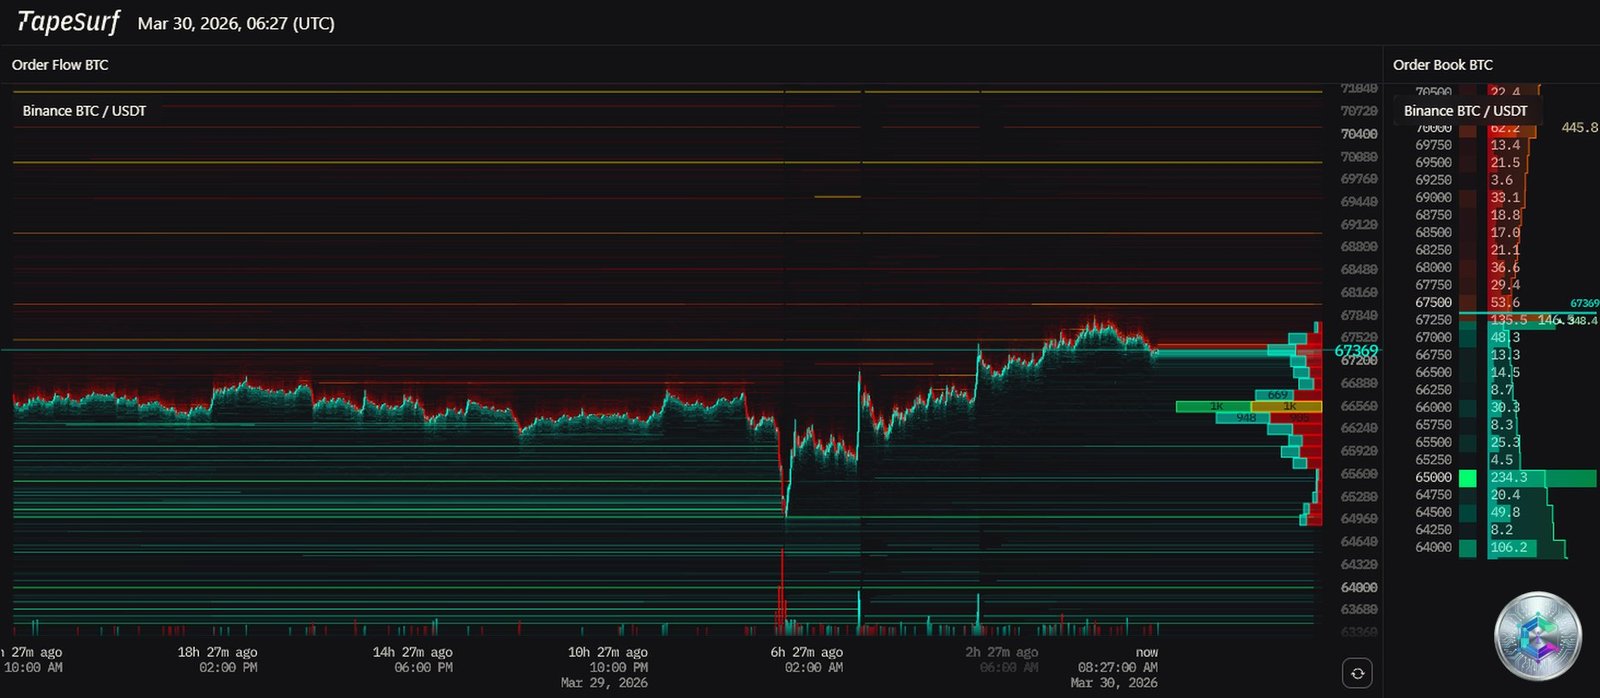
The heatmap analysis of the Binance BTC/USDT order book reveals a deeply asymmetric liquidity architecture. The most striking feature is the presence of massive bid walls positioned below price action:
- $65,000: Exceptionally thick liquidity layer — blocks of several hundred BTC (e.g., 234.3 BTC, 106.2 BTC) stacked in cascade, evidencing an institutional passive accumulation strategy (TWAP/VWAP algorithms).
- $68,000 – $70,000: Diffuse but persistent selling resistance. Significant limit sell orders block every recovery attempt.
- A liquidity void between current price and $70,000 suggests potentially rapid appreciation toward that level upon a bullish trigger.
The liquidation mechanics reinforce this reading: in March 2026, cascades of $279–$295 million in long liquidations repeatedly shook the market. Earlier in the month, a drop toward $62,000 triggered a historic liquidation event approaching $1.75 billion, wiping out over 274,000 overleveraged traders. Despite these violent swings, the 2-month futures premium stagnates at only 2% (vs. 4–8% in normal conditions), indicating that speculative euphoria has been flushed out.
📈 Multi-Timeframe Technical Analysis
Daily Chart (1D): The Death Cross Confirmed
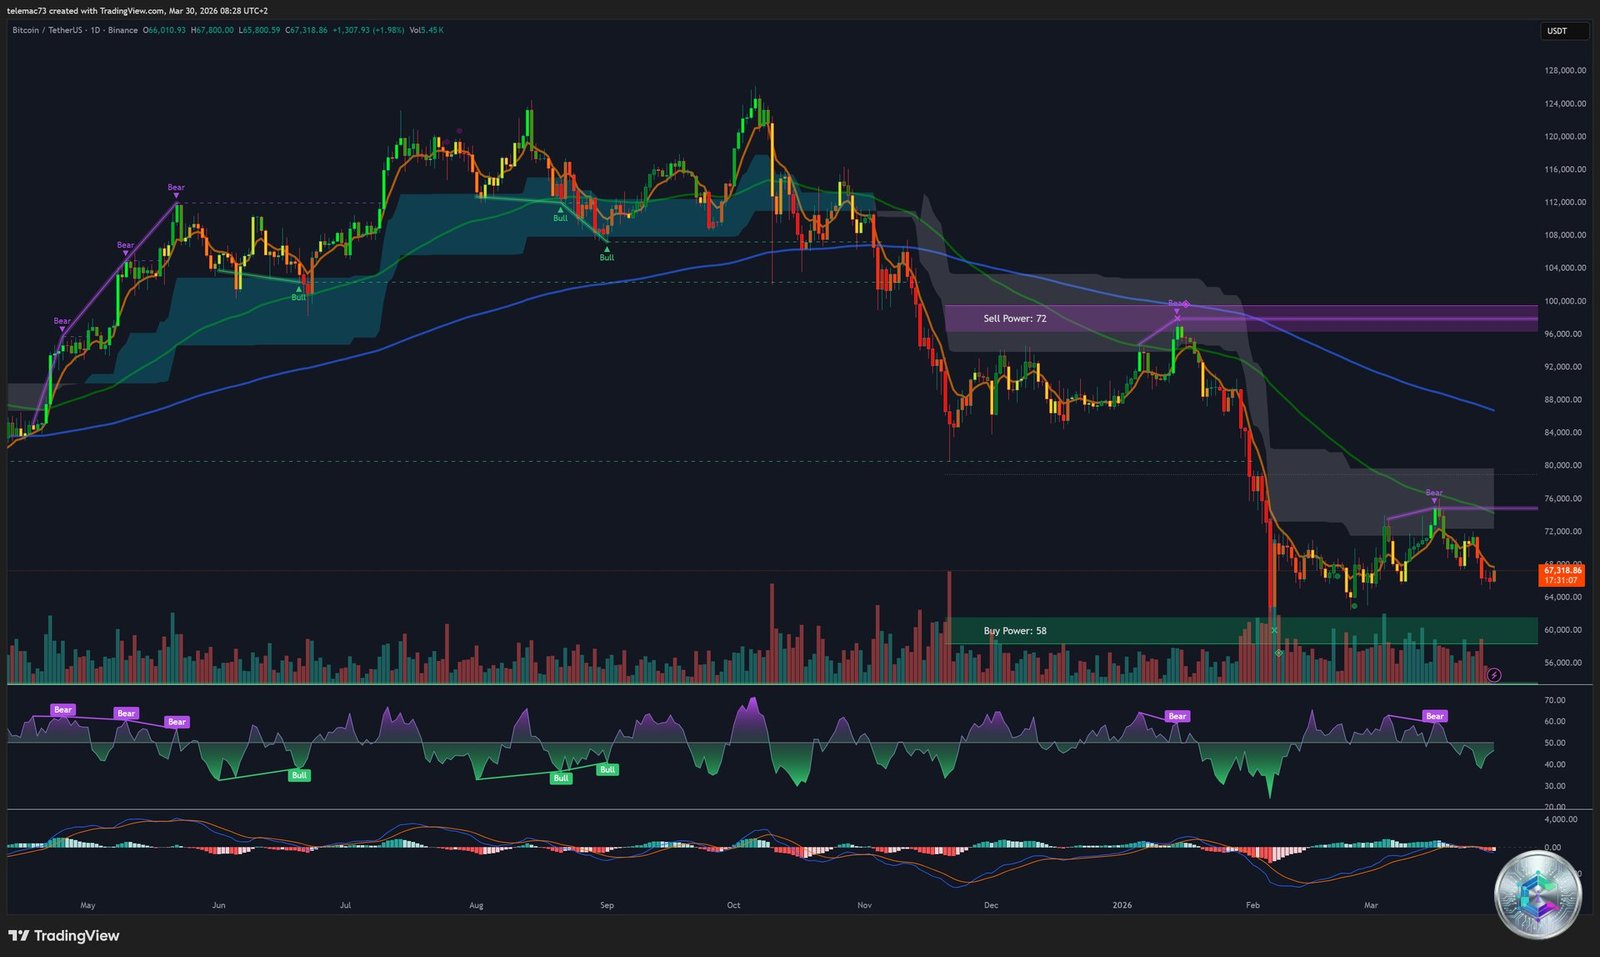
The daily chart reveals the market’s macroeconomic architecture. Bitcoin is entrenched in a massive descending channel from the 2025 ATH, characterized by a relentless sequence of lower highs and lower lows. The most consequential technical event: the confirmation of a « Death Cross » — the short-term moving average crossing decisively below the long-term moving average, which orbits around $85,000–$90,000.
An important nuance: the RSI is curving upward from deeply oversold territory (44–52), and the MACD, while still negative, shows a minor bullish crossover with an expanding green histogram — potentially foreshadowing a lateral consolidation and re-accumulation phase rather than a continued vertical decline.
4-Hour Chart (4H): Compression Triangle
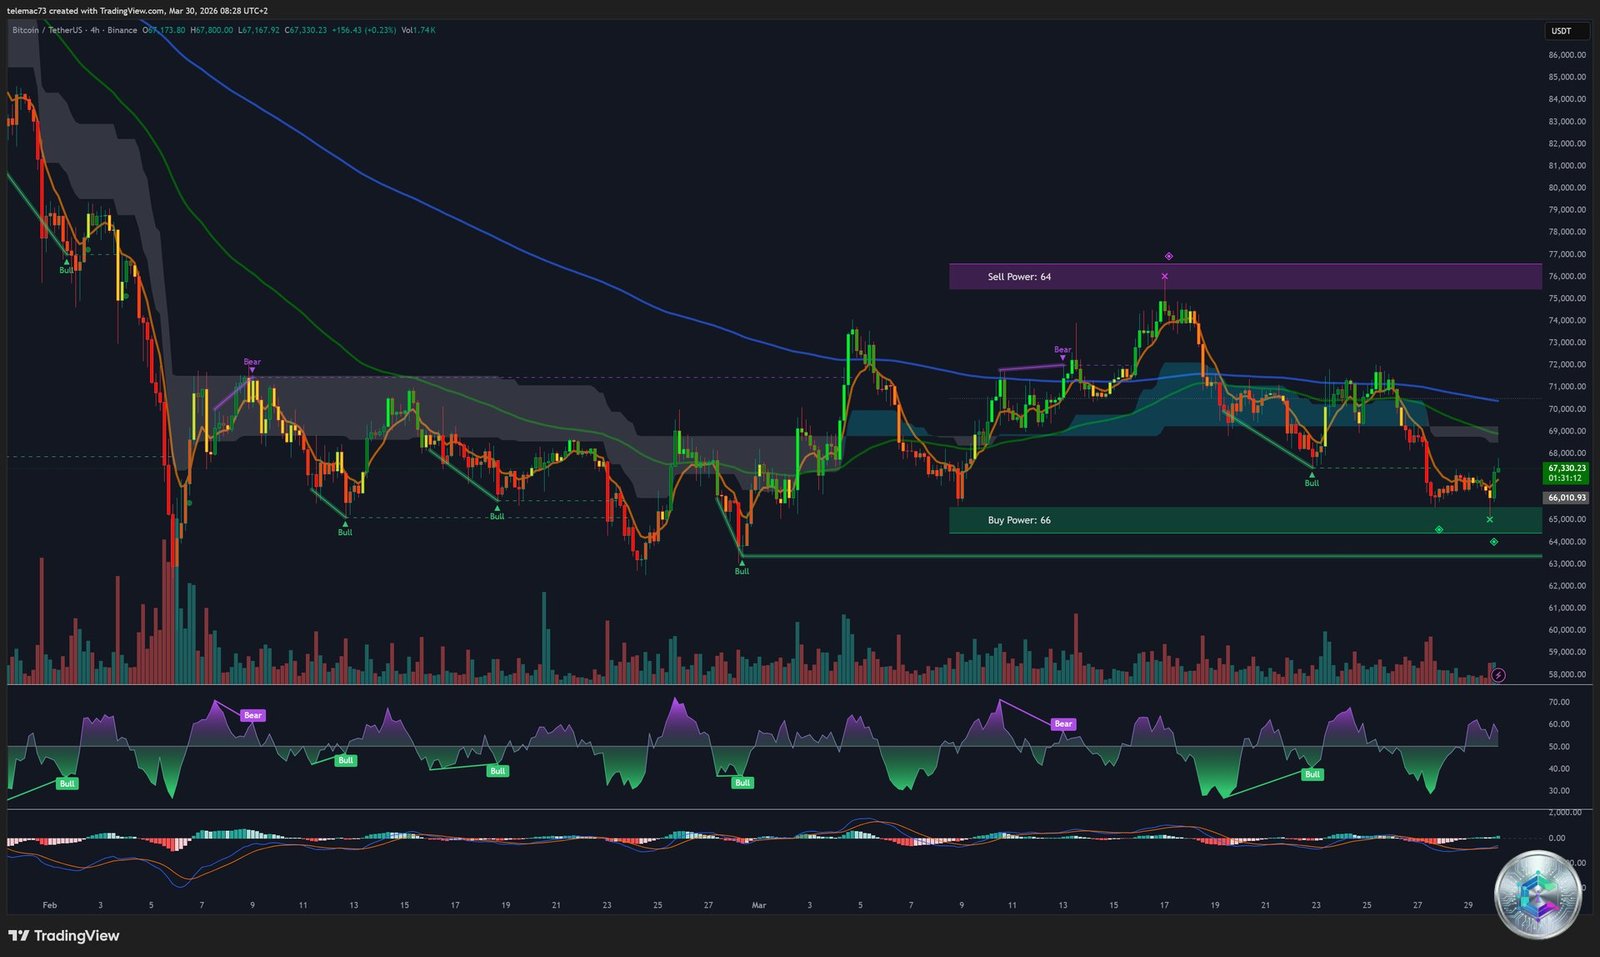
On the 4H chart, the internal consolidation mechanics become apparent. Price action is carving out a symmetrical compression triangle: sequentially lowered peaks capped by resistance around $69,000–$70,000, and floors supported by defensive buying. The balance of forces is more precarious here (Buy Power 66 vs. Sell Power 64).
Momentum indicators on this timeframe are significantly more constructive: the RSI traces ascending lows (potential hidden bullish divergence), and the MACD displays a Golden Cross below the zero line with a greening histogram. These elements support the thesis of an imminent test of the triangle’s upper boundary.
15-Minute Chart (15m): Bull Flag Forming
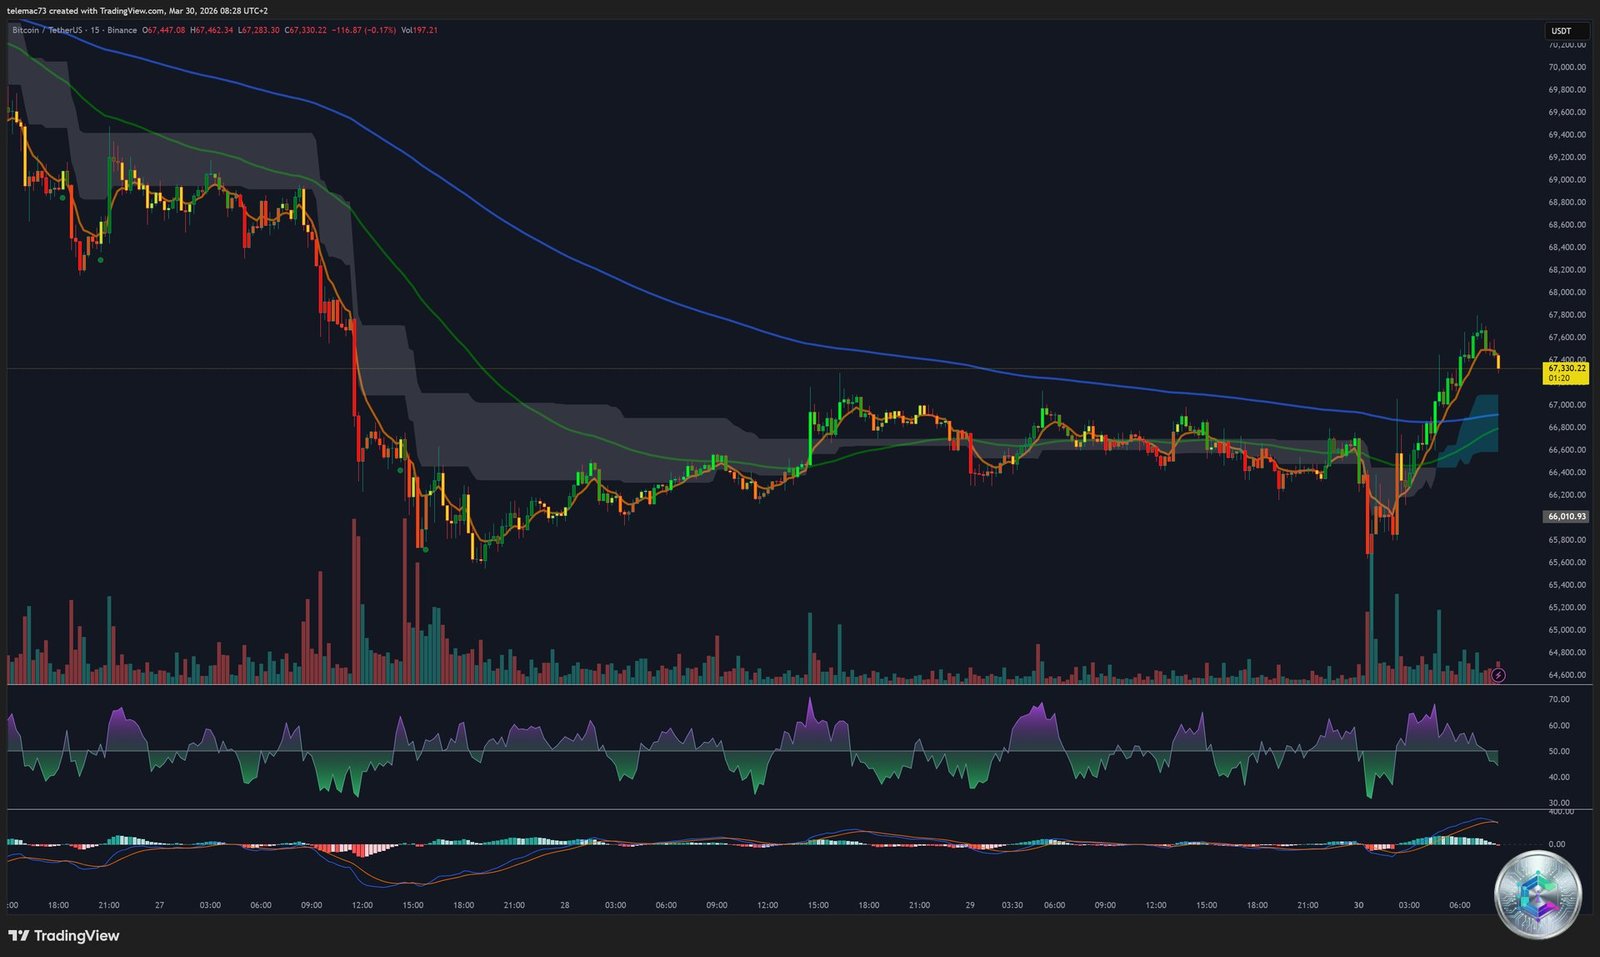
The 15-minute microstructure exposes the most recent dynamics with precision. A massive flush candle precipitated price toward $66,000, triggering a chain reaction of stop-losses and long liquidations. The market’s response was immediate and aggressive: a V-shaped bottom propelled price back to $67,330, accompanied by an intraday Golden Cross.
In the terminal portion of the chart, a classic Bull Flag is forming — a slight downward lateral consolidation following the vertical impulse (the flagpole). If this pattern resolves bullishly, the chartist projection targets a rapid test of $68,683–$70,000 resistance. The 15m RSI in overbought territory, however, suggests a brief pullback before any further extension.
🗺️ Strategic Key Level Mapping
| Category | Level (USD) | Relevance |
|---|---|---|
| 🔴 Critical Resistance 3 | $79,127 – $80,700 | Macro trendline – breakout = new Bull Run |
| 🔴 Macro Resistance 2 | $72,160 – $73,300 | Daily EMA 50 + institutional orders |
| 🟠 Intermediate Resistance 1 | $68,683 – $70,000 | Heatmap ask wall – first immediate structural obstacle |
| ⚪ Pivot Point | $67,419 – $67,452 | Fibonacci/Camarilla confluence – intraday equilibrium value |
| 🟢 Key Support S1 | $65,000 – $65,563 | Defensive EMA + massive bid wall – ETF waterline |
| 🟡 Critical Support S2 | $62,795 – $63,700 | Last bulwark before bearish acceleration |
| 🔵 Ultimate Macro Support | $57,000 – $60,800 | Absolute capitulation – miner breakeven threshold |
🔮 Two Probabilistic Scenarios for the Coming Weeks
✅ Bullish Scenario: Resilience and Breakout
Conditioned by confirmed geopolitical de-escalation and stabilizing bond yields, this scenario would see the $65,000 bid walls absorb all available supply. Technically, the 15m Bull Flag would resolve upward, attacking the 4H triangle’s upper boundary. A volume-confirmed breakout above $68,683, followed by acceptance beyond $70,000, would force a violent short squeeze. Initial target: $72,160 – $73,300.
❌ Bearish Scenario: Structural Capitulation
If U.S. inflation forces the Fed to maintain its hawkish stance, the daily Death Cross would exert its full gravitational pull. Progressive erosion of bid walls would lead to a daily close below $63,700, triggering an algorithmic chain reaction. Price would slide toward $60,800, with a severe extension risk toward the miner capitulation level at $57,000.
The Fear & Greed Index reading of 12/100 (Extreme Fear) supports a contrarian approach: historically, such psychological readings precede powerful relief rallies.
Conclusion
Bitcoin’s current market architecture reflects an unprecedented institutional transition phase. Caught between phenomenal accumulation by ETF issuers and a suffocating macroeconomic environment, the short-term directional outcome remains in suspense. The upcoming weekly closes and U.S. macroeconomic publications will be decisive in charting the secular trajectory of this emerging monetary asset class.
⚠️ Disclaimer: This article is written strictly for educational and informational purposes. It does not constitute investment advice, nor a recommendation to buy or sell any financial or digital asset. Cryptocurrency markets are extremely volatile and carry significant risk of capital loss. Please consult a qualified financial advisor before making any investment decision.