
Introduction: A Market at a Critical Crossroads
The digital asset ecosystem is navigating a critical transition period at the start of Q2 2026. After reaching a breathtaking all-time high near $126,000 in October 2025, Bitcoin (BTC) has undergone a severe structural correction, wiping out nearly half its value and stabilizing within a complex trading range between $60,000 and $74,000.
In early April 2026, the price hovers around $66,000 to $68,800 — a valuation reflecting palpable tension between relief rally attempts and systemic selling pressure. This dynamic is not accidental; it results from a confluence of factors where derivatives market mechanics, ETF flows, and exogenous shocks intertwine to dictate the asset’s trajectory.
Bitcoin’s growing maturity as an institutional asset class has fundamentally altered its microstructure. Far from the historical narrative of an uncorrelated « digital gold, » recent price action demonstrates that BTC now behaves as a high-beta risk asset, absorbing the same macroeconomic shocks that batter equity markets.
⚡ The Macroeconomic Environment: The April 2 Geopolitical Shock
The macroeconomic landscape of April 2026 is dominated by a brutal resurgence of geopolitical tensions around the US-Iran conflict. On April 2, global financial markets were violently shaken by President Trump’s speech asserting that American forces would strike Iran « extremely hard » within the next two to three weeks.
The absence of any ceasefire timeline and uncertainty surrounding the Strait of Hormuz — through which approximately 20% of global oil supply transits — instantly evaporated risk appetite worldwide.
📉 Asian Market Reaction
- Nikkei: -1.9%
- Kospi (South Korea): -3.6%
- Sensex (India): -1,500 points
🛢️ Oil Price Explosion
- Brent: +5%, above $106/barrel
- WTI: above $104/barrel
- BTC: -3%, toward $66,000
The Federal Reserve currently maintains rates in a restrictive range of 3.50%–3.75%. The probability of an April rate cut has collapsed to just 10.9% (from 21% a few weeks earlier), according to CME FedWatch data. The 10-year US Treasury yield jumped to 4.38% and the DXY index surpassed 100 — all representing powerful headwinds for a non-yield-bearing asset like Bitcoin.
🌡️ Market Microstructure: The Liquidation Heatmap
To anticipate Bitcoin’s next directional moves, the liquidation heatmap is an analytical tool of unparalleled power. It acts as an X-ray of speculator psychology, revealing the precise zones where leveraged positions are concentrated and where the system is programmed to trigger automatic liquidations.
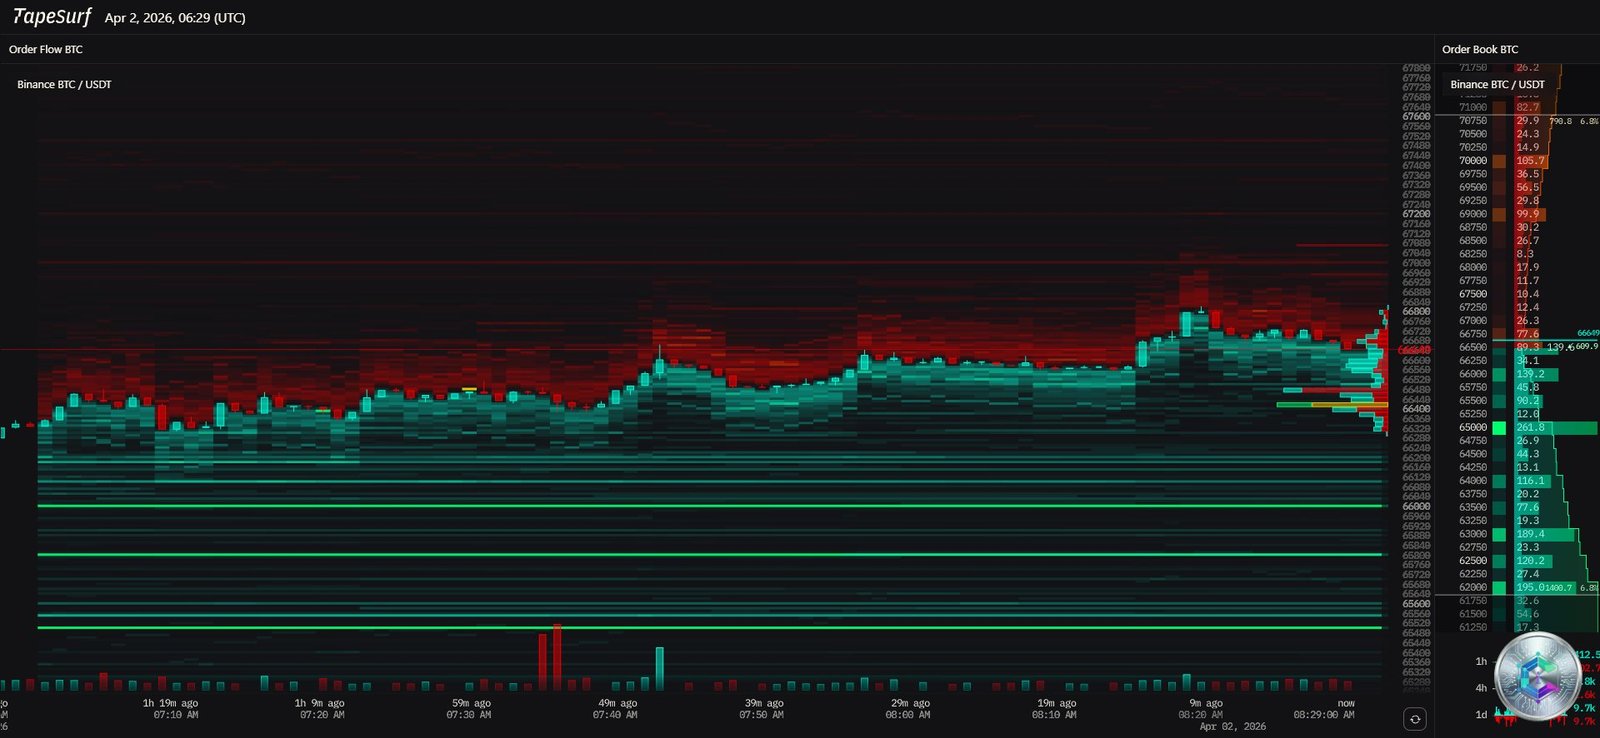
The heatmap reveals a fascinating and perilous asymmetry in risk distribution. A massive wall of short position liquidations sits above the current price, forming a dense cluster around the $71,800 zone. Many retail traders, convinced BTC could not break through the $70,000 resistance against macroeconomic headwinds, accumulated short positions with excessive leverage (sometimes 50x or 100x).
If the price were to break through $71,000, the automatic liquidation of these short positions would trigger an explosive chain reaction — a short squeeze — estimated at over $1.2 billion. Even larger liquidity pools are estimated toward the $93,500 zone.
However, past a potential sweep to $75,000, liquidation density evaporates considerably. Without organic buyers in the spot market, such a move would remain ephemeral. On the bearish side, support zones lie around $65,000, then deeper toward $60,000 — the ultimate line of defense.
📊 Long-Term Chart Analysis: The Daily Timeframe
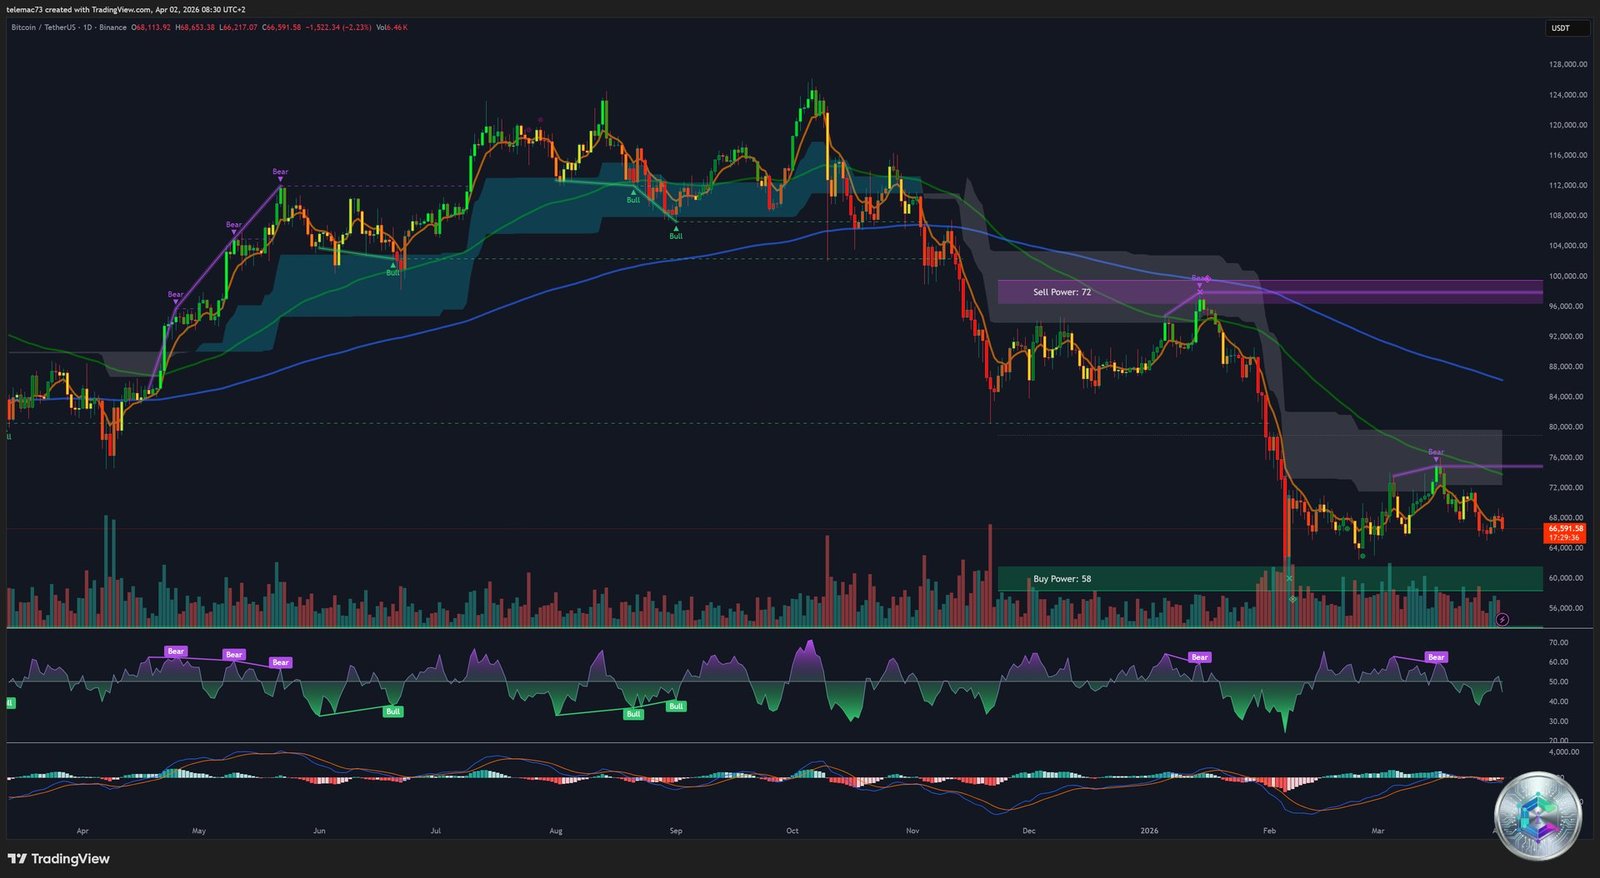
The long-term perspective reveals a systematic deterioration of the bullish structure since the all-time high of $126,186. The asset has entered a prolonged distribution phase marked by a series of lower highs and lower lows — the paradigmatic definition of a downtrend.
☠️ The Death Cross Confirmed
The most consequential technical event is the confirmation of the Death Cross: the 50-day SMA has crossed below the 200-day SMA. The latter now navigates well above price action, in the $85,000–$90,000 zone, while the current price struggles around $66,000–$68,000.
The most critical resistance level is identified at $69,171 — the 0.236 Fibonacci retracement measured from the October 2025 peak to the correction lows. Every rebound attempt since the February 2026 crash has been smothered by this glass ceiling.
🔍 Oscillator Signals (Daily)
- RSI (14): 43–45 — neutral-to-bearish zone, no buying conviction
- MACD: firmly in negative territory, below zero line, no meaningful bullish crossover
- Institutional Sell Zone: $96,000–$100,000 (major resistance)
- Institutional Buy Zone: $60,000 (ultimate line of defense)
📈 Medium-Term Analysis: The 4-Hour Timeframe
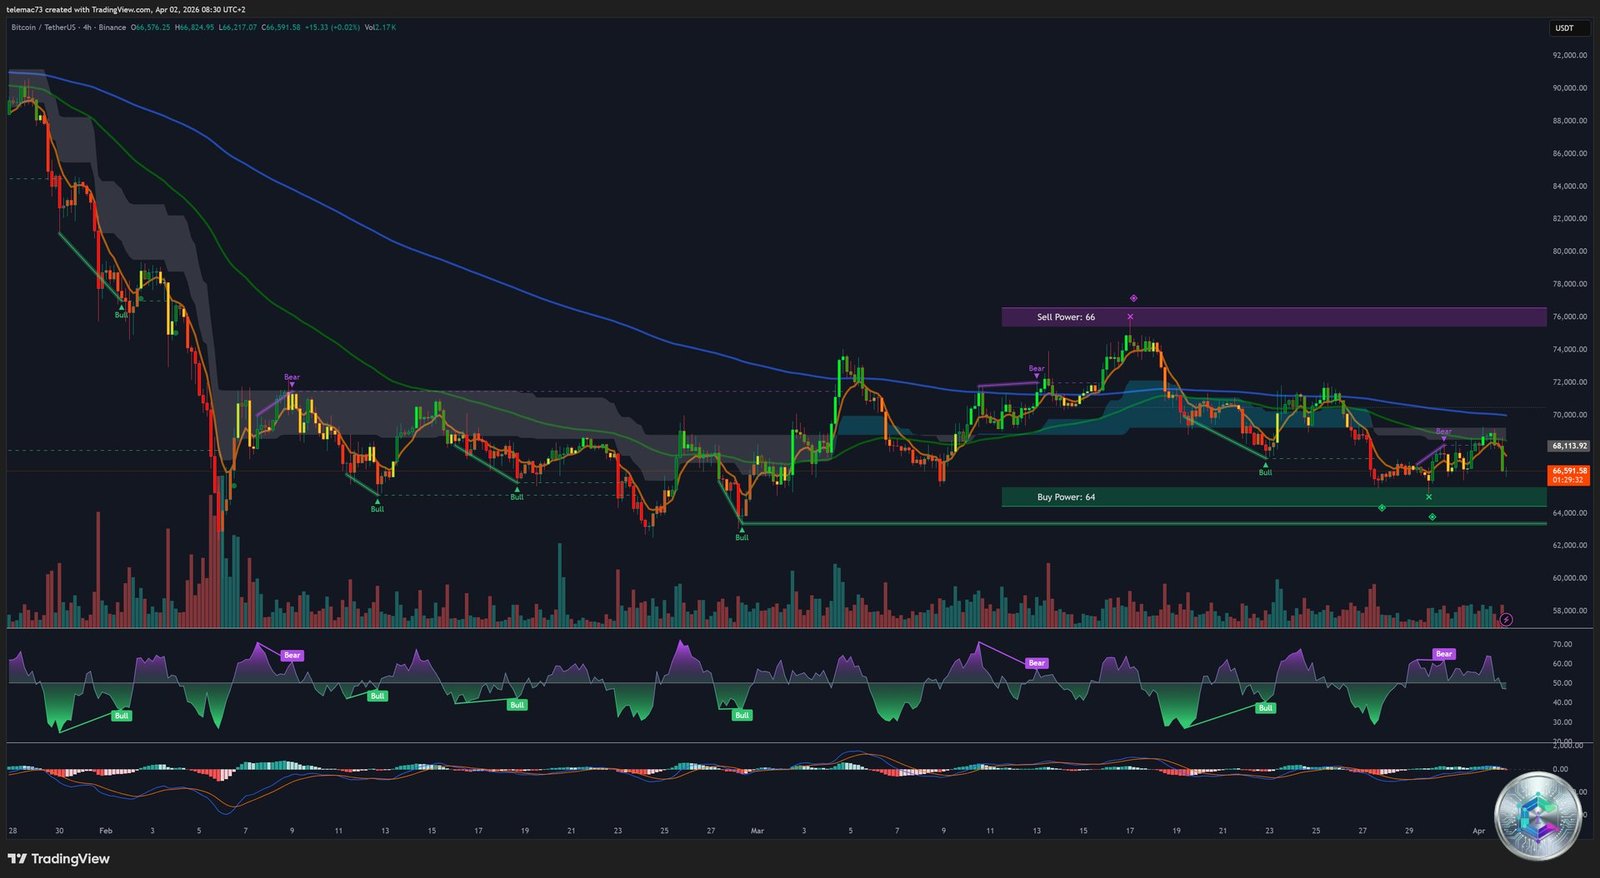
On the 4H chart, the most striking development is the recurring formation of Bear Flags. This classic continuation pattern is characterized by an initial sharp drop (the flagpole), followed by a narrow, slightly ascending consolidation channel — a false sense of security before the next bearish leg lower.
The breakdown trigger to watch sits around $63,000–$65,000. In classical technical analysis, a Bear Flag breakdown projects a new decline roughly equal to the initial flagpole’s height, adding significant probabilistic weight to a test of the $60,000 floor.
Two antagonistic zones structure the market on this timeframe:
- 🔴 Resistance Zone (Sell Power): $74,000–$76,000 — former April 2025 lows now acting as resistance by polarity
- 🟢 Support Zone (Buy Power): $64,000 — fragile springboard where algorithmic buy orders attempt to stem the decline
⚡ Short-Term Microstructure: The 15-Minute Chart
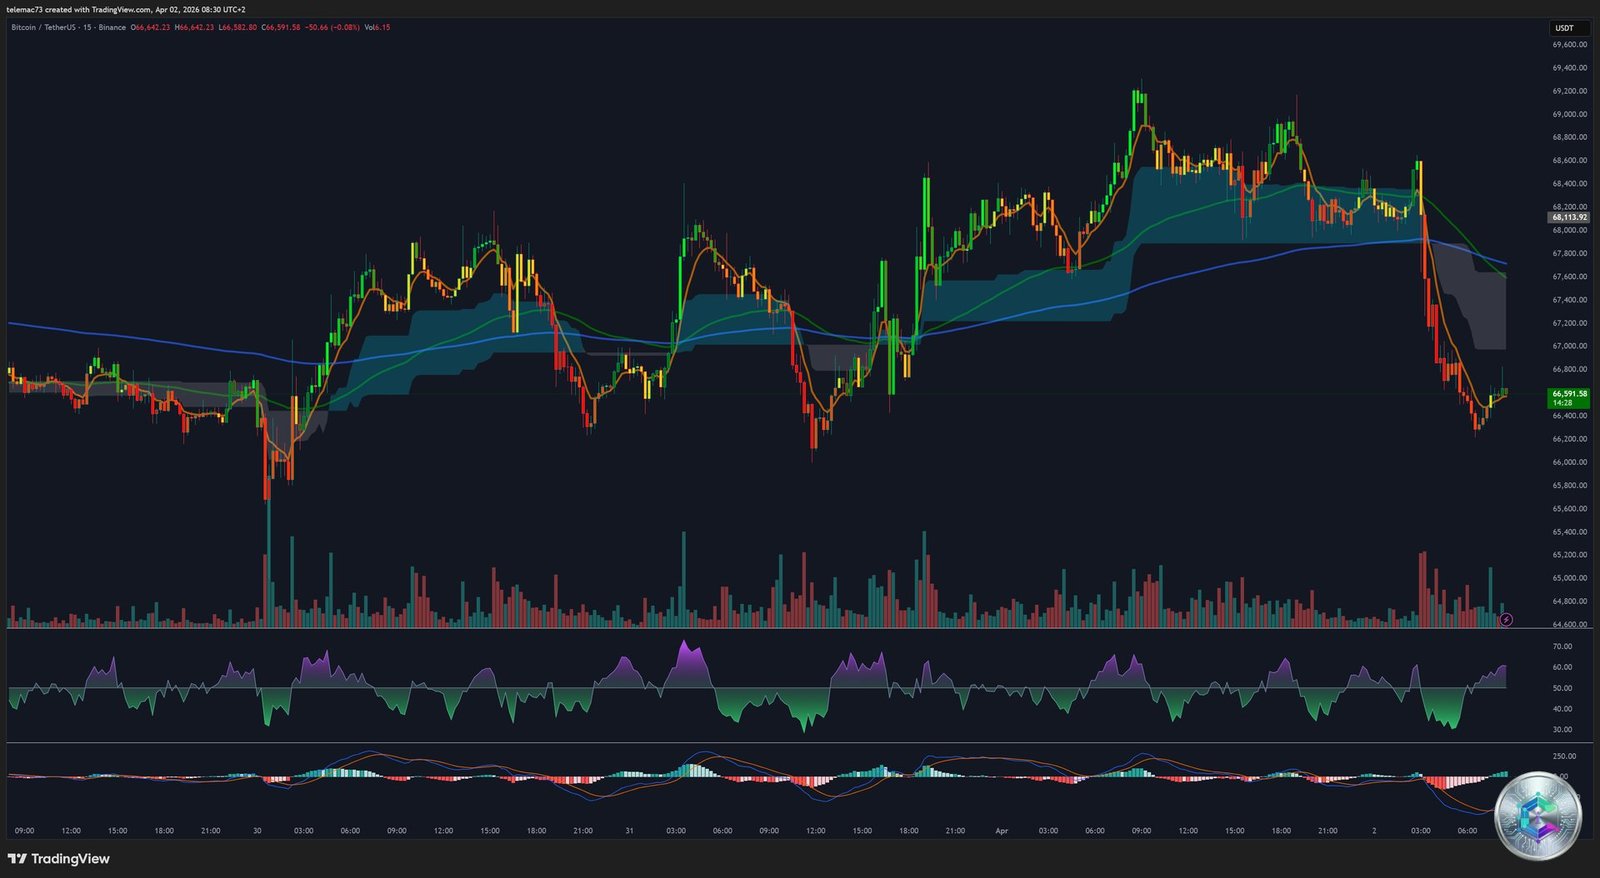
The 15-minute chart perfectly illustrates the violence of the market’s reaction to the presidential speech on April 2. Massive bearish engulfing candles with long lower wicks evidence aggressive liquidity hunting: selling algorithms instantly swept the stop-losses of overleveraged long positions, crashing BTC toward $66,000 within minutes.
The RSI plunged deep into oversold territory (below 30) during the panic peak, before mechanically bouncing toward 40–45 — without a proportional price recovery. This type of intraday bearish divergence indicates that selling pressure is only temporarily suspended, not genuinely absorbed.
📐 Quantitative Levels: Pivot Points and Moving Averages
Based on a reference valuation of approximately $68,454, here is the synthesized pivot point matrix for BTC/USD:
| Method | S2 | S1 | Pivot (P) | R1 | R2 |
|---|---|---|---|---|---|
| Classic | $67,862 | $68,230 | $68,434 | $68,802 | $69,007 |
| Fibonacci | $68,080 | $68,215 | $68,434 | $68,653 | $68,788 |
| Camarilla | $68,493 | $68,546 | $68,434 | $68,651 | $68,703 |
| Woodie | $67,903 | $68,312 | $68,475 | $68,884 | $69,048 |
Primary resistance converges strikingly around the $69,000–$69,171 zone — the confluence of the 0.236 Fibonacci retracement, the Fibonacci daily R2, and the approaching 50-day SMA. Until Bitcoin achieves a decisive daily close above this cluster, any upward move remains a simple dead cat bounce.
The ensemble of daily moving averages (MA5 through MA200) generates an overwhelmingly bearish sell signal, positioned above price action and exerting constant downward pressure.
🏦 The Bitcoin Spot ETF Paradox
The flow dynamics of US spot Bitcoin ETFs present a profound analytical paradox. The euphoria surrounding $70 billion in absorption during 2024–2025 has given way to a far more unforgiving market reality.
Q1 2026 was marked by a prolonged hemorrhage of assets under management:
- November 2025: -$3.5 billion (all-time record liquidations)
- December 2025: -$1.1 billion
- January 2026: -$1.6 billion
- February 2026: -$206 million
March 2026 offered a glimmer of hope with +$1.32 billion in net inflows — the majority captured by BlackRock’s iShares Bitcoin Trust (IBIT). However, the week ending March 27 again registered net outflows of $296 million, highlighting the fragility of this rebound. Overall, Q1 2026 closes with ~$500 million in net global outflows.
The most alarming finding: the vast majority of cumulative net inflows since 2024 was deployed while BTC traded between $80,000 and $126,000. These institutional investors are now massively « underwater », creating a supply overhang that will structurally cap any bullish momentum toward the $80,000 zone.
On-chain data confirms this fragility: the Exchange Whale Ratio surged from 0.34 in January to 0.79 by end of March 2026, signaling that major holders are moving their assets to exchanges — consistent with preparation for mass distribution, not silent accumulation.
🔭 Structural Outlook and Upcoming Catalysts
Bitcoin has become a flow-driven macroeconomic asset, whose valuation is fundamentally determined by ETFs’ ability to channel global liquidity rather than by halving cycles. In this new paradigm, the value equation depends on the friction between democratization of access (US 401k plans) and the tyranny of real interest rates dictated by the Fed.
Two structural catalysts deserve close attention:
- 📜 CLARITY Act: a landmark US regulatory framework with estimated 80–90% signing probability in early April. This legislation would remove the last legal uncertainty paralyzing the most conservative institutional players (sovereign wealth funds, university endowments).
- 🔗 Real-World Asset Tokenization (RWA): the movement continues accelerating, inexorably connecting blockchain to traditional settlement rails and solidifying the foundations of Bitcoin’s broader financial utility.
🎯 Strategic Synthesis: Key Levels to Watch
| Zone | Price | Significance |
|---|---|---|
| 🔴 Critical Resistance | $69,171 | Fibonacci 0.236 + Daily R2 + SMA50 — unbreakable wall until a decisive daily close above |
| 🔴 Distribution Ceiling | $74,000–$75,000 | Top of 2025 range, institutional Sell Power |
| 🟡 Potential Short Squeeze | $71,800 | Massive short position cluster (~$1.2B) |
| 🟢 Intermediate Support | $64,000–$65,000 | Algorithmic Buy Power, Bear Flag trigger |
| 🔵 Bulls’ Last Stand | $60,000–$62,000 | 200-week SMA ~$59,400 — breach = plunge toward $50,000 |
The technical consensus drawn from the multi-timeframe analysis is decisively cautious. The Death Cross on the daily, recurring Bear Flags on 4H, and repeated RSI rejections at each rebound paint a market structurally under pressure. The sole short-term alternative scenario — a short squeeze toward $71,800 — would remain ephemeral without organic demand in the spot market.
Strategic focus remains inexorably fixed on the defense of the $60,000 threshold. Its breach would irrevocably validate the thesis of a persistent digital asset winter.
Conclusion
April 2026’s Bitcoin is torn between destructive macroeconomic forces and a complex structural transition. The asset failed to capitalize on its theoretical safe-haven status during the US-Iran military escalation. Rising oil prices and the specter of rekindled inflation have annihilated hopes for monetary easing, transforming BTC into a highly correlated risk-off adjustment variable alongside technology equities.
Nevertheless, institutional foundations continue to solidify beneath the surface. The path to a new bull market exists — but it necessarily runs through healthy consolidation, a reset of leverage excesses, and ideally a de-escalation of the geopolitical tensions currently dictating short-term volatility.
⚠️ Important Disclaimer
This article is written exclusively for educational and informational purposes. It does not constitute investment advice or a recommendation to buy or sell cryptocurrencies or any other financial asset. Cryptocurrency markets are extremely volatile and carry a high risk of capital loss. Please consult a qualified financial advisor before making any investment decision.