
Bitcoin is going through one of the most violent episodes of its recent history at the start of Q3 2026. After peaking near $126,000 in October 2025, the leading cryptocurrency saw nearly half of its valuation wiped out, before staging a spectacular rebound above $62,000 on the back of an unexpected macroeconomic shock. Between a liquidation purge, a short squeeze, and the return of institutional flows, here is a full breakdown of a market standing at a crossroads.

The macro shock that changed everything
Bitcoin’s behavior cannot be analyzed in isolation: the asset acts first and foremost as a derivative of global liquidity and expectations around US monetary policy. On July 2, 2026, the Bureau of Labor Statistics released a Non-Farm Payrolls (NFP) report that came in far below expectations: only 57,000 jobs created versus a consensus of 113,000, alongside a downward revision of 74,000 jobs for April and May.
This sudden deterioration in the labor market immediately reshuffled expectations around the Federal Reserve’s rate path under Chair Kevin Warsh. The probability of a September rate hike, previously priced at around 65%, dropped to near 50%, while the probability of any tightening by year-end fell below 80%.
| Macro indicator | Market expectation | Actual (June 2026) | Impact |
|---|---|---|---|
| Non-Farm Payrolls | 113,000 | 57,000 | Sharp reduction in wage pressure |
| Probability of hike (Sept.) | ~65% | ~50% | Easing of hawkish rhetoric |
| Dollar Index (DXY) | Uptrend | Bearish breakdown | Favorable for risk assets |
Riding this prospect of cheaper liquidity ahead, Bitcoin — long regarded as a hedge against currency debasement — reacted with remarkable elasticity, surging 7.3% in under 48 hours, pulling itself off its local floor of $57,750 to test resistance at $62,000.
A US regulatory backdrop that is loosening up
Market sentiment was also supported by several political signals. President Donald Trump voiced support for major tax relief, arguing that Bitcoin should no longer be subject to capital gains tax when used as everyday payment. Meanwhile, the SEC acknowledged past missteps in approving crypto derivative products and now promises a more « neutral » approach toward new ETFs, even though the « CLARITY Act » remains stalled in the Senate.
Institutional flows: Spot ETFs roar back
For much of June, the market suffered an unprecedented institutional capital exodus, with cumulative net outflows reaching $4.5 billion from US Bitcoin Spot ETFs. On July 3, the trend violently reversed: after ten consecutive days of outflows, the ETFs recorded a net inflow of $221.7 million in a single session — the largest capital inflow since early May.
| Fund (issuer) | Daily net flow (July 3, 2026) | Implication |
|---|---|---|
| ARKB (Ark & 21Shares) | +$91.84 million | Aggressive institutional buying on support |
| FBTC (Fidelity) | ~+$165.00 million | Validates the $60k zone as accumulation |
| Global total (net) | +$221.7 million | Reversal of institutional flow trend |
This reversal suggests large capital pools view the drop below $60,000 as a cyclical discount rather than the start of a prolonged bear market. Consensus remains divided, however: Citigroup cut its twelve-month target from $112,000 to $82,000, while Japanese firm Metaplanet kept accumulating, pushing its treasury to 43,000 BTC.
Heatmap and liquidations: the hidden mechanics of the rebound
Looking at the order-book liquidation heatmap reveals the predatory mechanics behind recent price swings. Heavily financialized through leveraged perpetual futures, the market often moves by « hunting » the zones where margin calls concentrate.
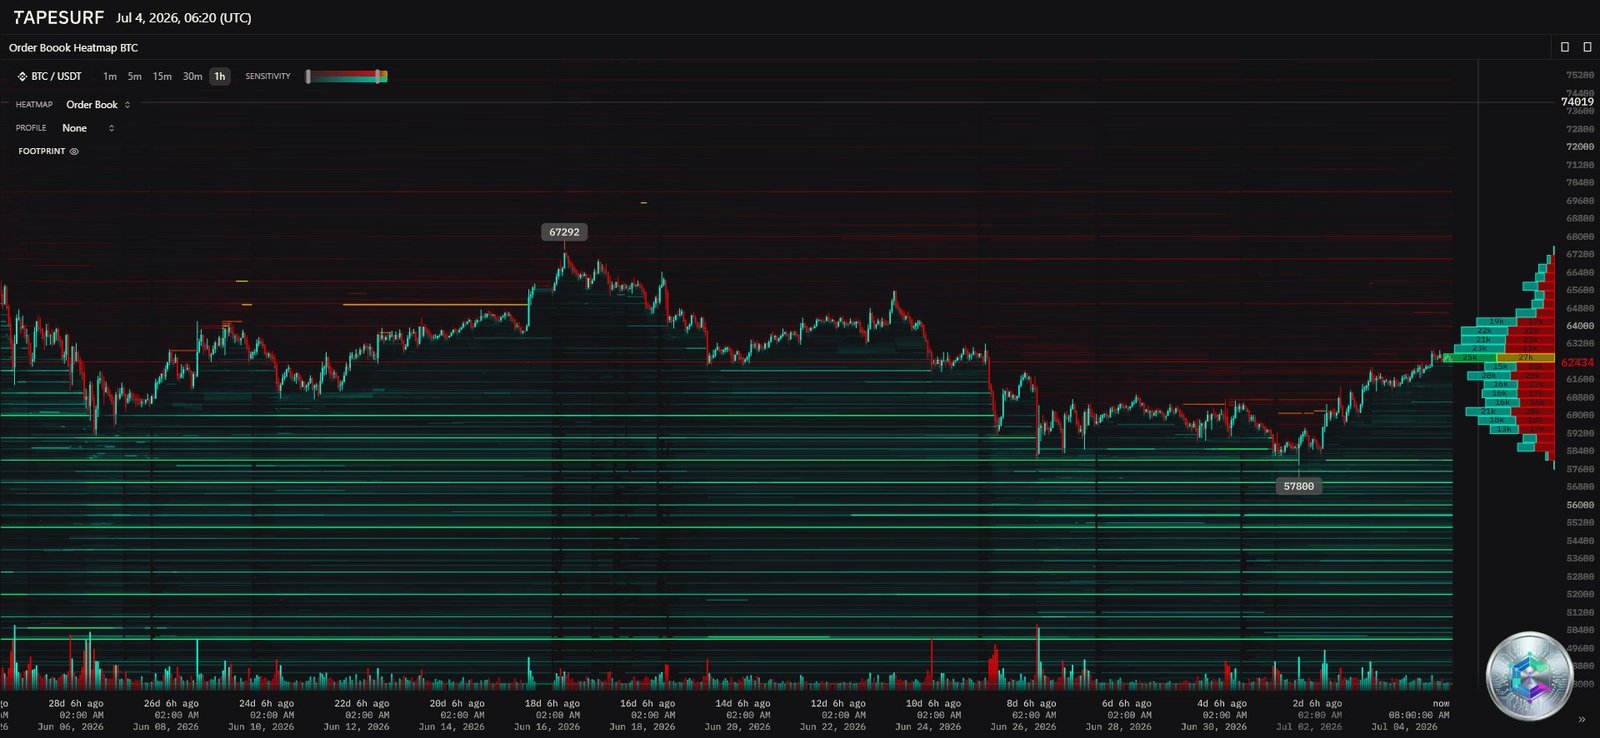
The breakdown below $60,000 triggered a « short gamma » risk: delta-neutral market makers were forced to sell the underlying asset aggressively to stay hedged, accelerating the drop down to a local low of $57,737. This spiral wiped out an estimated $1.16–1.57 billion in over-leveraged long positions across the crypto market, with more than $833 million in liquidations on Bitcoin alone.
Conversely, the jobs report caught short sellers off guard: forced to rush and cover their positions, they propelled the price from $57,750 to above $62,000, liquidating between $281 and $450 million in bearish bets in under 24 hours.
| Price level | Liquidity type | Significance |
|---|---|---|
| $67,645 | Short liquidations | ~$2.26B — major magnet zone above $63,800 |
| $64,500 – $65,000 | Intermediate short liquidations | First line of defense for late sellers |
| $57,000 – $60,500 | Neutral consolidation zone | High density of recent positions, erratic volatility |
| $56,000 – $57,000 | Long liquidations | Bearish liquidity wall, risk of drop to $53,000 |
The asymmetry in the heatmap is striking: available liquidity to the upside (over $2 billion around $67,645) far exceeds immediate downside liquidity, giving the market a statistically bullish short-term bias as long as price holds above $60,000.
Multi-timeframe chart reading
Daily chart: the battle of moving averages
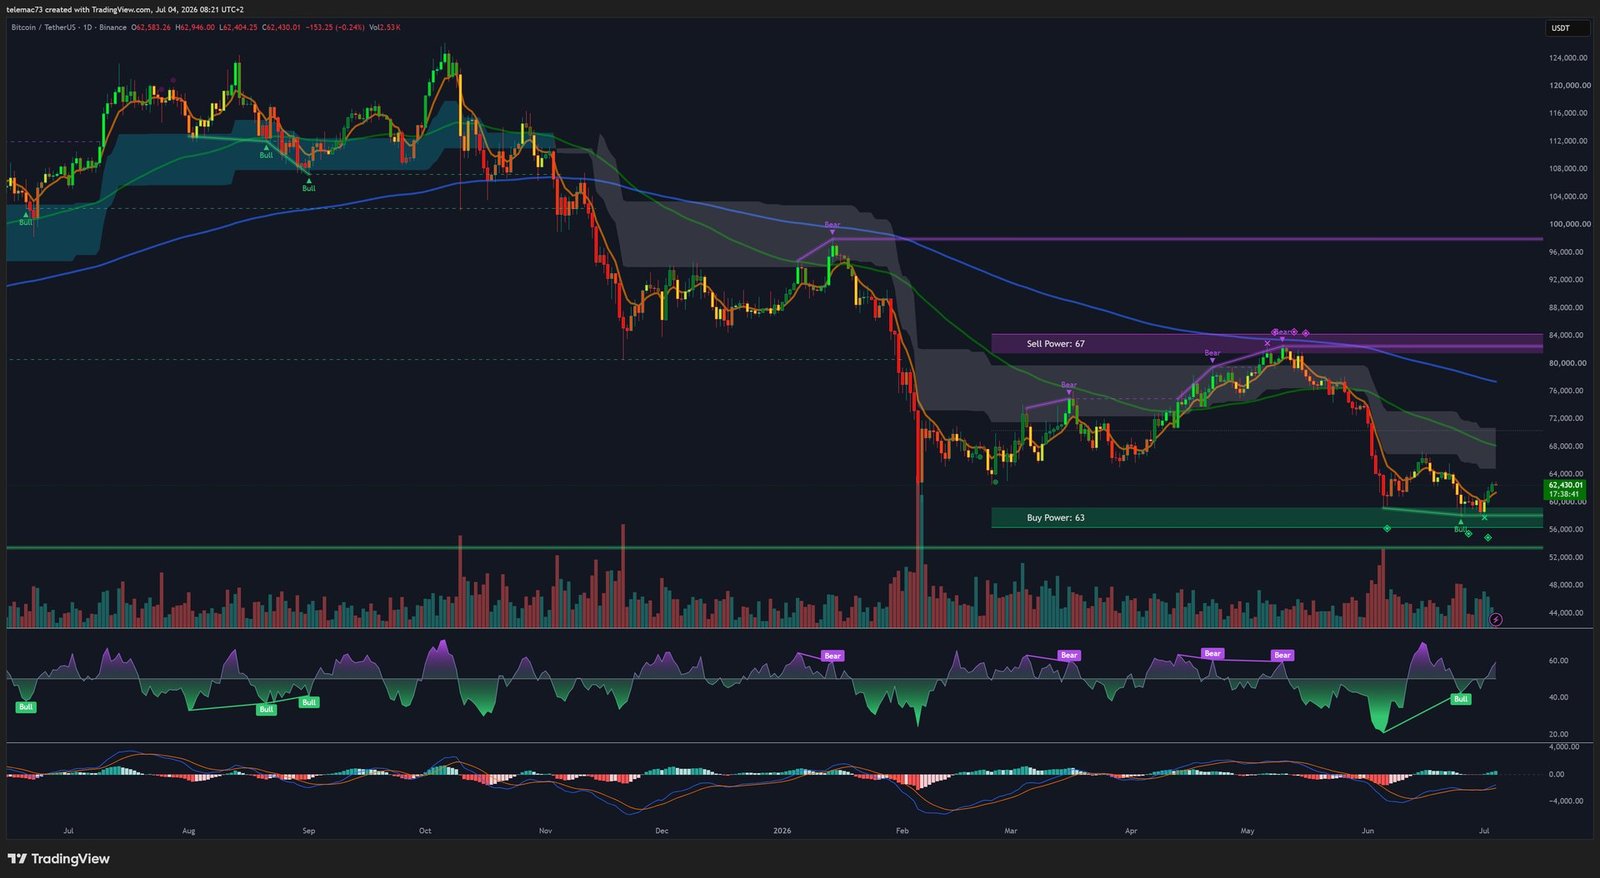
June’s drop severely damaged the macro bullish structure: Bitcoin broke below its 50-day EMA ($66,015) and its 200-day EMA (around $77,159), keeping the threat of a « Death Cross » alive. The recent short squeeze, however, allowed BTC to reclaim its short-term moving averages (MA5 at $60,396, MA10 at $60,246), with the next challenge being to force a short-term golden cross and use it as a springboard toward the 50-day EMA.
On momentum, the daily RSI printed a higher low than price at the $57,737 trough — a classic bullish divergence signaling that selling pressure was already fading before the price reversal. RSI has since recovered toward neutral territory (46-49), leaving comfortable room before overbought levels. MACD, meanwhile, shows a narrowing bearish histogram and a MACD line holding above its signal line, suggesting a sturdier technical foundation than a simple « dead cat bounce. »
4-hour chart: triple bottom and compression triangle
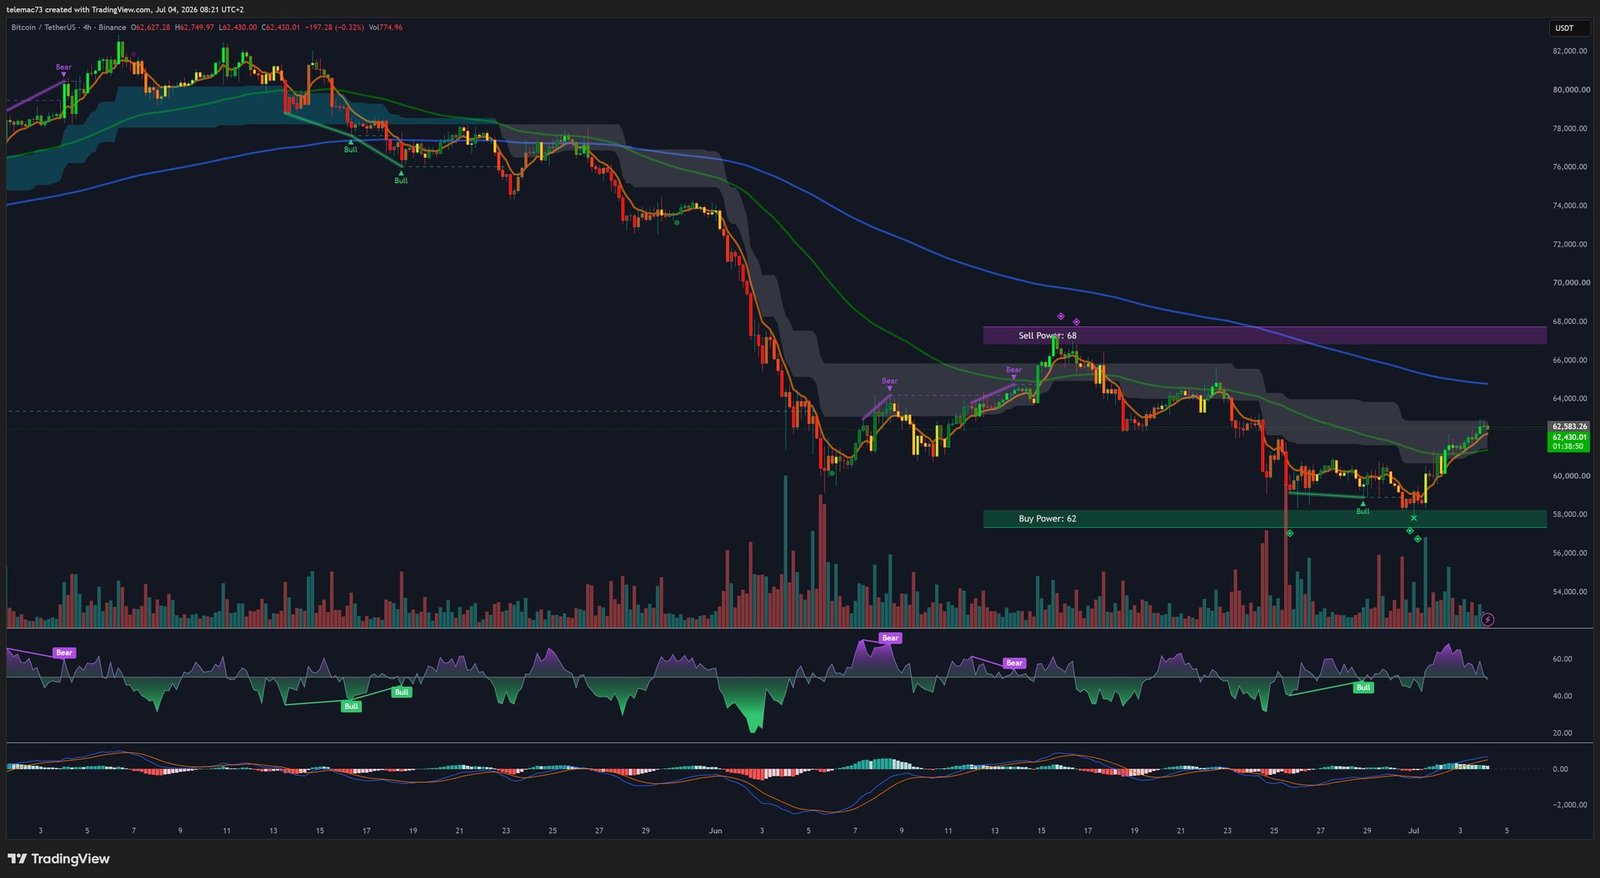
The H4 chart shows a triple bottom forming around the psychological $60,000 level: on three separate occasions, heavy institutional limit-buy volume absorbed selling pressure, preventing any meaningful close below support. Final confirmation of this pattern requires a clean break of the neckline, located between $62,000 and $63,800. Since the July 2 rebound, price has also been coiling inside an asymmetric compression triangle between $60,000 and $62,000, whose breakout will act as the directional trigger for the next impulsive move. The H4 MACD also shows a bullish divergence and a forming golden cross.
15-minute chart: the falling wedge breakout
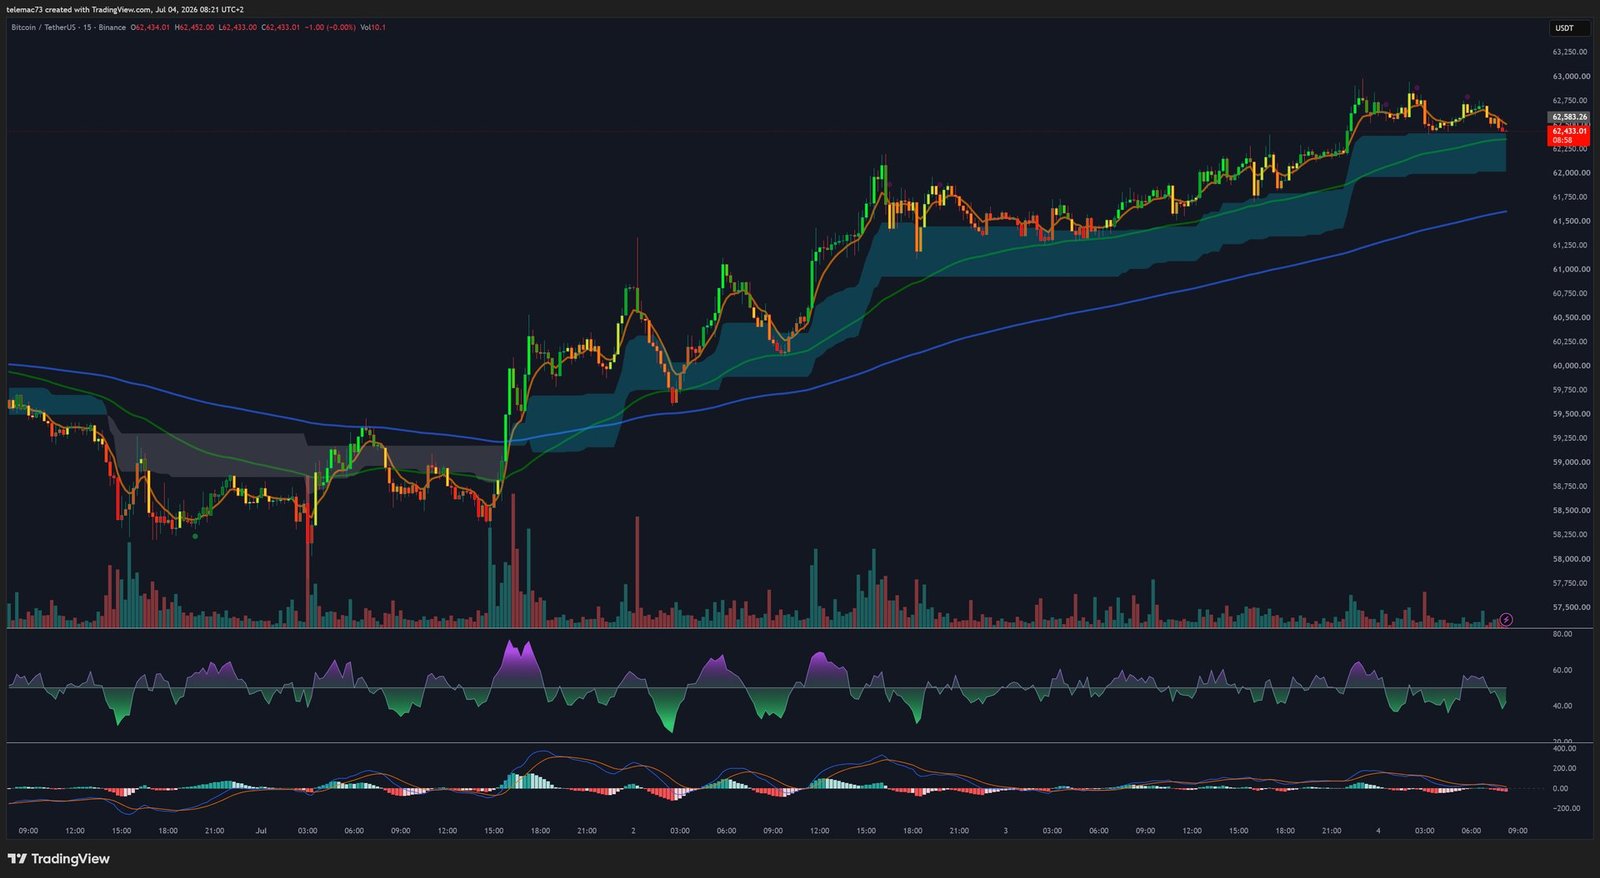
On the M15 timeframe, the grinding action near the $57,000 floor had formed a falling wedge — a classic sign of seller exhaustion. The NFP release acted as the catalyst for a bullish breakout of that wedge, backed by a volume spike confirmed by short liquidations. Since then, a succession of golden crosses among the short-term moving averages (MA20/MA50/MA100) has emerged, now acting as stacked dynamic support, with the advance temporarily capped by resistance around $62,117.
Key strategic levels
| Classification | Level (USD) | Technical rationale |
|---|---|---|
| Macro resistance | $77,159 | 200-day EMA — the line separating correction from a fully bullish market |
| Magnet zone | $67,645 | Largest short liquidation cluster ($2.26B) |
| Intermediate resistance | $66,015 | 50-day EMA |
| H4 breakout target | $63,879 | Fibonacci extension of the triple bottom |
| Psychological pivot | $62,000 – $62,444 | 200-week MA — the quarter’s demarcation line |
| Base support | $61,000 | Former resistance turned support after the squeeze |
| Structural support | $60,000 | Base of the H4 triple bottom |
| Retracement support | $57,900 – $58,011 | Fibonacci — seller-exhaustion low |
| Danger zone | $56,000 | Long liquidation wall |
| Ultimate support | $52,000 – $53,000 | Realized Price — network average cost basis |
Correlation with altcoins and the AI sector
Ethereum showed superior technical resilience, defending the $1,577 zone before rebounding nearly 10% and anchoring above $1,700, despite Citigroup slashing its price target. Solana followed a similar pattern, climbing back toward $80-82 after dipping below $70. These correlated rebounds confirm a systemic return of liquidity into risk assets rather than an isolated Bitcoin move.
AI-linked cryptocurrencies, on the other hand, suffered a severe purge ahead of the rebound, triggered by Meta Platforms’ decision to shift a massive AI chip order from TSMC to Samsung. This shockwave, spreading from tech equity markets, paradoxically helped cleanse the crypto market by flushing out excess speculative leverage in that segment.
Two scenarios for Q3
With the Fear & Greed Index oscillating between 11 and 23 (extreme fear), the market remains traumatized despite the technical rebound. Two main paths stand out.
Bullish scenario: acceleration toward the magnet zone
This scenario assumes the deterioration in the US labor market forces the Fed toward a dovish pivot, and that ETF inflows persist. A decisive daily close above the 200-week MA ($62,444) would validate the triple bottom and open the door to a liquidity hunt toward the $67,645 cluster, and further out, toward the 200-day EMA ($77,159).
Bearish scenario: the bull trap and the on-chain reset
This model disputes the organic validity of the rebound, framing it as a mechanically-driven bull trap generated by the short squeeze rather than sustained institutional demand. A repeated rejection below the 200-week MA would erode the RSI, force a bearish cross of the short-term averages, and send price back to retest the base of the triple bottom at $60,000, then the liquidity wall at $56,000. A break of that level would open the path toward the Realized Price, between $52,000 and $53,000 — historically the on-chain floor of bear markets.
Conclusion
Bitcoin stands at a decisive crossroads. The confluence of the 200-week MA and the $62,000-$62,444 psychological zone acts as a true pivot: a durable reclaim would open the door to a liquidity hunt toward $67,645, while repeated rejection would revive the risk of a return toward $56,000, or even $52,000-$53,000. The return of ETF flows and a softer regulatory backdrop argue for cautious skepticism rather than outright pessimism — but caution remains warranted until the market confirms its direction on sustained volume.
Disclaimer: This article is provided for informational and educational purposes only. It does not constitute investment advice, a recommendation to buy or sell, nor an inducement to carry out any financial transaction. Cryptocurrency markets are highly volatile and carry significant risk of capital loss. Always do your own research (DYOR) and consult a qualified financial advisor before making any investment decision.