


As of July 12, 2026, Bitcoin (BTCUSDT) is trading around $63,737, squeezed between two massive liquidity blocks fighting for control of the market. Cross-referencing the daily, 4-hour, and 15-minute charts with the order book heatmap paints a coherent picture: a market in macro-consolidation, where both camps — institutional buyers and defensive sellers — have laid down their foundations. Here’s the multi-timeframe read on the current setup.
The Big Picture: From a $138,000 Peak to a Consolidation Zone
The macro-cyclical backdrop remains the essential starting point. Following the 2024 halving, Bitcoin entered an expansionary phase that carried it to a cyclical peak between $134,000 and $138,000 in 2025, driven by retail euphoria and massive institutional capital inflows. The correction that followed was severe, pulling price back down to a structural floor in the low $50,000s. The market is now sitting in a median equilibrium within this new consolidation channel.
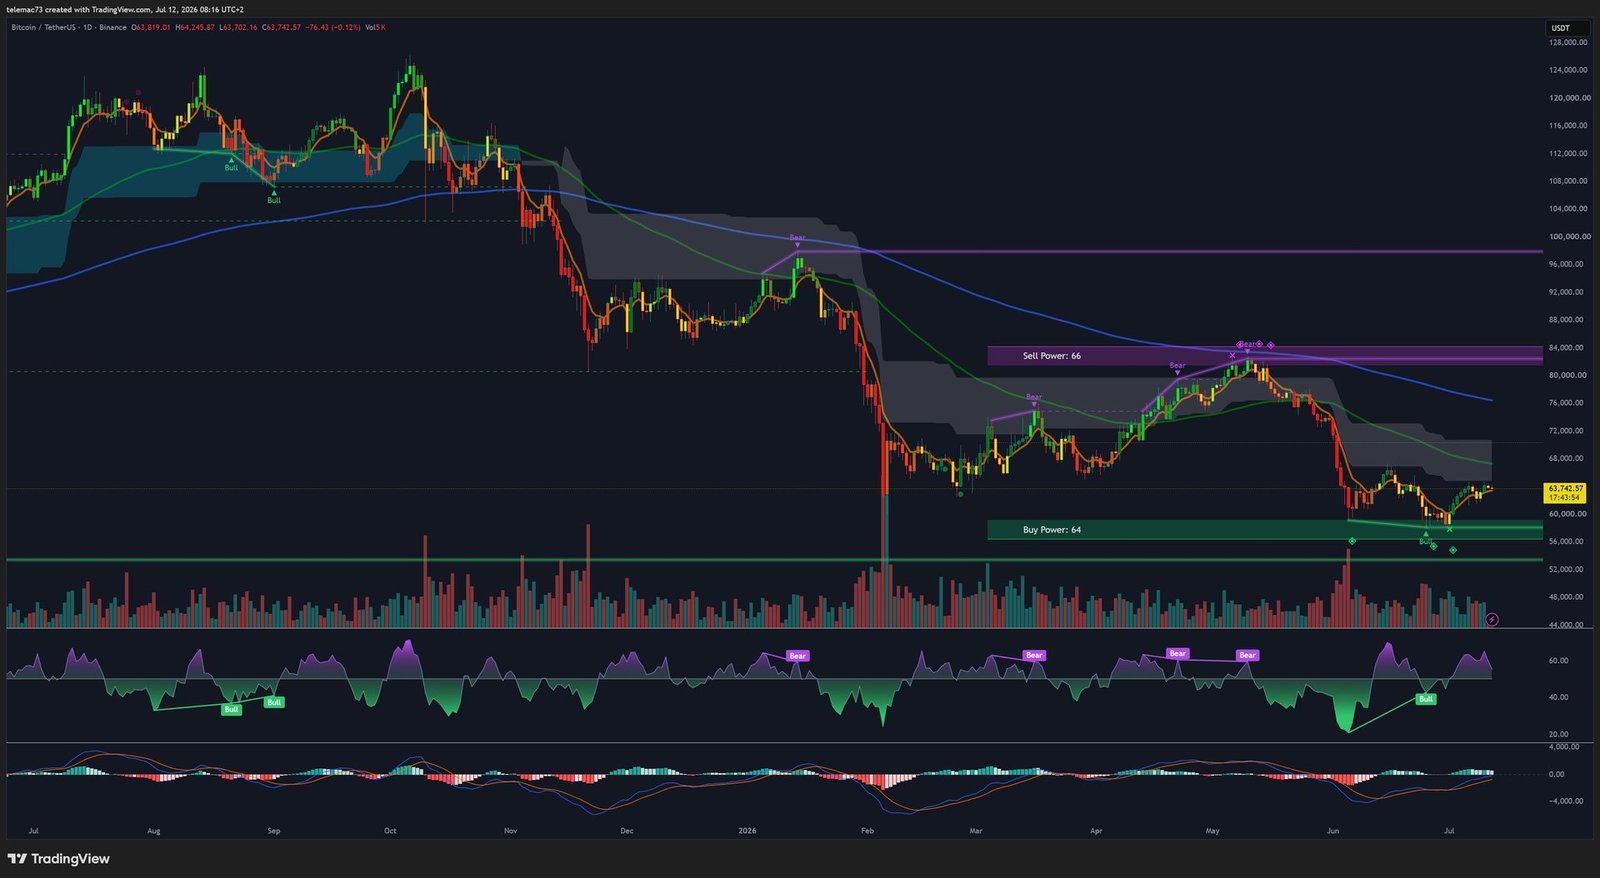
On the daily chart, two algorithmic zones frame the market structure. A dense support cluster around $58,000–$60,000 acts as a defended floor where institutional buy orders have historically absorbed sell-side capitulation. On the flip side, a major resistance band sits between $82,000 and $84,000, corresponding to prior breakdown levels where significant trapped liquidity is waiting for a break-even exit.
Momentum oscillators (RSI, MACD) confirm this read: having climbed out of deeply oversold territory, they’re now tracking a sequence of higher lows even as price made successive lows toward $52,000. This bullish divergence signals a clear decay in selling pressure.
The 4-Hour Chart: The Battle Tightens Between $58,000 and $66,000
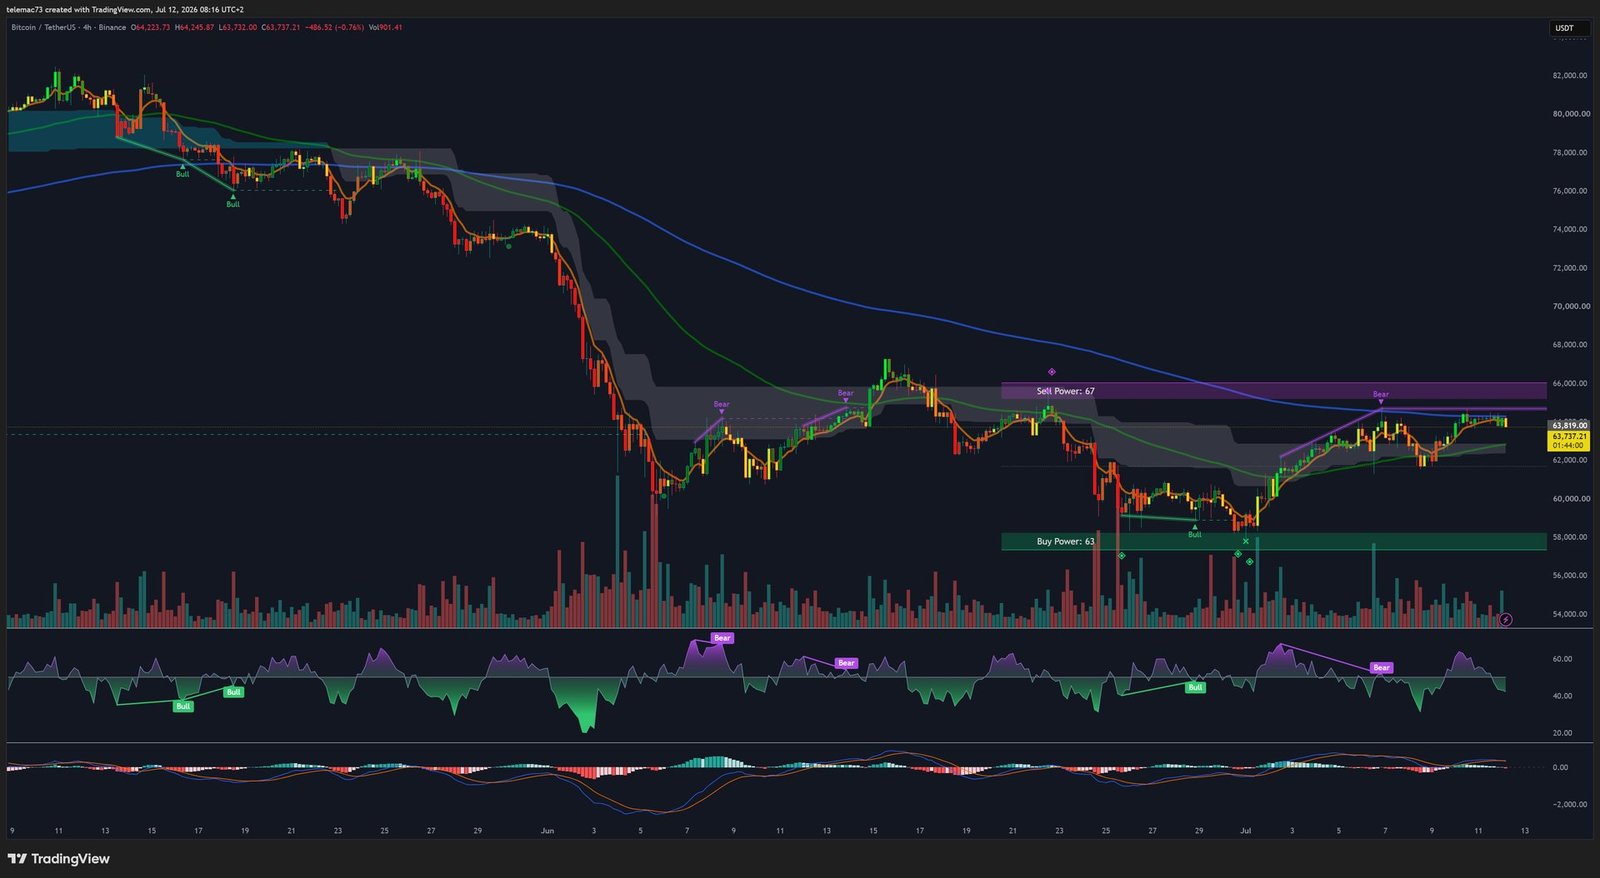
On the intermediate timeframe favored by swing traders and trend-following systems, price is moving within a localized ascending channel, riding a ribbon of exponential moving averages (EMAs). A support zone is identified near $58,000, directly aligning with the daily chart’s zone and confirming a strong institutional demand block across multiple timeframes.
Just above the current price, a resistance wall sits at $66,000. A recent attempt to break through it was met with a sharp rejection, pulling price back to its current level of $63,737 — a classic sign of a dense concentration of resting sell orders absorbing buying pressure.
| Timeframe | Key Support | Key Resistance | Status | Oscillators |
|---|---|---|---|---|
| 1D (macro) | $58,000–$60,000 | $82,000–$84,000 | Macro accumulation | Bullish divergence |
| 4H (intermediate) | $58,000 | $66,000 | Localized uptrend | Approaching overbought |
| 15M (micro) | ~$63,500 (dynamic cloud) | ~$64,400 (local highs) | Consolidation / pullback | Bearish divergence (cooling off) |
The 15-Minute Chart: After the Squeeze, Time to Cool Off
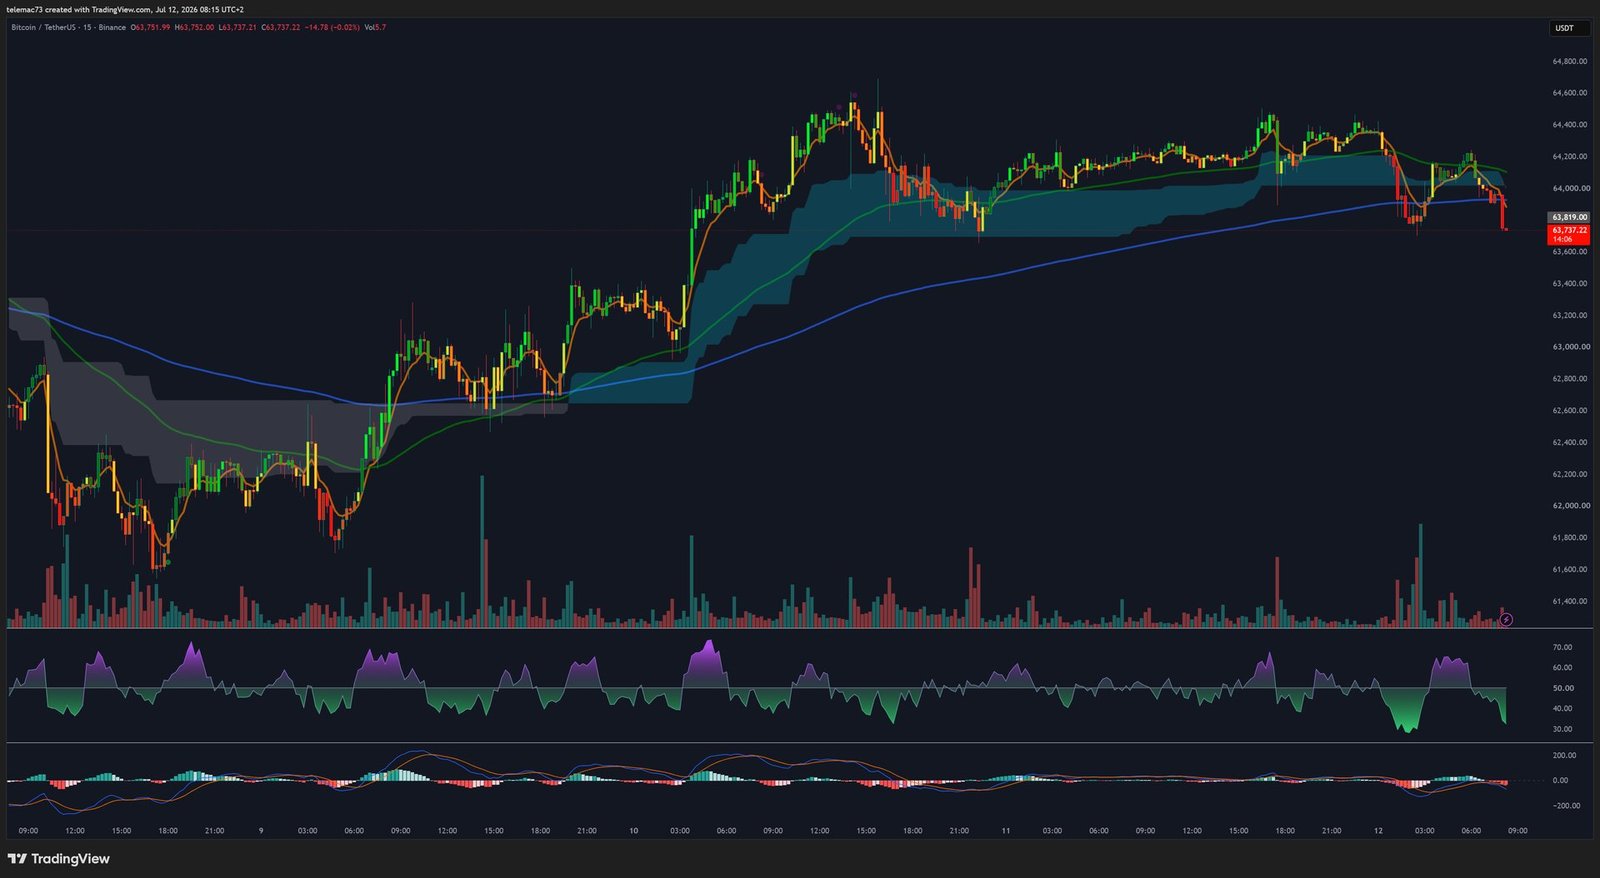
The shortest timeframe, dominated by high-frequency trading and market makers, shows a sharp vertical expansion — typical of a short squeeze or a liquidation cascade — followed by a logical consolidation marked by a series of distribution candles. Price is currently resting on a dynamic support cloud: as long as candles keep closing above its upper boundary, the intraday bias remains technically bullish despite the ongoing pullback.
Volume backs up this reading: the spikes seen on the red pullback candles suggest inventory being offloaded via TWAP/VWAP-style algorithms rather than a genuine structural reversal.
Order Book Heatmap: Where the Liquidity Really Sits
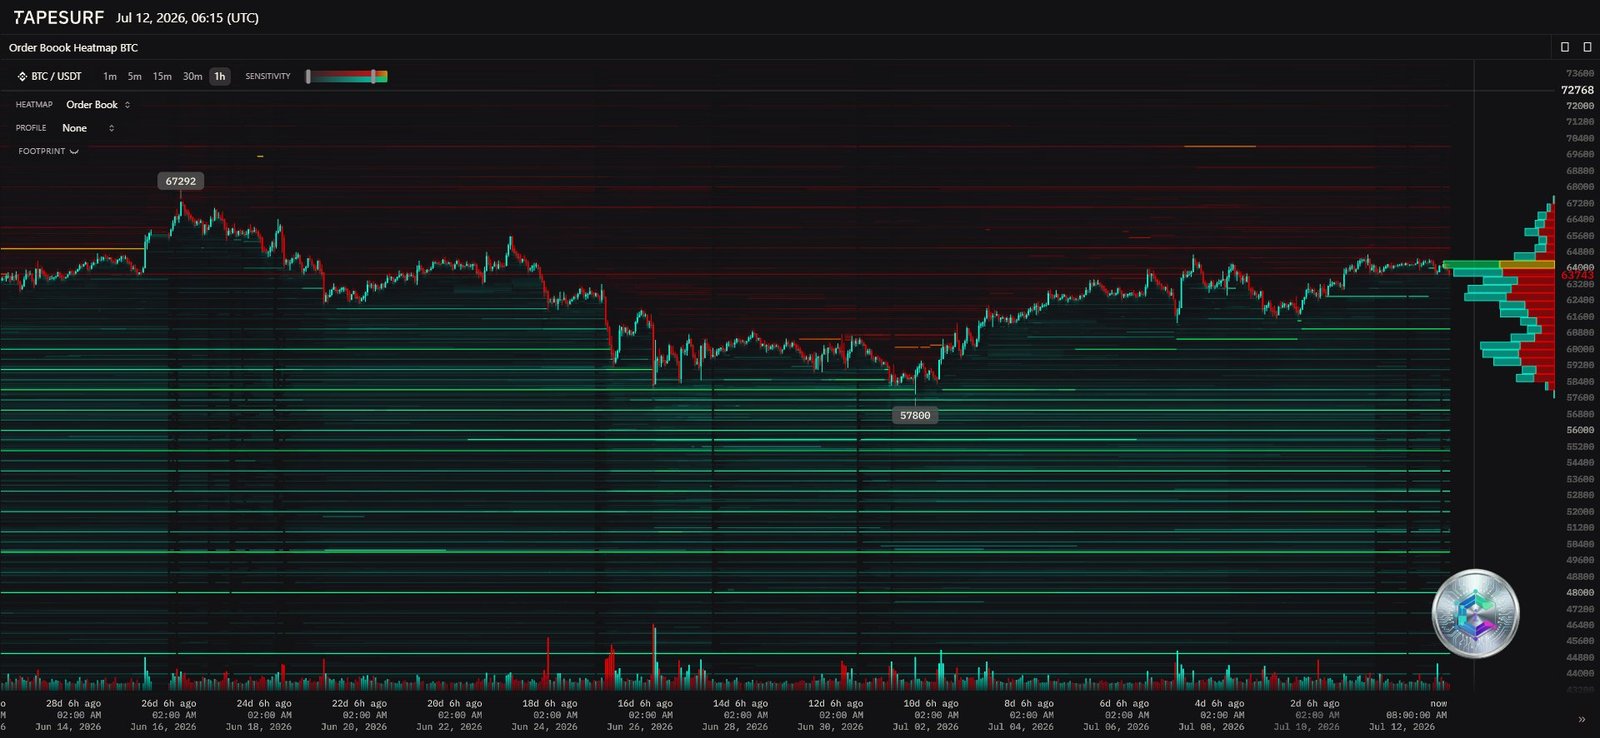
Unlike candlesticks, which show where price has already been, the order book shows where liquidity is pulling it toward. The current price sits in a relative « liquidity void, » bracketed by two massive walls. On the sell side, a heavy wall shows up at $67,292, with a second concentration higher up near $72,768. On the buy side, a substantial liquidity floor appears at $57,800, consistent with the support zones flagged on the daily and 4-hour charts.
| Liquidity Type | Price Level | Density | Multi-Timeframe Confluence |
|---|---|---|---|
| Primary ask wall | $67,292 | Extremely high | Aligns with the 4H $66,000 resistance |
| Secondary ask wall | $72,768 | High | Macro structural resistance |
| Primary bid wall | $57,800 | Extremely high | Aligns with 1D/4H support zones (~$58k) |
| Current price | ~$63,740 | Low (void) | Crossing the gap between both walls |
Risk Management Framework
At the current price of roughly $63,740, opening a long position offers a poor risk-to-reward ratio: the upside to the $67,292 resistance is roughly +$3,550, against a downside risk of roughly -$5,940 back to the $57,800 support. Professional quantitative systems typically require a minimum ratio of 2 to 3 to initiate a trade — which puts the current level in a monitoring zone rather than an aggressive entry point.
A more favorable setup would involve waiting for price to interact with the $57,800 bid wall, combined with oversold and bullish divergence signals on the 15M and 4H oscillators, with a stop-loss placed below the deepest structural wick (around $56,500). Conversely, a decisive daily close above $67,292 with confirming volume would open the door toward the next liquidity zone near $72,768.
Summary
Bitcoin is trading within a consolidation channel bounded by a floor at $57,800–$58,000 and a ceiling at $66,000–$67,292. The intermediate (4H) trend remains bullish, while the intraday (15M) structure is going through a necessary cooling-off period. The most likely near-term scenario is a renewed push toward the $66,000–$67,292 zone once the current consolidation resolves — with a risk of a violent rejection if buying volume isn’t enough to absorb that sell wall. Should that attempt fail, a retreat back toward the $57,800 floor remains the path most consistent with current market structure.
Disclaimer: This article is provided for educational and informational purposes only. It does not constitute investment advice, a recommendation to buy or sell, or a solicitation to engage in any financial transaction. Cryptocurrency markets are highly volatile and involve risk of capital loss. Do your own research and consult a qualified professional before making any investment decision.

