
As Q2 2026 approaches, Bitcoin finds itself navigating a historically complex financial matrix. Explosive geopolitics, persistent inflation, and institutional repositioning have converged to create one of the most nuanced setups in crypto market history. The cryptocurrency has never been so deeply embedded in the global macroeconomic fabric. A complete breakdown of a market under extreme pressure.
🌍 Macroeconomic Context: Geopolitics Meets Monetary Policy
The US-Iran Shock and Its Market Shockwave
Bitcoin’s valuation throughout March 2026 cannot be separated from the geopolitical backdrop reshaping global risk appetite. The US-Iran military escalation propelled Brent crude beyond $100/barrel, approaching $110 at peak. This energy price surge reignited inflationary expectations, forcing the Federal Reserve to maintain its restrictive monetary stance.
On March 23, 2026, the Trump administration announced a five-day suspension of planned military strikes against Iranian energy infrastructure, alongside a fifteen-point ceasefire proposal. This window of calm was enough to trigger a violent relief rally: Bitcoin briefly broke through $71,000, reaching an intraday high of $71,811, while simultaneously wiping out approximately $791 million in over-leveraged short positions. Despite Iran’s formal denial of any negotiations, this episode starkly illustrates how deeply crypto assets now react to international diplomacy.
This behavior reflects a fundamental shift: rather than acting as a countercyclical safe haven (the « digital gold » narrative), Bitcoin now exhibits a 78% correlation with the S&P 500 during periods of acute stress. The logic is mechanical — the threat to the Strait of Hormuz (through which one-fifth of global oil transits) generates inflation, which constrains the Fed, which tightens the cost of capital, which drains liquidity from long-duration risk assets like Bitcoin.
The Fed’s Trap: PCE, Dot Plot, and « Higher for Longer »
The Core PCE index (the Fed’s preferred inflation gauge) came in at 3.1% year-over-year for early 2026, well above the 2% target. OECD projections forecast US inflation at 4.2% for the full year. Faced with this price resilience, the March FOMC revealed a pronounced hawkish pivot: 7 of 19 members now anticipate zero rate cuts in 2026, with the median suggesting only one potential reduction, and the long-term terminal rate stabilizing around 3.1%. The 10-year Treasury yield surged to 4.416%, dramatically increasing the opportunity cost of holding non-yielding Bitcoin.
| Macroeconomic Indicator | Value / Status | Impact on BTC |
|---|---|---|
| Core PCE (Year-over-Year) | 3.1% (above expectations) | Negative short-term |
| US 10-Year Treasury Yield | ~4.416% | Negative (opportunity cost) |
| Brent Crude Price | $97 – $110 (extreme volatility) | Mixed (stagflation risk) |
| BTC / S&P 500 Correlation | 78% | Negative during mass sell-offs |
| Crypto Fear & Greed Index | 10 to 15 (Extreme Fear) | Positive (contrarian indicator) |
🏦 Institutional Flows: Spot ETFs, MicroStrategy, and Options Expiry
The Spot Bitcoin ETF Reversal
March perfectly illustrates the fracture between retail sentiment and institutional behavior. While the Fear & Greed Index plunges to 10/100 — a level of extreme fear unseen since late 2024 — Spot Bitcoin ETFs had recorded a remarkable four-week streak of massive net inflows in early March, totaling over $2.2 billion.
Yet the final week of March brought a sharp reversal: ETFs suffered net outflows of $296 million. Thursday alone saw $171 million in redemptions — the month’s largest daily outflow — hitting BlackRock’s IBIT (-$41M), Fidelity’s FBTC (-$32M), and Grayscale’s GBTC (-$24M). Weekly ETF trading volume collapsed from $25.87 billion to $14.26 billion.
This is not institutional capitulation — cumulative net inflows since launch still exceed $55.93 billion. Rather, it represents a tactical reduction of directional risk while awaiting geopolitical clarity. Meanwhile, MicroStrategy continues its relentless accumulation program, announcing a $44.1 billion financing facility to acquire more Bitcoin.
The Colossal March 27 Options Expiry
The most structurally impactful derivatives event of the month was the expiration of options contracts worth a notional value of $14.16 billion on Deribit on March 27. The « Max Pain » level — the price at which most options expire worthless, maximizing profits for market makers — was anchored at $75,000. Market makers held an estimated $3 billion short gamma position around this strike.
Macroeconomic pressure ultimately prevailed. The 25-delta Risk Reversal plunged to -19.34, revealing extraordinary demand for protective puts — a symptom of systemic pessimism. Nevertheless, open interest on April and June expirations retains a substantial base of calls above $80,000, signaling that the market is betting on recovery once the geopolitical storm clears.
| Institutional Indicator | Data (Late March 2026) | Interpretation |
|---|---|---|
| Weekly Spot BTC ETF Flows | -$296.18M (net outflows) | Reduction of directional risk |
| BTC ETF AUM | $84.77B | Down from >$90B prior week |
| Max Pain (March 27) | $75,000 | Gravitational pull insufficient |
| 25-Delta Risk Reversal | -19.34 (deep put bias) | Heavy premium for downside protection |
| 24h Liquidations (avg) | ~$300M (majority longs) | Market structure cleansing |
🔥 Liquidation Heatmap & Order Flow: Mapping the Battlefield
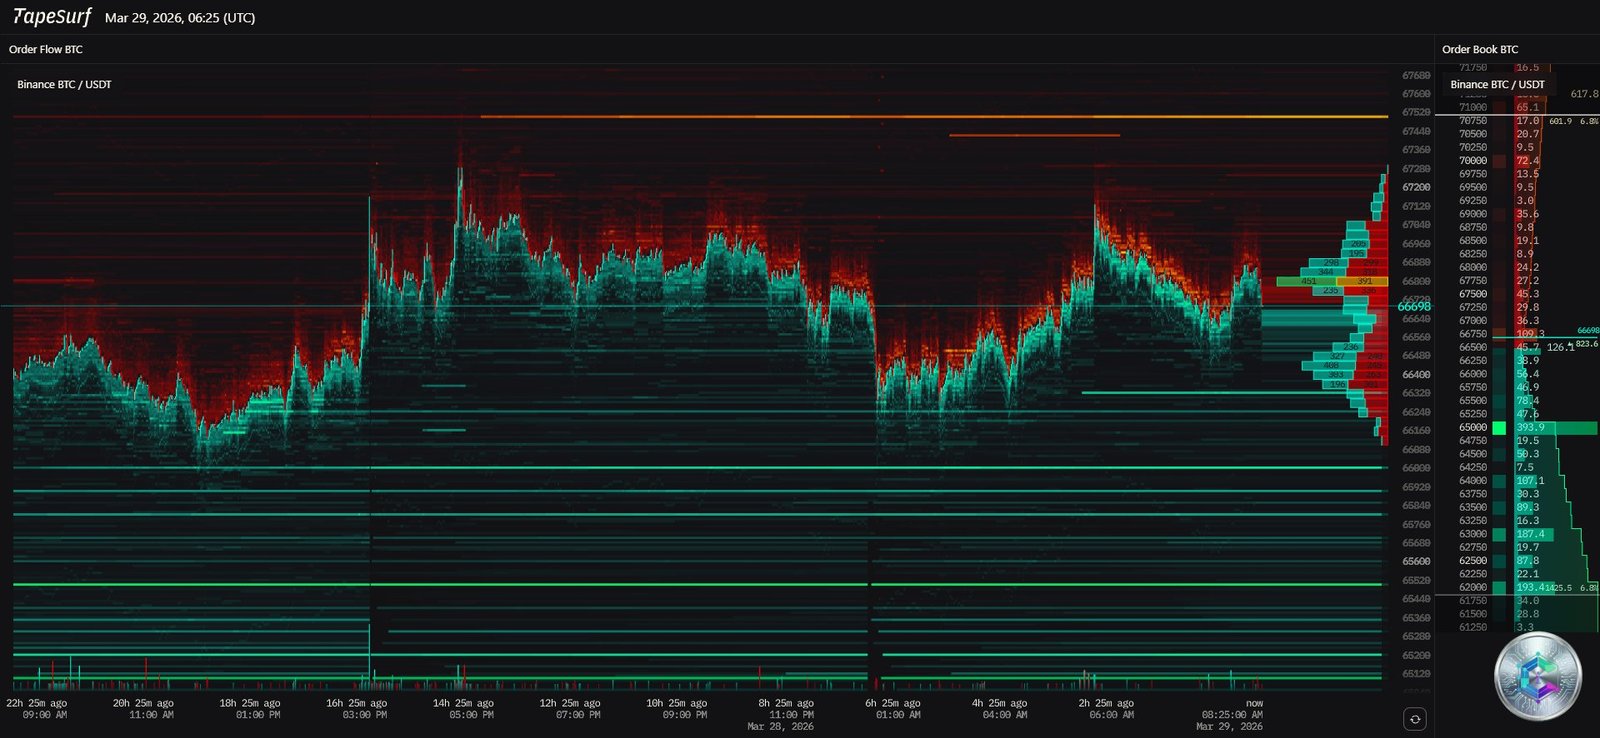
The liquidation heatmap analysis reveals a market architecture under extreme tension. In a market this financialized, prices don’t move randomly — they are magnetically drawn toward liquidity pools where leveraged positions will be forcibly closed.
Key Zones Identified
Sell side (resistances): Dense red bands accumulate between $67,000 and $68,000, intensifying toward $71,000. These represent institutional limit sell orders capping every bullish attempt.
Buy side (supports): Significant green concentrations are visible around $65,000 and $62,000, where « buy the dip » buyers have positioned large limit buy orders.
Point of Control (POC): The Volume Profile confirms that the $66,000 – $66,500 zone represents the high-volume node — the market’s perceived short-term fair value equilibrium.
The Short Squeeze Potential at $71,800
The $71,800 – $72,000 zone harbors an exceptional concentration of short liquidations — traders who bet against Bitcoin using 50x to 100x leverage. If a fundamental catalyst (confirmed ceasefire, falling bond yields) propelled price into this zone, the forced closure of these shorts would generate an algorithmic demand surge capable of catapulting BTC toward $75,000 within minutes.
However, beyond $76,000, the heatmap fades. Without genuine spot buyers taking over from the derivatives-driven momentum, any incursion above $75,000 risks becoming a bull trap.
On the bearish side: If the $65,000 support breaks, the liquidity void in the order book could trigger a straight slide toward $60,000 – $62,000 with no meaningful brake.
📊 Multi-Timeframe Technical Analysis
Daily Chart (1D): The « Death Cross » Threat
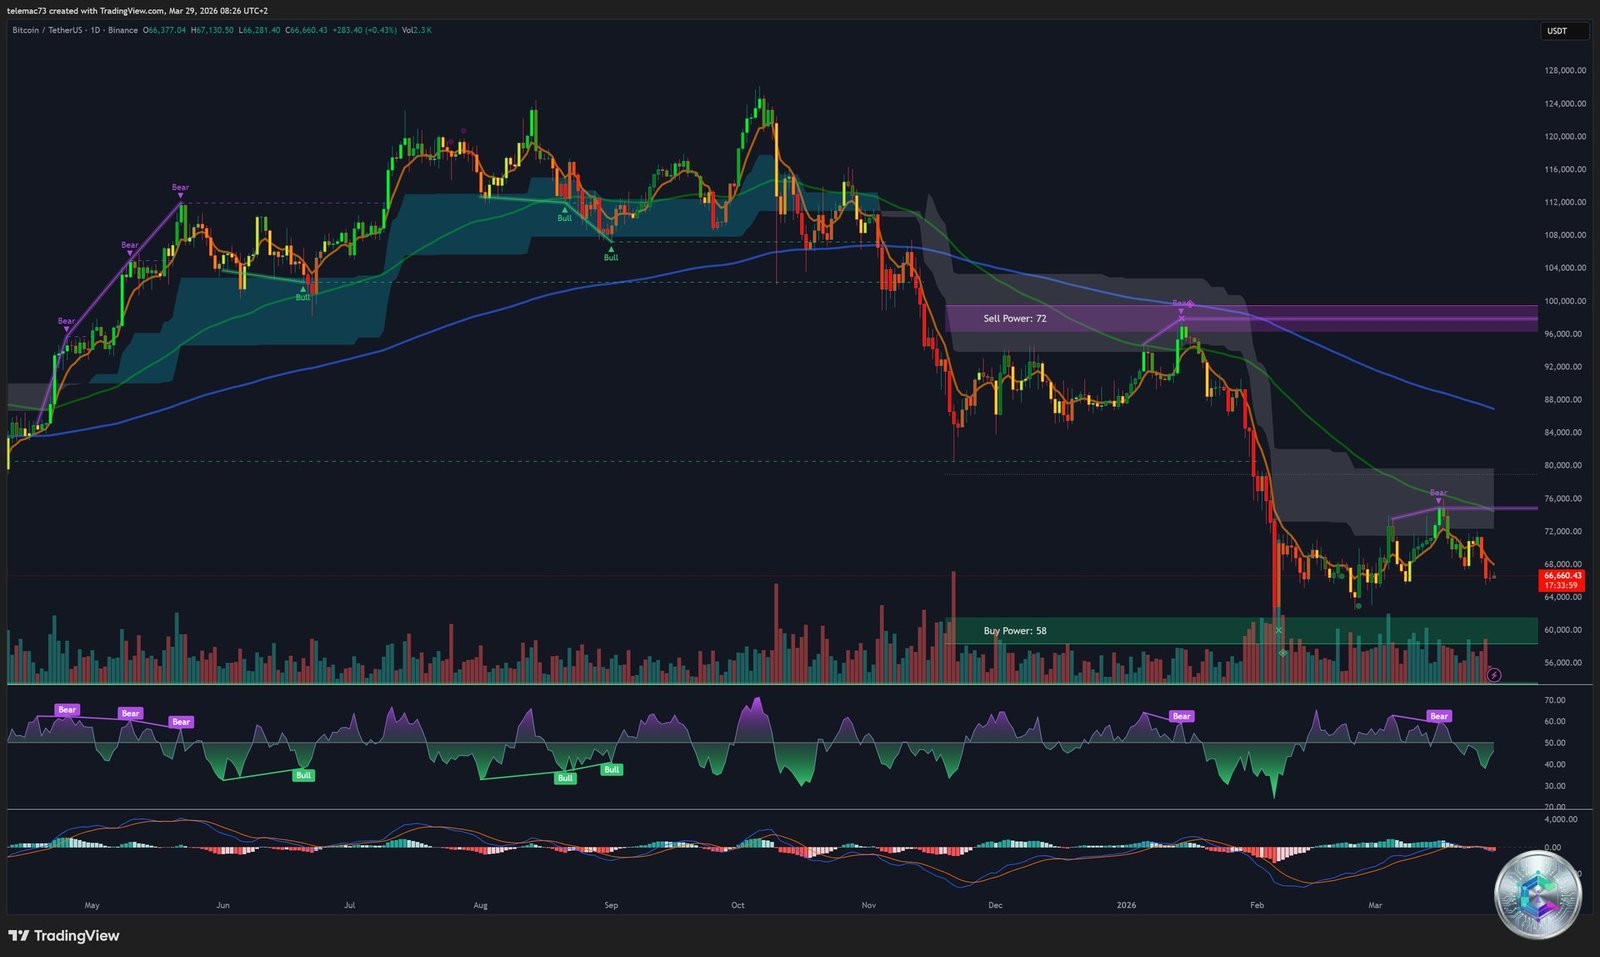
The daily timeframe paints a concerning picture. Bitcoin is currently trading below its 50-day EMA ($66,789 – $67,862) and, more alarmingly, below its 200-day EMA ($68,986 – $69,790). The loss of this 200-day moving average — historically the demarcation line between bull and bear markets — represents a major structural weakness signal.
The daily MACD is deeply entrenched in negative territory. The MACD line trades below its signal line, the histogram remaining bearish despite occasional brief contractions. The 14-day RSI navigates between 42 and 50 — a fragile neutral zone that paradoxically indicates further downside potential remains before capitulation territory (below 30) is reached. The overwhelming majority of moving averages from 5 to 200 days are generating « Strong Sell » signals.
4-Hour Chart (4H): A Spring Coiled to Breaking Point
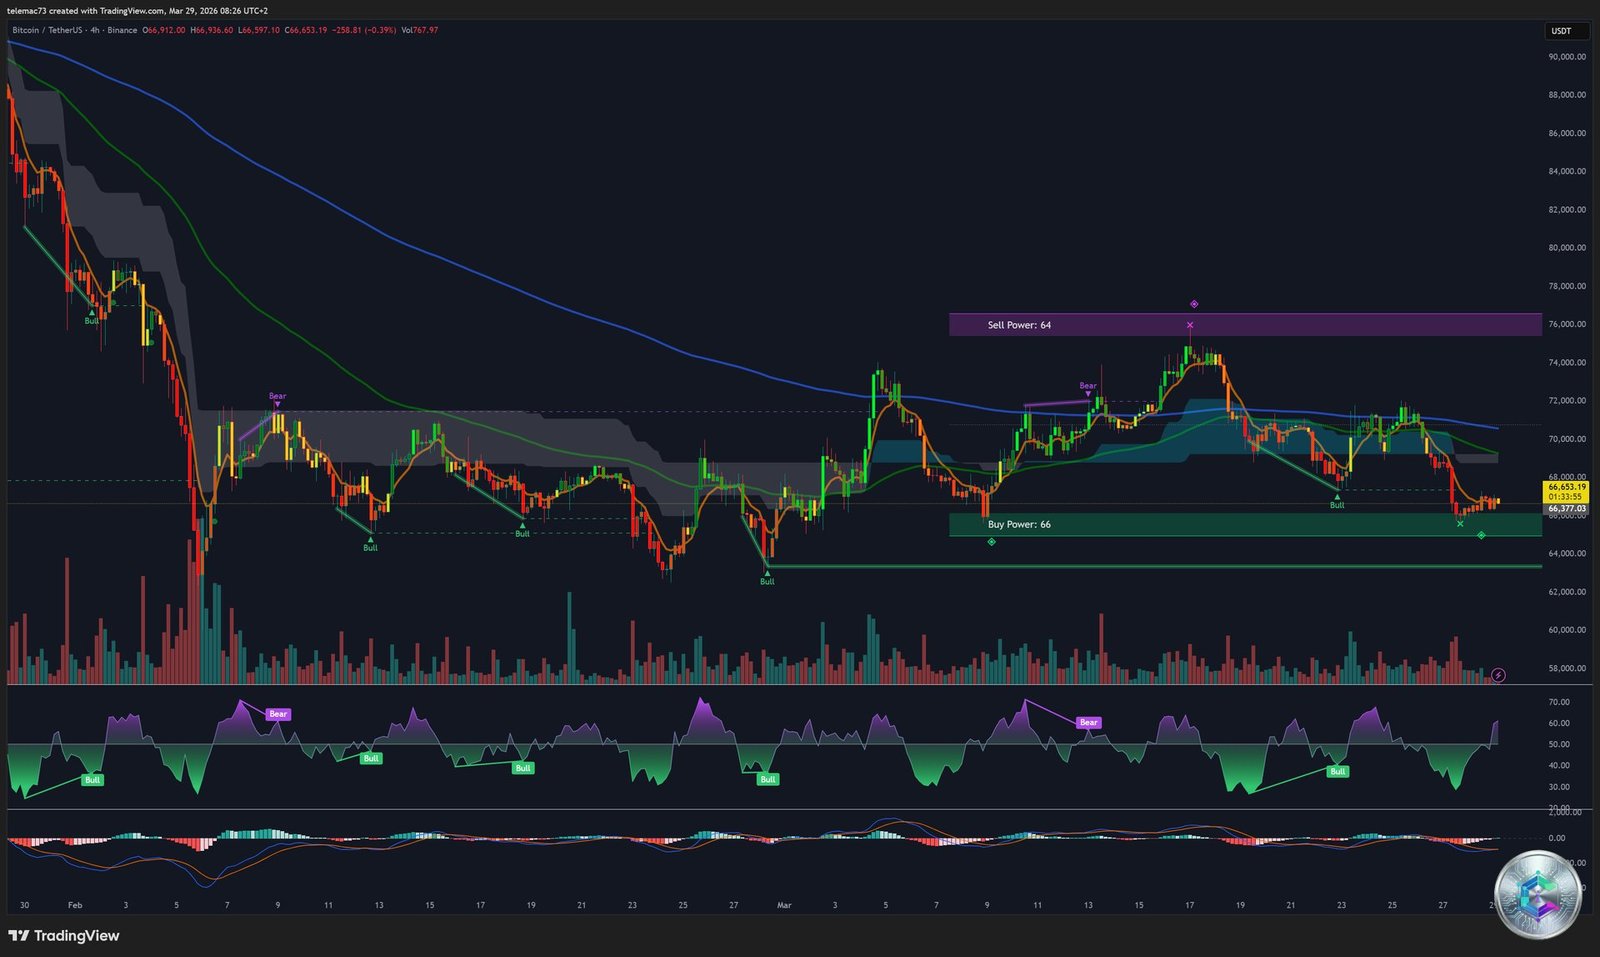
The 4-hour chart reveals an undeniable price compression structure: lower highs connected by a clear descending trendline, while lows stubbornly defend the $64,000 – $65,000 floor. The Bollinger Band squeeze signals an imminent release of kinetic energy.
The central debate: Bear Flag or Symmetrical Triangle?
- Bear Flag thesis: The overall structure shows a violent bearish impulse (the flagpole) followed by a sideways-to-slightly-ascending consolidation channel. Historically, these patterns resolve to the downside 70% of the time. A break below $62,300 would project a measured move target toward $50,000 – $45,000.
- Consolidation Triangle thesis: The excessive duration of the formation (50+ days) invalidates the classic bear flag definition, which typically resolves in a few weeks. Higher lows forming on certain hourly sequences suggest a compression triangle awaiting a fundamental catalyst (geopolitical resolution, favorable inflation print) for an upside breakout.
15-Minute Chart (15m): Algorithmic Turbulence
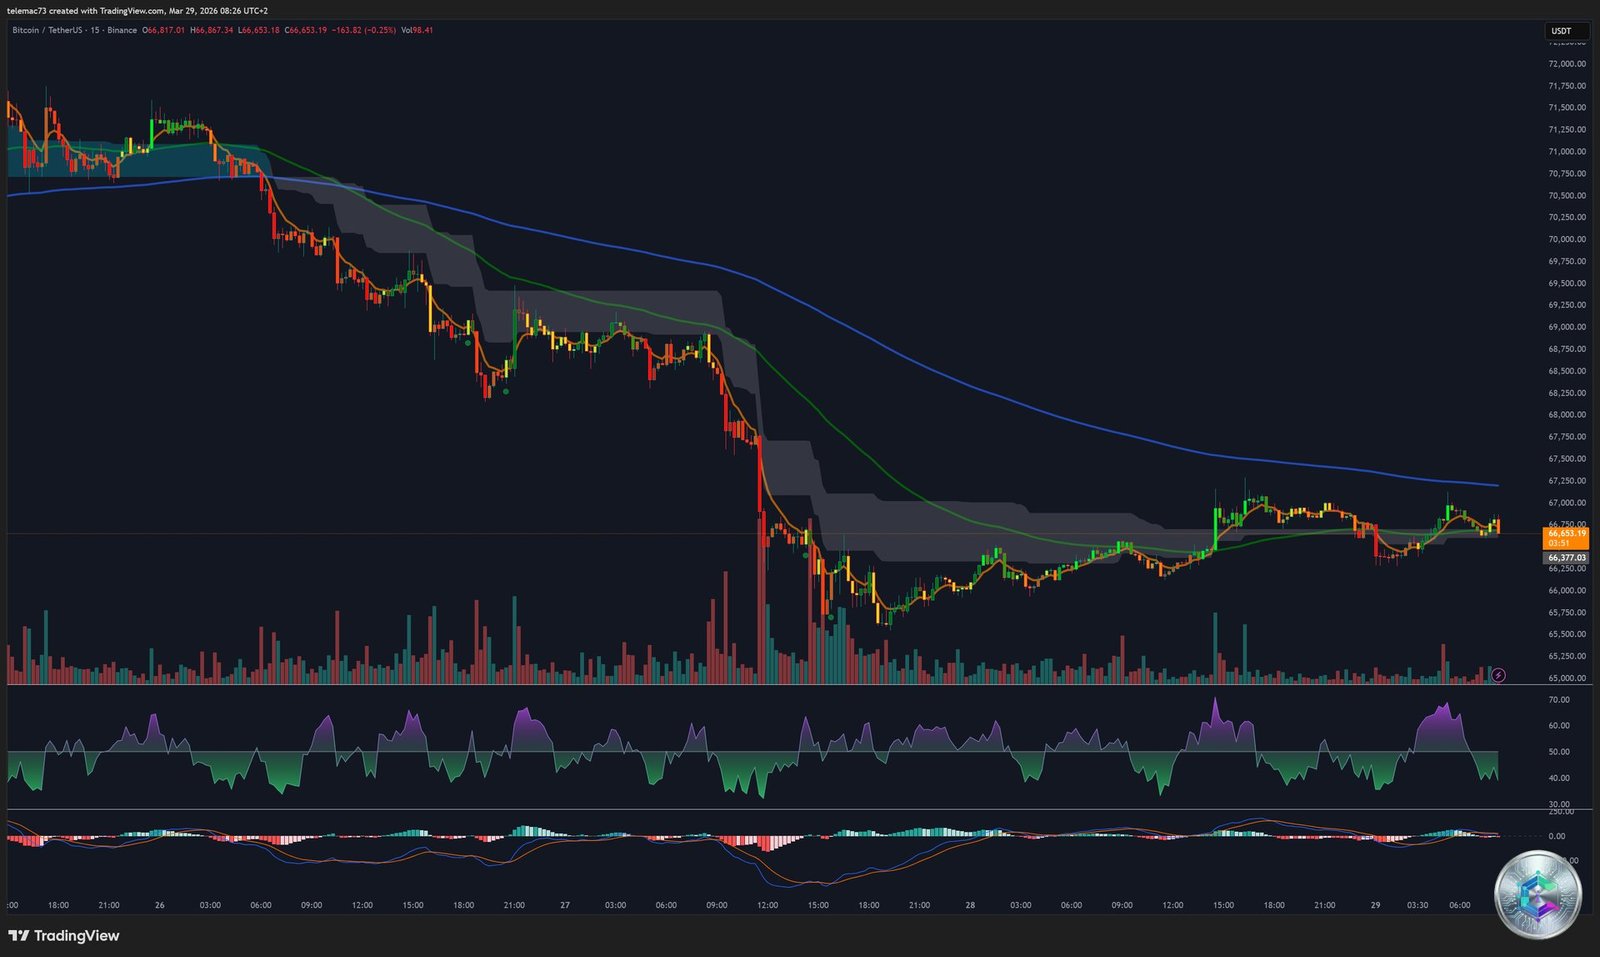
The 15-minute chart captures the direct and volatile interaction between news flow and high-frequency trading algorithms. The visual structure is striking — « staircase » drops characterized by aggressive red candles with exceptional volume spikes, successively breaking local supports in liquidation cascades. The EMA ribbon has widened and flipped to deep red, acting as a suffocating resistance on every intraday rally attempt.
The dominant strategy on the 15m timeframe is sell-the-rally: as soon as the RSI approaches overbought territory (70), institutional sell orders instantly absorb retail demand and reject price lower. Bullish oscillator crossovers remain fragile scalping opportunities in this macro-bearish context.
📐 Pivot Levels and Market Structural Architecture
Daily pivot point analysis across five methodologies (Classic, Fibonacci, Camarilla, Woodie, and DeMark) reveals a striking convergence: all formulas identify the central pivot between $66,512 and $66,534. This level serves as the gravitational core of the intraday market.
Key Resistance Levels (Seller Strongholds)
- $74,450 – $75,000: The existential resistance. Corresponds to April 2025 lows now turned resistance and the options Max Pain level. A weekly close above this fortress would invalidate all bearish theories and open the path toward new all-time highs ($80,000+).
- $71,800 – $72,000: The intermediate demarcation line. Houses the heatmap’s short liquidation cluster. The upper boundary of the 4H compression triangle. Its breach triggers an algorithmic short squeeze.
- $68,900 – $69,400: The 200-day EMA/SMA zone. As long as price remains below this average, systematic fund managers maintain a bearish bias.
Key Support Levels (Buyer Strongholds)
- $65,500 – $66,000: Immediate liquidity floor. Defended vigorously during recent monetary policy and geopolitical shocks.
- $61,500 – $64,500: Fundamental cycle support. Coincides with post-halving miner production costs. The true floor of the 50-day consolidation range.
- $57,000 – $60,000: The ultimate red line. A break below $61,500 creates a liquidity vacuum, with the Bear Flag projection target serving as the potential landing zone.
🔮 Forward-Looking Scenarios for Q2 2026

The market is a powder keg. The combination of a potential Death Cross on the daily, extreme compression on the 4H, and concentrated open interest at key levels guarantees that the resolution of this 50-day range will be directionally violent.
🐻 Bearish Scenario (Bear Case)
If April inflation data confirms deterioration and the Middle East situation paralyzes energy trade durably, algorithmic models will force a risk asset liquidation event. A break below $64,000 triggers the Bear Flag pattern, purging price toward $55,000 – $60,000 — which would then represent the true generational accumulation bottom of 2026.
🐂 Bullish Scenario (Bull Case)
Conversely, if a concrete diplomatic détente relieves energy markets and global liquidity stabilizes, the market will assault the short liquidation wall at $72,000. The ensuing short squeeze will obliterate sellers, propel the asset past $75,000, attract the return of massive ETF inflows, and reinstall Bitcoin on a structural price discovery trajectory toward $90,000.
The Analyst’s Conclusion
The era of Bitcoin as an isolated asset is definitively over. Its trajectory in Q2 2026 will be dictated as much by Brent crude prices and Jerome Powell’s tone as by its own internal charts. Prudent operators will wait for a confirmed break, on a daily close with volume, outside the $64,000 – $72,000 channel, before deploying significant directional capital.
⚠️ Disclaimer: This article is published for educational and informational purposes only. It does not constitute investment advice, a recommendation to buy or sell, or an invitation to engage in any financial transaction. Crypto-asset markets are extremely volatile. All investments carry risk, including the total loss of invested capital. Please consult a licensed financial advisor before making any investment decision.