
Bitcoin has just crossed a major psychological threshold by surpassing $96,000, marking its highest level in two months. This technical breakthrough comes alongside a confluence of favorable macroeconomic factors and a bullish chart structure confirmed across multiple timeframes. Let’s explore the key elements of this promising dynamic together.
Supportive Macroeconomic Context
The current environment is proving particularly favorable for Bitcoin. The latest U.S. inflation data (CPI) for December 2025 showed stabilization at 2.7% year-over-year, exactly in line with expectations. Even more significant, « Core » inflation (excluding food and energy) slowed to 2.6%, down from 2.7% the previous month.
This gradual disinflation validates the « soft landing » scenario for the U.S. economy, reducing pressure on the Federal Reserve to maintain restrictive rates. Historically, Bitcoin outperforms in rate-cutting environments, where the opportunity cost of holding non-yield-bearing assets decreases.
Meanwhile, institutional adoption is accelerating. MicroStrategy recently acquired an additional 13,627 BTC at an average price of $91,519, bringing its total holdings to 687,410 BTC. This massive accumulation establishes a psychological « price floor » around $90,000-$91,000.
Multi-Timeframe Technical Analysis
Daily Chart: Confirmed Underlying Trend
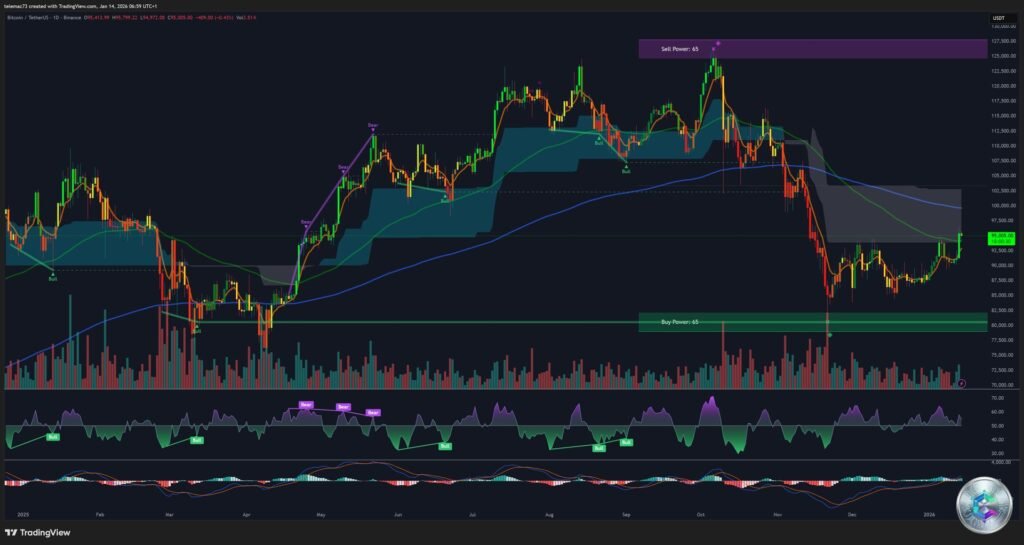
On the daily timeframe, the structure remains decidedly bullish. The price bounced precisely on the 50-day moving average (MA50) located around $92,200, validating the strength of the intermediate trend. The Ichimoku cloud confirms this bullish bias, with the price trading above the Kumo.
The 200-day moving average (MA200), situated around $104,000, represents the major medium-term resistance. A close above this level would validate the resumption of the secular bull market. The RSI remains in neutral-bullish territory, leaving significant room for price expansion toward $100,000 without immediate overheating.
4-Hour Chart: Symmetrical Triangle Breakout

The central element on the 4-hour chart is the formation and resolution of a symmetrical triangle. During the first half of January, the price oscillated between converging trendlines, signaling volatility compression.
The breakout occurred above the upper trendline, located around $94,000-$94,500, accompanied by a clear « Bull » buy signal. The price moved above the volatility cloud and short-term moving averages realigned upward.
The theoretical target of this triangle breakout, calculated by projecting the base height from the breakout point, projects the price toward the $101,000-$102,000 zone. This projection coincides with the structural resistance zone of the daily MA200.
15-Minute Chart: Bullish Microstructure
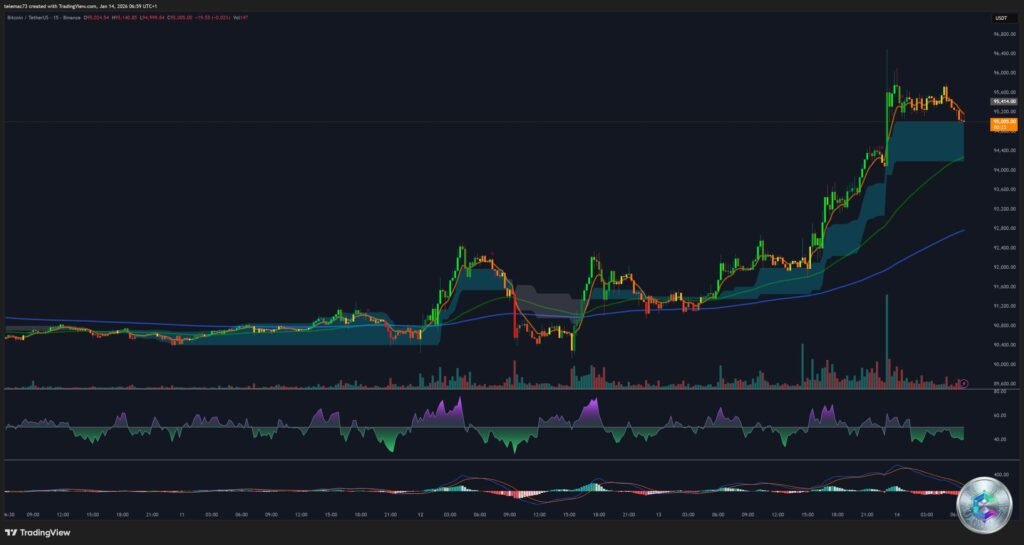
The 15-minute chart reveals a succession of powerful bullish candles with very few upper wicks, indicating that buyers maintain control through the close of each period. Retracements are shallow and quick, often limited to the 20-period exponential moving average (EMA20).
The breakthrough of the R3 pivot, located around $94,945, qualifies the day as a « Trend Day. » Volume spikes coincide with the breaking of key levels ($95,000, $95,500), confirming the entry of new participants into the market.
Liquidity Heatmap Analysis
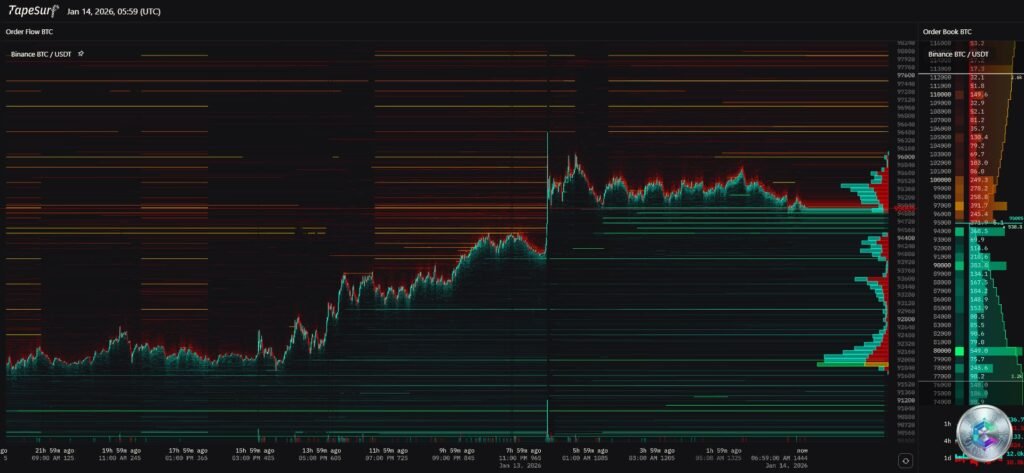
The liquidity heatmap reveals crucial information about market microstructure. An exceptional density of sell orders extends from $96,000 to $111,000, constituting the « most important liquidity block. » Each round level (97k, 98k, 99k) will act as a kinetic barrier that the price must overcome.
The rapid rise above $95,000 was catalyzed by short position liquidations. Over $269 million in shorts were liquidated as key resistances were broken, creating a « short squeeze » phenomenon that vertically accelerated the movement.
On the downside, liquidation clusters for long positions are located between $87,000 and $89,000. Should the price reverse and break $90,000, this zone would represent the next significant organic support.
Key Levels to Watch
Major Resistances:
- $100,000 – Major psychological barrier (« Century Mark »)
- $104,000 – 200-day Moving Average, critical level for long-term trend change
- $111,000 – Upper bound of major liquidity block
- $126,184 – All-time high (ATH) from October 2025
Strategic Supports:
- $94,500-$95,000 – Breakout zone, former 4H triangle ceiling
- $92,200 – 50-day Moving Average, lifeline of bullish trend
- $90,000 – Psychological threshold and institutional accumulation zone
- $87,000-$89,000 – Long liquidation cluster, ideal buying zone in case of correction
Scenarios and Outlook
Main Scenario: Bullish Continuation toward 100K+ (Probability: 60%)
The momentum generated by the triangle breakout and favorable macroeconomic news continues to dominate. After brief consolidation above $95,000, a new wave of buying could push the price to attack liquidity between $98,000 and $100,000. The triangle’s technical target projects the price toward $102,000.
Alternative Scenario: Consolidation (Probability: 40%)
The identified sell wall from $96,000 proves too dense to absorb without a new catalyst. Failure to close daily above $96,500 would trigger a pullback below $94,500, invalidating the immediate breakout and sending the price back into the 90-92K zone.
Conclusion
Bitcoin’s current configuration favors bullish exposure with rigorous risk management. The macroeconomic environment (stable inflation, upcoming regulatory clarity) provides the necessary tailwind, while the technical structure offers a precise analytical framework.
The $100,000-$104,000 zone represents a major convergence area where several technical and structural resistances meet. A weekly close above $104,000 would constitute a strong buy signal for a move toward the ATH and beyond.
The key to success will lie in monitoring the price’s reaction to identified liquidity walls and maintaining critical supports established during the recent breakout.
Disclaimer: This article is provided for educational and informational purposes only. It does not constitute investment advice or a buy or sell recommendation. Cryptocurrency markets are extremely volatile and carry significant risk of capital loss. Always do your own research (DYOR) and consult a qualified financial advisor before making any investment decision.