


In early May 2026, Bitcoin (BTC) has emerged as the most closely watched asset in global financial markets. The breach of the psychological $80,000 threshold — fueled by $270 million in short liquidations — marks a critical structural inflection point. This comprehensive analysis dissects order book microstructure, institutional dynamics, and technical signals across four timeframes to map the most probable trajectories for the sessions ahead.
Institutional Flows: The Architecture of a New Market Paradigm
Bitcoin’s market structure in 2026 has been fundamentally reshaped by institutional integration. US Spot Bitcoin ETFs now manage over $100 billion in assets under management, with BlackRock’s IBIT fund alone commanding more than $63 billion. In April 2026 alone, these vehicles absorbed $1.97 billion in net inflows, marking five consecutive weeks of positive flows following a brief two-week outflow period.
This accumulation is not merely speculative buying pressure — it represents a permanent alteration of supply and demand dynamics. On-chain data confirms that whale-tier entities absorbed $500 million worth of BTC between $75,000 and $78,000 within a 48-hour window, coinciding with a 12% surge in transaction volume. Institutional VWAP and TWAP algorithms create a constant bidirectional floor, systematically compressing the amplitude of market corrections and forcing short sellers into costly cover positions.
Macroeconomic Context: The Federal Reserve at the Center of the Trade
Bitcoin’s behavior as an emerging reserve asset remains intrinsically tied to monetary policy expectations. May 2026 is a convergence point for a series of critical US economic releases:
| Indicator | Previous | May 2026 Forecast | BTC Implication |
|---|---|---|---|
| JOLTS Job Openings | 7.10M | 6.87M | 🟢 Bullish |
| ADP Employment (April) | 62,000 | 109,000 (actual) | 🟡 Neutral |
| Initial Jobless Claims | 189,000 | 203,000–205,000 | 🟢 Bullish |
| Non-Farm Productivity | 1.8% | 0.7% | 🟢 Bullish |
| Unemployment Rate | 4.3% | 4.3% | ⚪ Neutral |
A significant rise in jobless claims would theoretically force the Fed into a more dovish posture, depressing the DXY dollar index and bond yields — making fixed-supply, non-yielding assets like Bitcoin mathematically more attractive. Arthur Hayes, speaking at Consensus 2026 in Miami, further argued that the massive financing needs tied to Western reindustrialization and military spending will inevitably force central bank balance sheet expansion, justifying price targets of $125,000 within this cycle.
Market Microstructure: Reading the Order Book Heatmap
The order book heatmap reveals a strikingly asymmetric liquidity topology that favors bulls. Below the current price, thick warm-colored bands clustered around the $80,000 level confirm a massive « buy wall » deployed by market makers and institutional accumulation algorithms — entities that have validated this level as the new structural floor through polarity inversion.
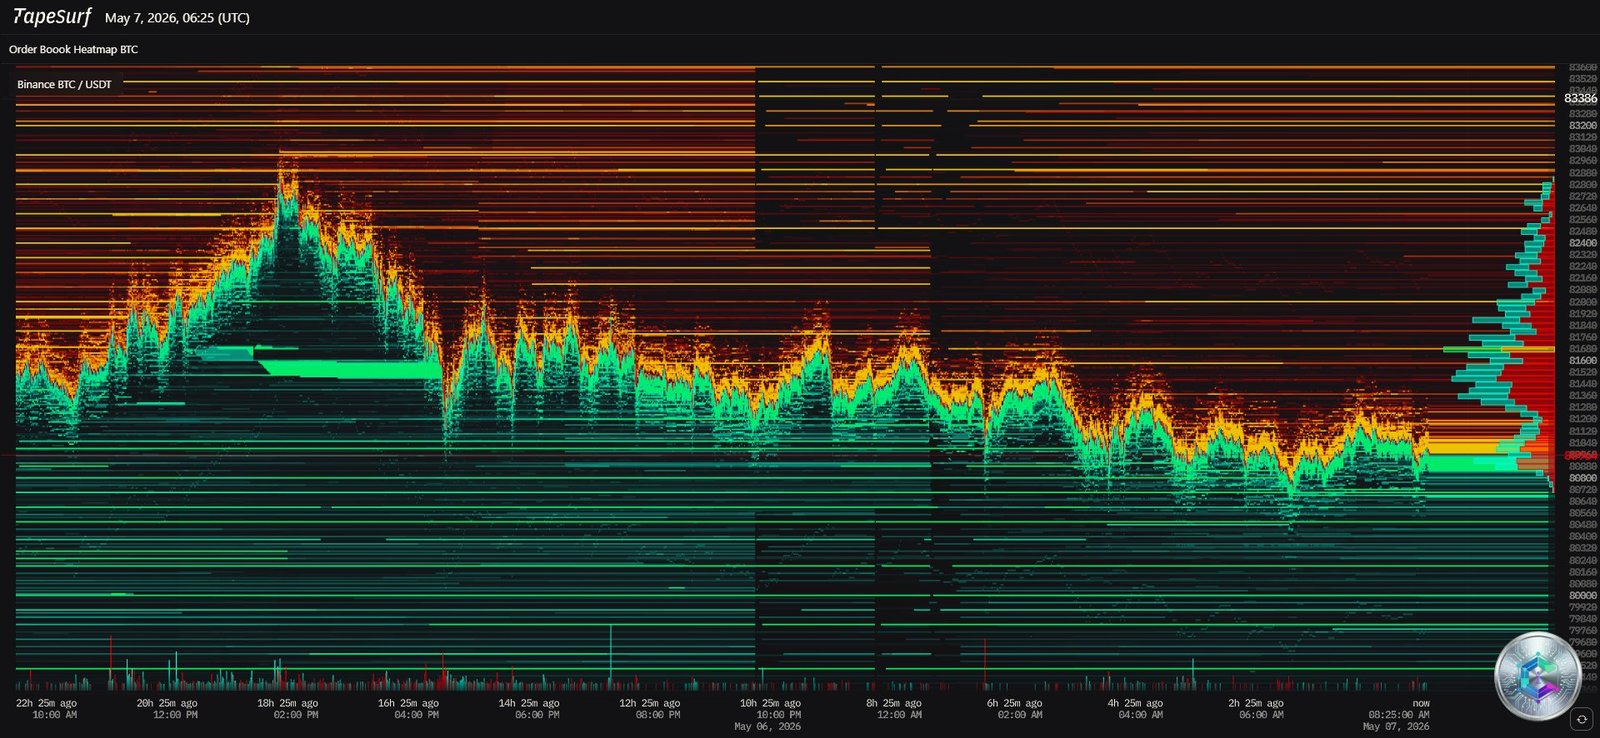
Above $82,000, the heatmap reveals a relative liquidity void between $81,000 and $82,100, explaining the erratic intraday price oscillations observed during the consolidation phase. Dense sell walls then re-emerge at $82,800, $83,200, and $84,000. The recent $500M liquidation cascade — including $270M in short positions — left a textbook « short squeeze » scar on the chart, driving prices parabolic. The current consolidation phase is repopulating the order book before the next expansionary move.
Macro-Technical Analysis: The Daily Chart
On the daily timeframe, Bitcoin has executed a clean breakout from a descending consolidation channel that had constrained price action since March 2026. This structural break signals a meaningful psychological regime change. The absolute line of demarcation between a bear market rally and a confirmed bull market remains the 200-day EMA, anchored between $82,000 and $83,218. The recent intraday test at $81,760 represents the market’s first serious assault on this algorithmic fortress.
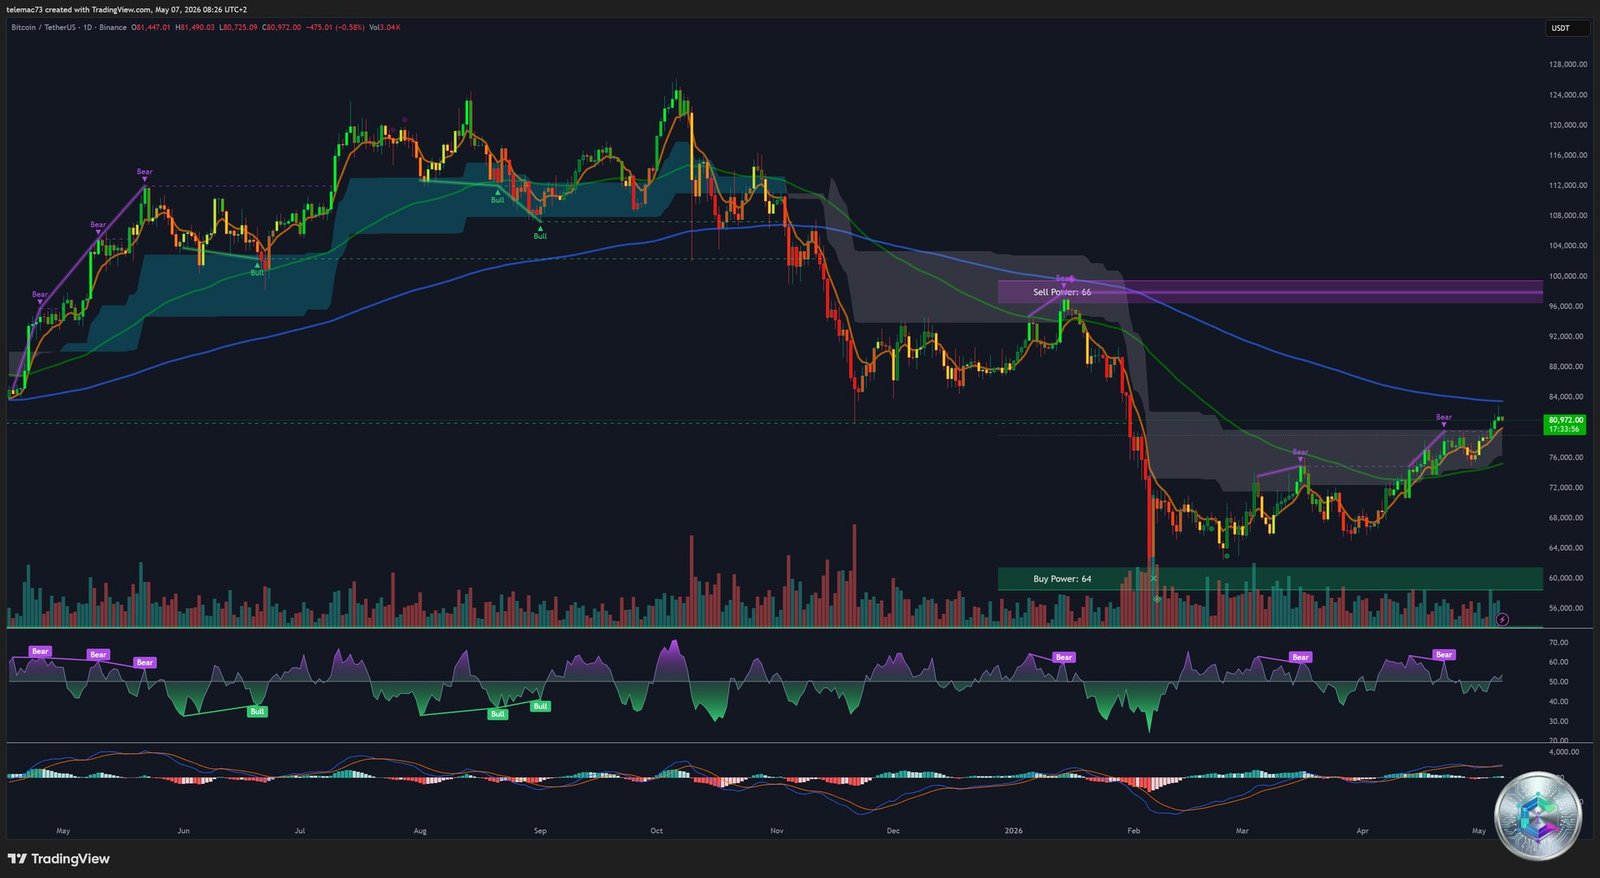
The most consequential technical development on this timeframe is the imminent formation of a Golden Cross: the 50-day moving average (currently ~$73,258) crossing above the 200-day moving average. Though a lagging indicator by nature, this signal mechanically triggers massive allocation mandates from systematic funds and trend-following algorithms. The oscillators confirm the underlying trend strength:
- RSI (14-day) at 66.3 — Comfortably bullish, with meaningful room before entering extreme overbought territory.
- MACD (12,26,9) at +2,080 — A robust buy signal; the deeply positive histogram confirms sustained institutional accumulation velocity.
- Stochastic Oscillator at 96.2 — Extreme overbought territory: a warning signal flagging elevated risk of a tactical pullback or extended lateral consolidation.
The current move was triggered by the resolution of a falling wedge pattern. Under Elliott Wave theory, the complex correction (Wave 2) appears complete, opening the door to an impulsive Wave 3 with theoretical targets stretching toward $90,000–$98,000 on a longer time horizon.
Intermediate Dynamics: The 4-Hour Chart (H4)
The H4 timeframe structure remains decisively bullish. Price is trading cleanly above its 50, 100, and 200-period moving averages in perfect bullish alignment. The polarity inversion at $80,000 — a multi-month resistance transformed into structural support — provides the chartist foundation of this analysis. Each successive trough is being bought at a higher level (higher lows), confirming persistent institutional appetite on dips.
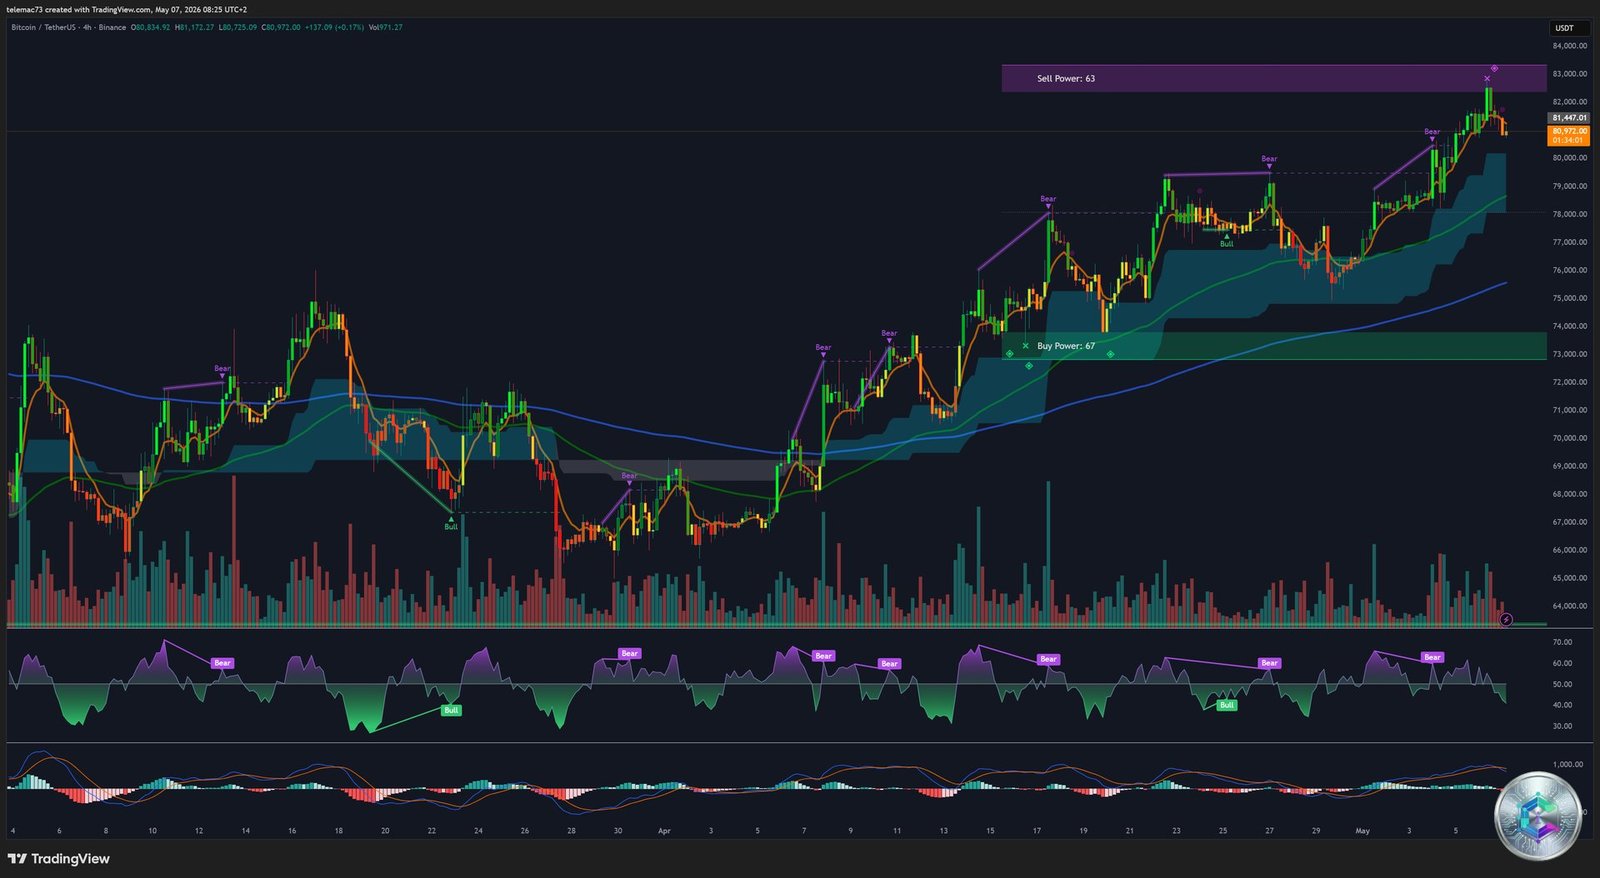
The key near-term caution signal is a bearish RSI divergence printed at the $82,800 high: price made a higher high while the RSI printed a lower high, indicating waning buying momentum. In a structurally bullish market supported by continuous ETF inflows, an H4 divergence rarely precedes a macro reversal. Its probabilistic interpretation points instead toward a controlled pullback or lateral consolidation designed to flush overleveraged late longs and rebuild a solid liquidity base ahead of a resumption toward $85,000.
Micro-Dynamics: H1 and 15-Minute Charts (M15)
On high-frequency timeframes, price has been navigating a complex corrective structure since the $82,800 local top. The M15 chart reveals classic bull flag formations — physiological pauses in the trend during which the asset transfers from speculative « weak hands » to longer-term holders. The progressive narrowing of price swings between the $80,600 support and local resistance zones is generating symmetrical compression triangles, whose resolution will serve as the immediate directional catalyst.
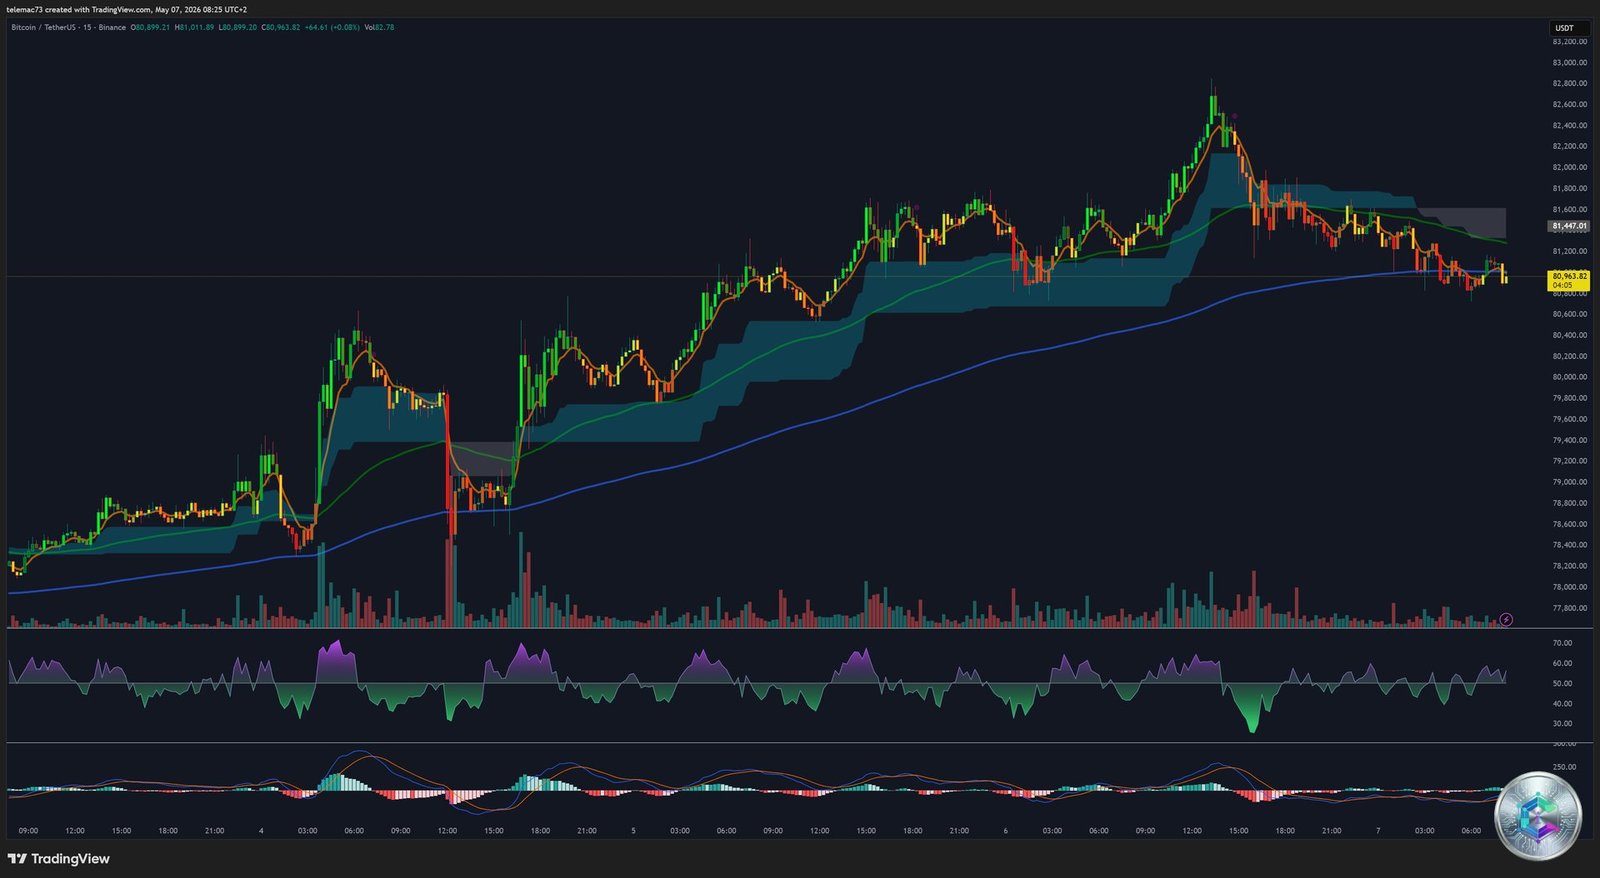
The absolute tactical pivot on these short timeframes sits precisely at $82,133. A clean, decisive H1 candle close above this level would mechanically trigger resting buy-stop orders and reinitialize the bullish momentum flow. Failure to reclaim this level increases the probability of an asymmetric re-test of the critical $80,000 structural floor.
Strategic Level Map
| Classification | Price Level (USD) | Rationale |
|---|---|---|
| 🎯 Cyclical Target | $98,000 | Fibonacci 200% extension, pre-$100K target |
| 🎯 Macro Target | $91,000 | Fibonacci 1.618 extension |
| 🎯 H4 Target | $85,000–$86,000 | Golden Cross continuation & H4 objective |
| ⚠️ Fibonacci Resistance | $84,000 | Fibonacci 1.272 extension, conservative profit zone |
| ⚠️ Major Resistance | $83,218 | 200-day EMA — the bull/bear market frontier |
| ⚠️ Local Top | $82,800 | Origin of the current correction |
| 🔑 Decisive Pivot | $82,133 | H1 close required to reactivate bullish momentum |
| 🛡️ H1 Support | $81,000 | 50-period MA on the 1-hour chart |
| 🛡️ Buffer Support | $80,600 | Primary short-term buyer defense line |
| 🏰 Major Floor | $80,000 | Validated polarity inversion + macro ascending trendline |
| 🔴 Danger Zone 1 | $79,700 | First liquidity purge target if $80,600 fails |
| 🔴 Danger Zone 2 | $78,700 | HFT algorithmic cascade target |
| 🔴 Secular Support | $78,197 | Macro-structural safety net |
| 🐋 Whale Zone | $75,000 | $500M absorbed — long-term institutional support |
Scenario Modeling
🟢 Scenario Alpha — Bullish Continuation (Primary Probability)
Full absorption of selling pressure above the $80,600 buffer initiates a coordinated algorithmic assault on the $82,133 pivot. A confirmed H1 candle close above this level triggers the mechanical execution of buy-stop orders, launching a re-test of the $82,800 high. The decisive moment arrives at the confrontation with the 200-day EMA ($82,000–$83,218): a confirmed daily close above this barrier certifies an algorithmic regime change, propelling price into price discovery toward $84,000, then $85,000–$86,000. Deteriorating US labor data (jobless claims >205,000) would serve as the ideal macro catalyst to ignite this scenario, forcing the market to price in Fed rate cuts.
🔴 Scenario Beta — Structured Consolidation and Pullback (Alternative)
The daily Stochastic at 96.2 and the H4 bearish RSI divergence flag a growing risk of a physiological correction. Rejection above $81,000 breaks the $80,600 buffer, forcing HFT systems to liquidate late long positions. This cascade would target the $80,000 psychological floor, defended by the primary ascending trendline. A breach of this citadel would expose $79,700, $78,700, and $78,197 as downside targets. Crucially, any sustained dip into the $75,000–$78,000 zone would be viewed by institutional whales as a generational re-accumulation opportunity — prefacing an even more powerful resumption of the bull trend.
Conclusion
Bitcoin in May 2026 embodies a fundamental ontological transformation: from a marginal speculative instrument to an indispensable institutional infrastructure layer. The convergence of inelastic BlackRock and Fidelity ETF flows, an imminent daily Golden Cross, massive buy walls anchored at $80,000, and a macroeconomic environment tilting toward monetary easing paints a structurally bullish picture.
The next decisive sequence hinges on Bitcoin’s ability to close above $82,133 (tactical pivot) and then $83,218 (200-day EMA). This double validation would transform the current rally into a definitive structural paradigm shift, opening the price discovery phase toward $85,000–$98,000. Until then, the $80,000 zone represents far more than a technical support level — it is the psychological threshold marking Bitcoin’s entry into a new era of financial maturity.
⚠️ Disclaimer: This article is published for educational and informational purposes only. It does not constitute investment advice or a recommendation to buy or sell any financial or digital asset. Cryptocurrency markets are highly volatile and carry significant risk of capital loss. Any investment decision should be made only after consulting a qualified financial advisor and in accordance with your personal risk profile.

