
As the third quarter of 2026 approaches, Bitcoin (BTC/USD) is navigating a period of rare structural redefinition. After reaching an all-time high of $126,272 in October 2025, the flagship digital asset endured a severe macroeconomic correction, breaking below the critical psychological threshold of $60,000 and touching a local low of $58,115 on June 24, 2026 — its lowest level since late 2024. This depreciation is not the product of irrational retail panic, but rather the result of a complex convergence of systemic, institutional, and macroeconomic pressures that we dissect in full below.
1. The Macroeconomic Environment: The Fed Stays Hawkish
Bitcoin’s valuation in June 2026 is intimately tied to global liquidity conditions, which are dictated by the US Federal Reserve. Contrary to early-year expectations of monetary easing, inflation proved remarkably resilient. The latest CPI and PCE data for May delivered a hawkish shock to markets, confirming that price growth remains well above the 2% annual target.
At its June 18, 2026 meeting, the Fed kept its benchmark rate in the elevated range of 3.50%–3.75%. More critically, the updated dot plot revealed a pronounced hawkish pivot: nine of the eighteen committee members now anticipate at least one additional rate hike before end of 2026, pushing the median projected rate to 3.8% from 3.4% in March. Implied market probabilities for a December 2026 hike jumped from 24% to 77% in a single month, propelling the US dollar to its strongest level in 13 months. This environment applies direct downward pressure on non-yielding assets like Bitcoin.
2. Geopolitics: The Precarious Balance of the Strait of Hormuz
The first half of 2026 was defined by a 110-day armed conflict involving the US, Israel, and Iran, severely disrupting global supply chains. A preliminary Memorandum of Understanding signed in mid-June aimed to end hostilities and reopen the Strait of Hormuz — the critical transit point for global oil flows.
However, the theoretical de-escalation failed to restore market confidence. Iran reportedly deployed approximately 80 naval mines (Maham 3 and Maham 7 models), specifically designed to evade Western minesweeper sonar systems. An incident involving the container ship Ever Lovely even forced the IMO to suspend the evacuation of 2,500 sailors stranded in the Gulf. Persistent uncertainty over the strait’s security maintains elevated risk premiums that dampen speculative appetite.
3. Institutional Rotation: Competing with Artificial Intelligence
The demand structure for Bitcoin has fundamentally changed in 2026. The correction below $60,000 is largely explained by the aggressive rotation of institutional capital toward AI and semiconductor equities. In a Fed-constrained liquidity environment, available capital prioritizes returns backed by tangible earnings growth.
Bitcoin finds itself caught in a vise: abandoned in favor of AI during expansion phases, and sold first during risk-off contractions. This disaffection is visible in crypto sector valuations — Morningstar revised its fair value estimate for Coinbase (COIN) down to $150, justified by a 50%+ collapse in total crypto market capitalization (falling to ~$2 trillion).
4. Bitcoin Spot ETF Dynamics: The Institutional Hemorrhage
US Bitcoin Spot ETFs — the primary catalyst of the 2024–2025 bull run — became the dominant vehicle of institutional selling pressure in June 2026. Their flows now represent the true marginal buyer or seller of the market:
| Period (June 2026) | Net US BTC Spot ETF Flows | Implication |
|---|---|---|
| First week of June | −$3.4 billion | All-time record outflows; largest weekly exodus since ETF inception |
| Week ending June 6 | −$1.72 billion | Worst weekly performance since February 2025 |
| June 17–24 | −$1.35 billion | 7th consecutive week of outflows |
| June 24 (single day) | −$469 million | Direct catalyst for the $60,000 support breach |
BlackRock’s iShares Bitcoin Trust (IBIT) recorded its worst week ever in early June, bleeding nearly $980 million, including a single-day record of $448M and a colossal $1.29B dark pool block transaction. That said, a nuanced reading is warranted: US Bitcoin Spot ETFs still hold approximately $100 billion in AUM. The current behavior resembles a cyclical profit-taking event rather than a structural abandonment of the Bitcoin thesis.
5. Systemic Corporate Risk: The MicroStrategy (MSTR) Problem
MicroStrategy holds a treasury of 847,363 Bitcoins as of June 2026, acquired at an average cost of $75,651 — representing over 4% of the total circulating supply. With spot prices hovering around $58,800, this position carries an unrealized loss of approximately $14.3 billion. The company also carries $8.2 billion in debt, including Variable Rate Perpetual Preferred Stock (STRC) that has collapsed to a historical low of $75 (par value: $100).
A symbolic and alarming development: MicroStrategy was forced to sell 32 net Bitcoins — the first net reduction of its position in over three years — to fund STRC dividends. MSTR stock plunged 36% over eight consecutive sessions, massively underperforming Bitcoin’s own 10% decline. The « death spiral » risk looms: continued price depreciation could force a liquidation of a fraction of MicroStrategy’s 847,000 BTC, flooding the market with supply that current liquidity cannot absorb.
6. Options Expiry, Short Gamma, and Liquidation Cascades
On June 26, 2026, approximately $10 billion in notional Bitcoin options expired on Deribit. The majority of bullish Calls expired worthless. Meanwhile, the $60,000 level concentrated over $1.2 billion in Put open interest. Market makers positioned in short gamma were algorithmically compelled to sell Bitcoin to dynamically hedge their books, mechanically amplifying the decline.
The drop triggered a brutal purge of leveraged positions: $1.73–$1.85 billion in contracts were force-liquidated within 24 hours, affecting over 291,000 traders. Long liquidations accounted for ~$780–800M. After the June 26 expiry, the short gamma algorithmic pressure neutralized, allowing a modest relief rally back toward $61,000.
7. Order Book Heatmap Analysis: Mapping the Liquidity Landscape
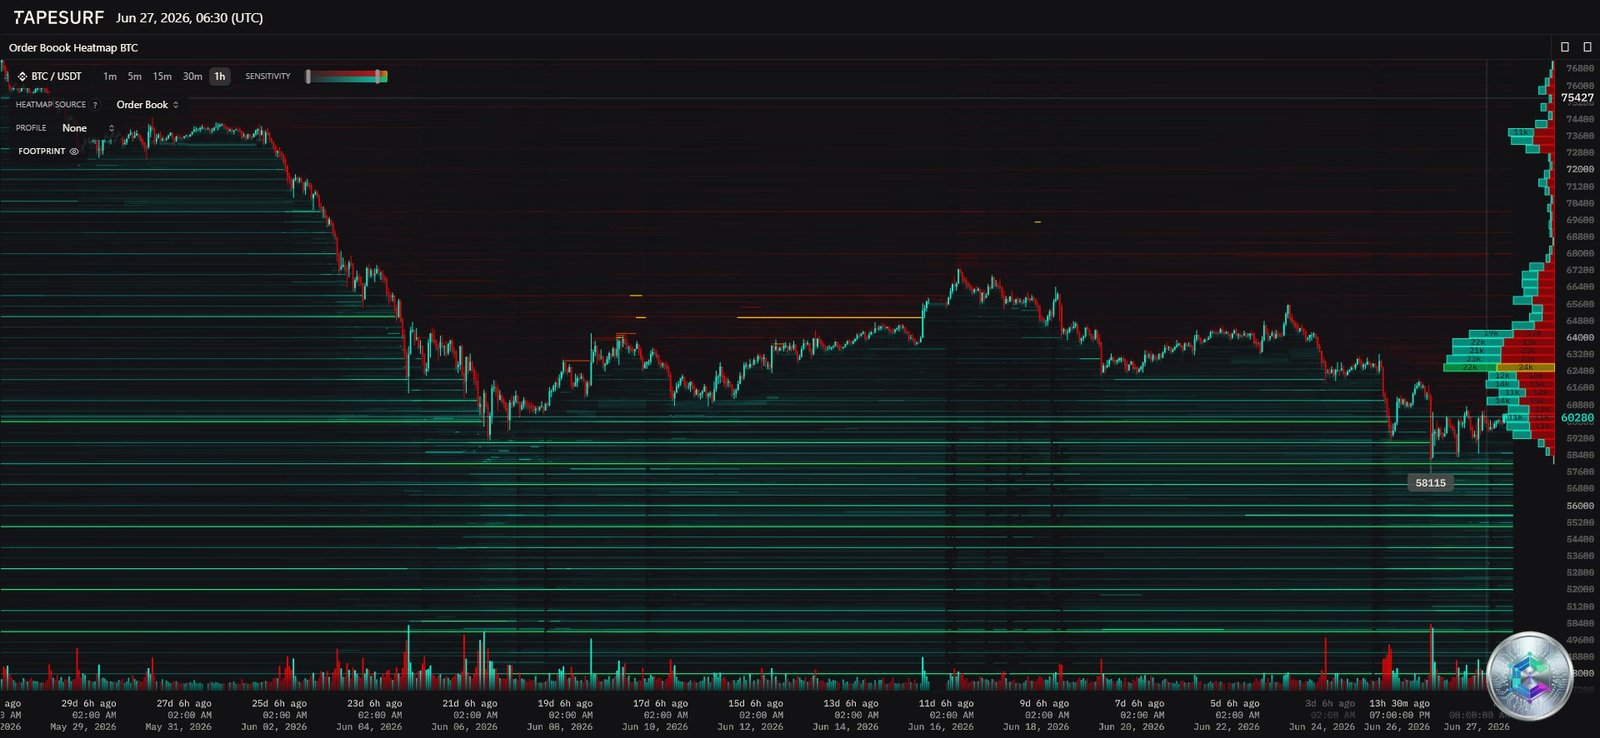
The Heatmap reveals a market framed by asymmetric liquidity pockets:
| Price Zone (USD) | Liquidity Type | Strategic Analysis |
|---|---|---|
| $70,000 – $72,000 | Isolated short clusters | Distant resistance requiring a full macro regime change |
| $68,000 – $69,000 | Major short cluster | Potential macro Short Squeeze zone |
| $63,000 – $64,000 | Dense short concentration | Primary upper liquidity target |
| $61,500 – $62,300 | Crushing liquidity wall | Immediate glass ceiling against any recovery attempt |
| $59,000 – $61,000 | Current No Man’s Land | Post-liquidation consolidation zone |
| $57,300 – $58,700 | Residual long clusters | Last-resort vital support level |
| $50,000 – $52,000 | Options Put macro target | Potential landing zone if $57,000 fails |
8. Multi-Timeframe Technical Analysis
📊 Daily Chart: Macro Bearish Structure
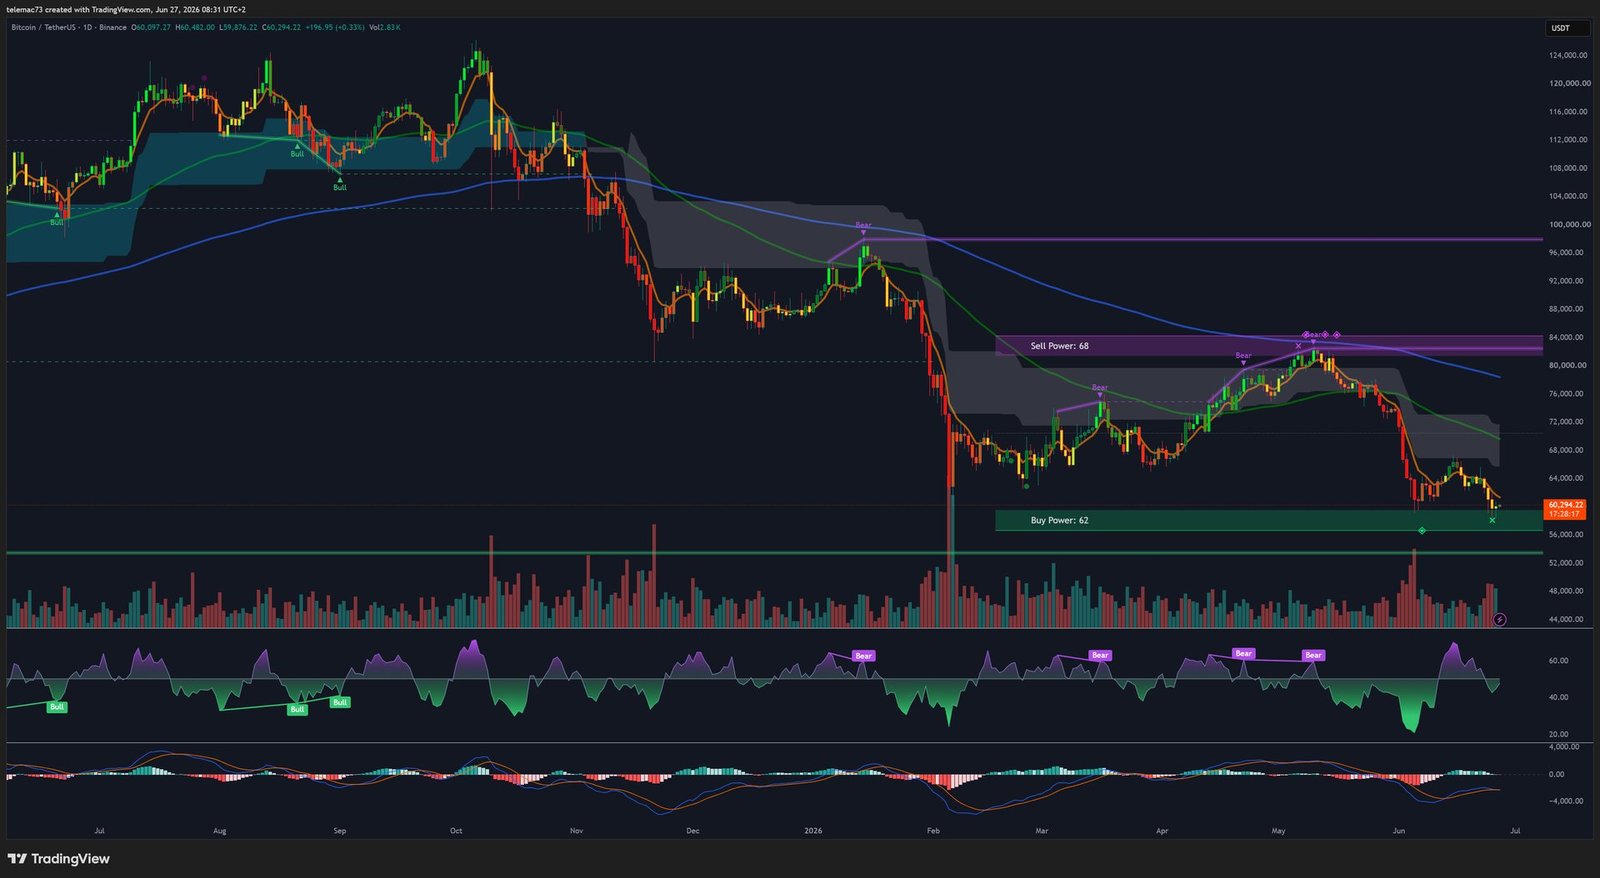
The daily chart depicts an unmistakably bearish structure — a relentless sequence of lower highs and lower lows since the post-ATH correction. Key observations:
- Major Confluence Support ($57,885 – $58,725): convergence of the 61.8% Fibonacci retracement of the 2022–2025 bull cycle, the August 2024 weekly low close, the lower boundary of the Andrews’ Pitchfork, and the long-term ascending trendline from 2023.
- 50-Day EMA at ~$68,000: coincides with the High Volume Node (HVN) from the Volume Profile. This is the true demarcation line between bear market and cycle recovery.
- Daily RSI: plunged into extreme oversold territory (<30) during the $58,115 test, with a minor bullish divergence forming — a signal of terminal exhaustion of selling pressure.
- MACD: Death Cross confirmed weeks ago, histogram deeply negative, but showing early signs of bearish momentum fading — potential precursor to a consolidation base.
📊 4-Hour Chart: Bear Flag and Bullish Divergences
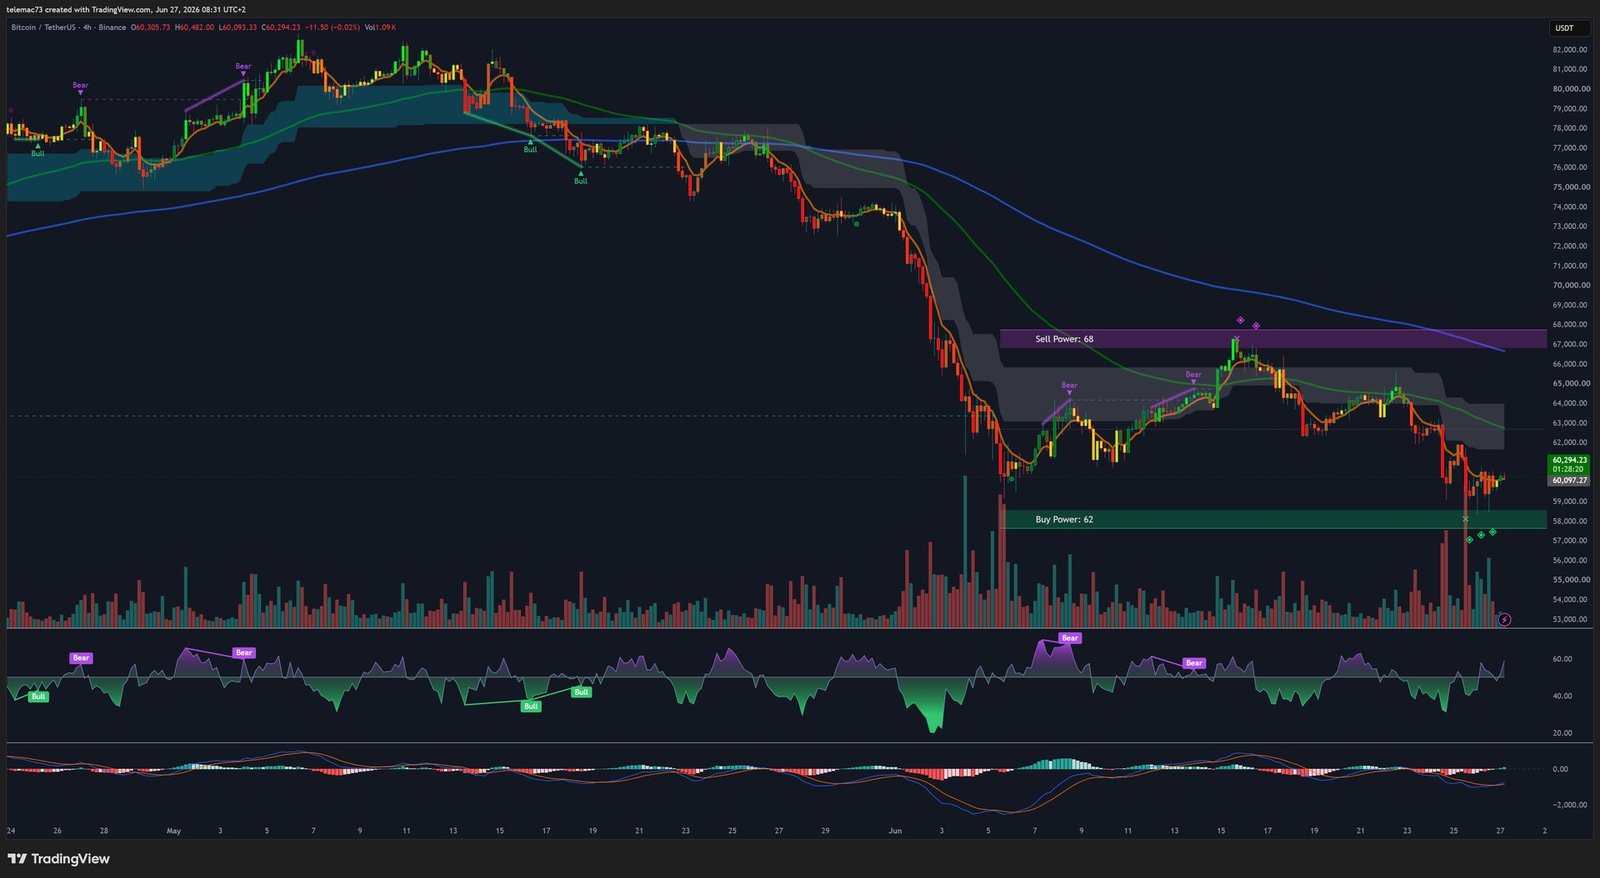
The 4H timeframe reveals post-breakdown market psychology patterns:
- Bear Flag: from the $58,700 low, the bounce toward $61,000 forms a constrained ascending channel with anemic buying volume — a textbook bearish continuation pattern. Failure to clear $62,300 (heatmap wall) projects a target toward $50,000–$52,000.
- 4H RSI Bullish Divergence: at the double-bottom near $58,000, price printed a marginally lower low while RSI printed a higher low — the technical catalyst that fueled the recent relief rally.
- 4H MACD: Aborted Golden Cross below the zero line. The histogram struggles to sustain positive expansion, at risk of reversing on renewed ETF outflows.
📊 15-Minute Chart: Intraday Micro-Structure
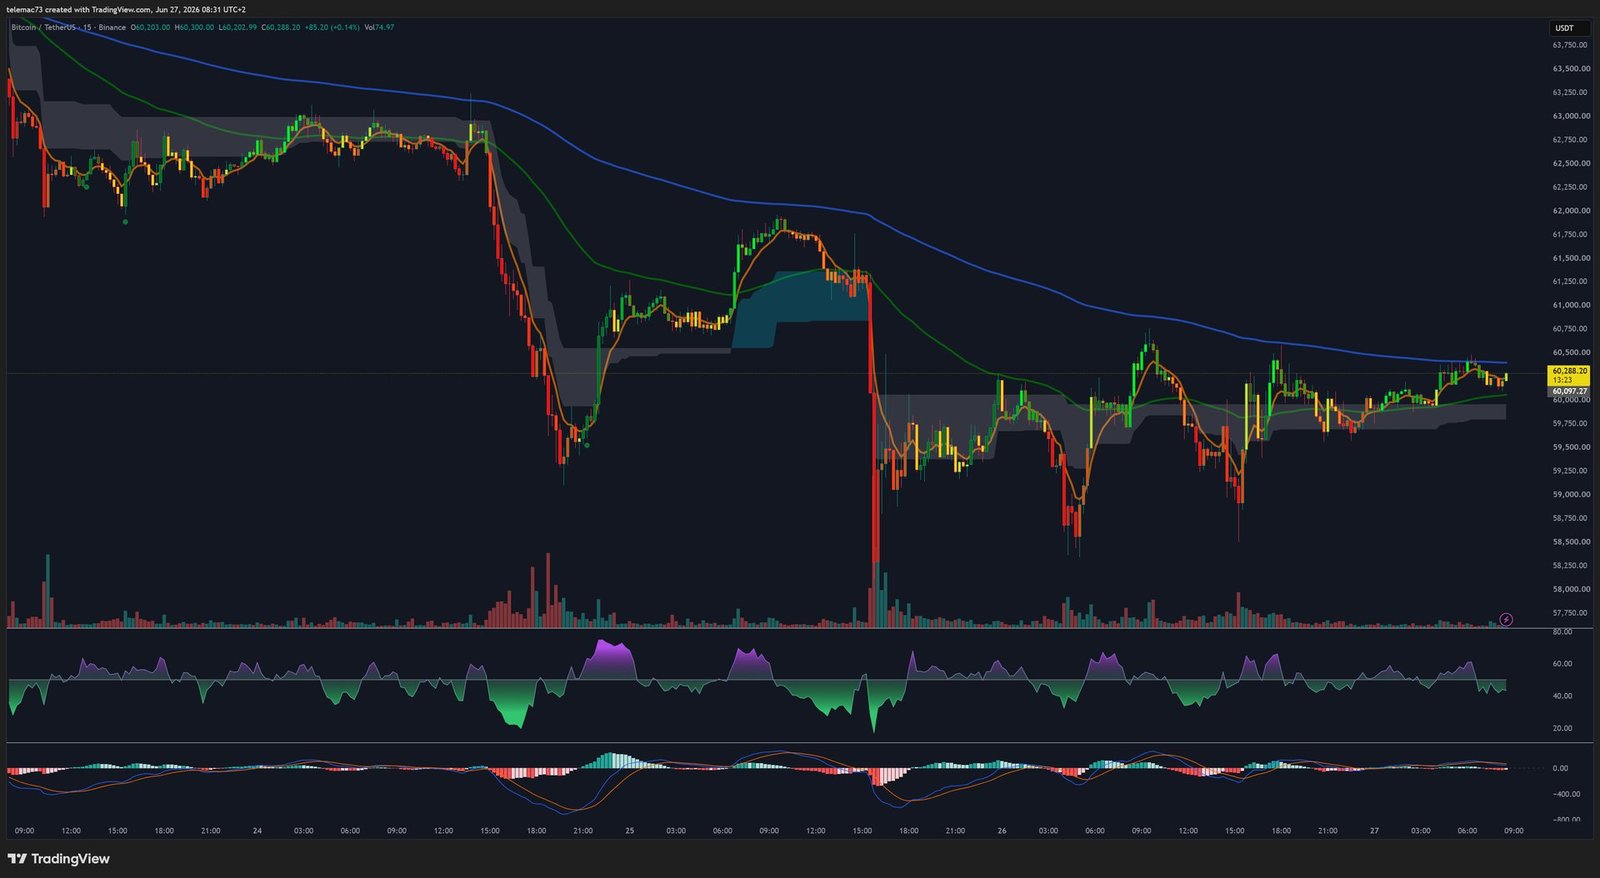
The 15M chart reveals the market « noise, » essential for short-term operators seeking liquidity inefficiencies:
- Symmetrical Triangles: since the post-liquidation bounce, price has been inscribing progressively tighter compression triangles, with volatility contracting violently around a pivot at ~$60,500.
- Short-term EMAs (9, 21, 50 on 15M): continuously intertwining, generating false signals (whipsaws) — the signature of a market in absolute indecision, suspended to macro news flow.
- Key Intraday Levels: S1 support fiercely defended at $59,700, R1 resistance capping at $61,500. Every rally is systematically rejected upon entering the first heatmap liquidation layer.
9. Strategic Synthesis: Two Scenarios Head-to-Head
🐻 Bearish Scenario (Bear Case) — Capitulation toward $50,000–$52,000
If Bitcoin Spot ETF outflows extend beyond the seventh consecutive week, selling pressure will overwhelm the algorithms defending the Fibonacci level at $57,885. Confirmation of the 4H Bear Flag would trigger a stop hunt on the longs accumulated around $57,300. A panic driven by MicroStrategy’s financial difficulties could initiate a self-reinforcing sell spiral toward the options market’s macro target: $50,000–$52,000 (historical average investor cost basis — a robust cyclical floor).
🐂 Bullish Scenario (Bull Case) — Reversal toward $68,000
June’s massive outflows (over $3B) may represent a final capitulation event, purging weak hands from the market. With the $10.5B Deribit options expiry complete, the short gamma algorithmic pressure is neutralized. If the daily double-bottom at $58,000 is confirmed and Q3 inflation data shows meaningful deceleration, Bitcoin will begin reclaiming its order book. The sine qua non condition: destruction of the supply wall between $61,500 and $63,000. A breakout above this level would trigger an immediate Short Squeeze, propelling prices toward the 50-day EMA at $68,000.
For the professional portfolio manager, the current environment demands strict directional neutrality until the compression zone resolves. The risk/reward ratio is beginning to asymmetrically favor strategic long positions approaching the $57,000–$58,000 zone, provided a hard stop is applied on any daily close below $57,300.
Conclusion
Bitcoin is facing its most severe decade-defining stress test in June 2026. The asset is trapped in a systemic vise: the resilience of a multi-year technical support at $58,000 pitted against a combined assault of elevated interest rates, fierce AI competition for capital allocation, and MicroStrategy’s debt-driven insolvency risk. The outcome of this test will determine whether Bitcoin retains its legitimacy as an institutional macroeconomic reserve asset heading into 2027.
⚠️ Disclaimer
This article is published for informational and educational purposes only. It does not constitute investment advice, or a recommendation to buy or sell any financial or cryptographic asset. Cryptocurrency markets are highly volatile and speculative. Any investment decision should be made based on your own analysis, risk profile, and, where appropriate, with the assistance of a licensed financial advisor. Past performance is not indicative of future results. CryptoInfo.ch assumes no responsibility for investment decisions made on the basis of this article.