
Bitcoin enters the second half of 2026 on the defensive. After peaking near $126,000 in October 2025, the asset has shed more than half its value and is now trading around $58,500. With a new, unpredictable Federal Reserve chair, record outflows from Spot ETFs, and a bearish reversal pattern forming on the daily chart, we break down the forces that will shape BTC’s trajectory through July.
A macroeconomic environment under pressure
The end of forward guidance under Kevin Warsh
On May 22, 2026, Kevin Warsh was sworn in as the 17th Chair of the Federal Reserve, succeeding Jerome Powell amid heated political tension. At his very first FOMC meeting, he pushed through a radical shift in central bank communication: the abandonment of forward guidance, the mechanism that had let markets anticipate the future rate path since 2003. Markets have lost their traditional compass, translating into sharper volatility around every economic data release and a higher risk premium on digital assets.
Restrictive rates against resurgent inflation
The FOMC unanimously held its benchmark rate in a 3.50%–3.75% range in June, a stance justified by CPI rising 4.2% year-over-year, a three-year high. At the ECB’s Sintra forum on July 1, Warsh firmly reaffirmed the Fed’s independence, dismissing any hope of a « Fed put » until inflation returns durably toward the 2% target. This restrictive policy drains global liquidity and raises the opportunity cost of holding crypto against risk-free Treasury yields.
| Indicator | Date (July 2026) | Potential impact |
|---|---|---|
| US Non-Farm Payrolls (NFP) | July 2 | Direct influence on rate expectations |
| FOMC Minutes (first under Warsh) | July 8 | Insight into the new doctrine, without forward guidance |
| CPI (June inflation) | July 14 | A print above 4.2% would reinforce the hawkish stance |
| FOMC rate decision | July 29 | Binary impact on institutional flows |
A historic supply overhang
June 2026 will be remembered as the worst calendar month for US Spot Bitcoin ETFs since their launch, with net outflows of $4.51 billion. This capital flight partly reflects profit-taking after 2025’s rally, but also a sector rotation toward AI-linked equities. At the same time, the market must absorb a supply overhang estimated at $4.4 billion, largely stemming from revised capital-allocation policies at several major corporate holders.
The Exchange Whale Ratio, which tracks the share of large inbound transfers to exchanges, climbed to 0.69, a level historically associated with liquidation pressure from large players. On June 19, a similar spike (0.67) preceded an instant 6.3% price drop.
Multi-timeframe technical analysis
Daily: the Head-and-Shoulders threat
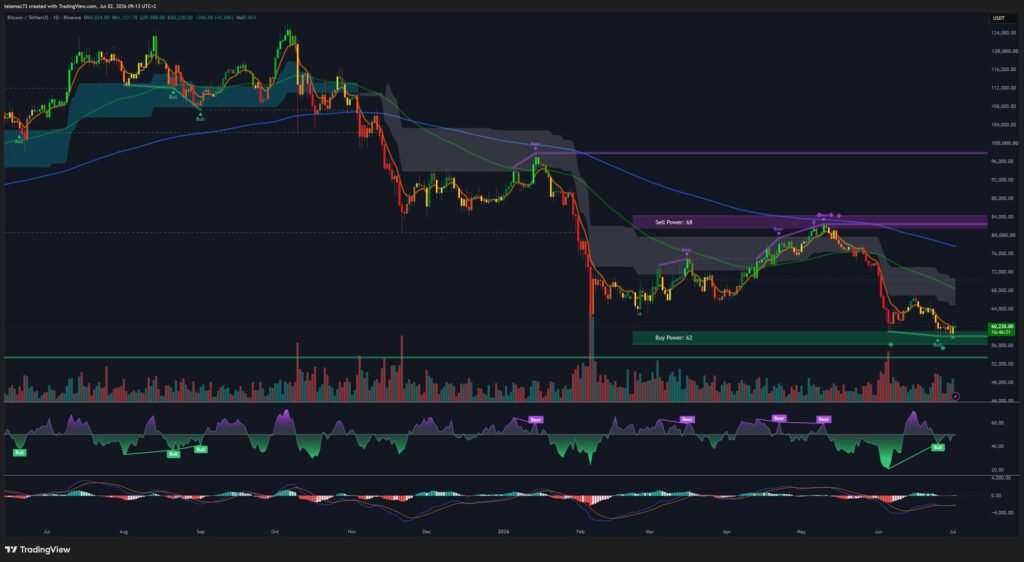
June’s monthly close flipped the $60,000 zone from support to resistance. The daily chart is now shaping a classic reversal pattern: a Head-and-Shoulders top, with a lower third peak signaling buyers’ inability to reignite bullish momentum. A confirmed close below the neckline, around $57,891, could theoretically project a further decline of roughly 26%.
The 200-Week Moving Average, sitting between $59,000 and $61,000, is the macroeconomic waterline of the current cycle. The daily RSI is approaching oversold territory, echoing a Fear & Greed Index that fell to 11 (Extreme Fear) on July 1 — sentiment extreme enough to sometimes fuel a technical bounce, though it offers no guarantee of a trend reversal.
4-hour: compression and the MACD battle
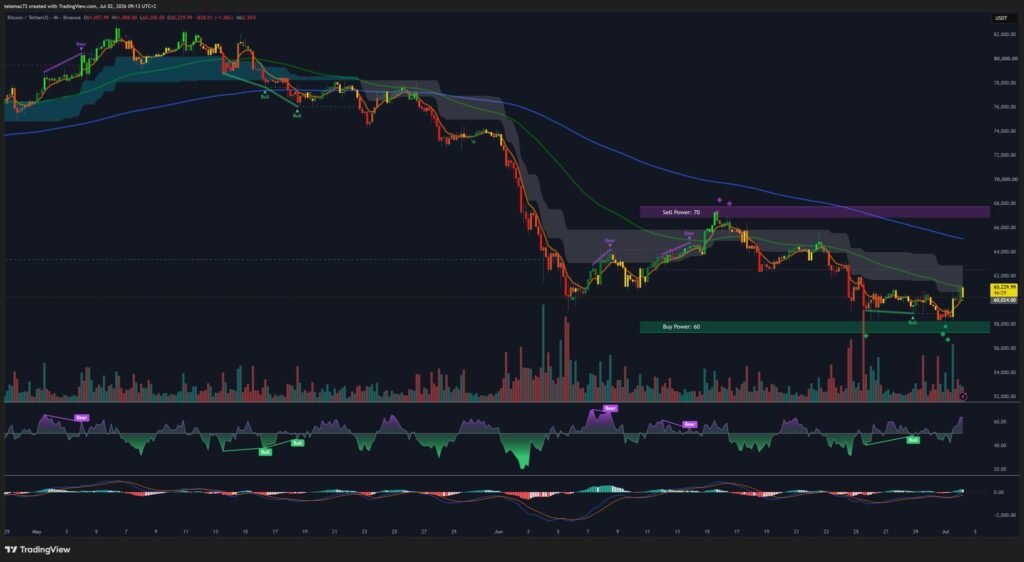
Following June’s capitulation, price has settled into a symmetrical compression triangle resembling a bearish continuation flag. Declining highs are capped by the 50-period EMA, while lows struggle to hold a horizontal floor near $58,500. The MACD, still deep below its zero line, is attempting a short-term bullish crossover: confirmation would open the way toward the $60,000 pivot, while failure would likely signal bearish continuation.
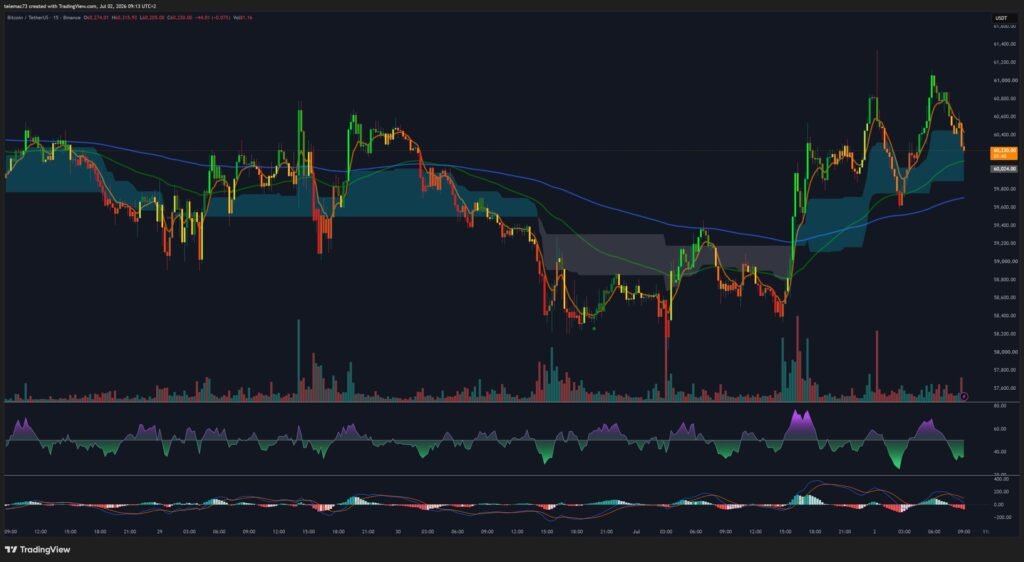
15-minute chart and heatmap: the liquidity battle
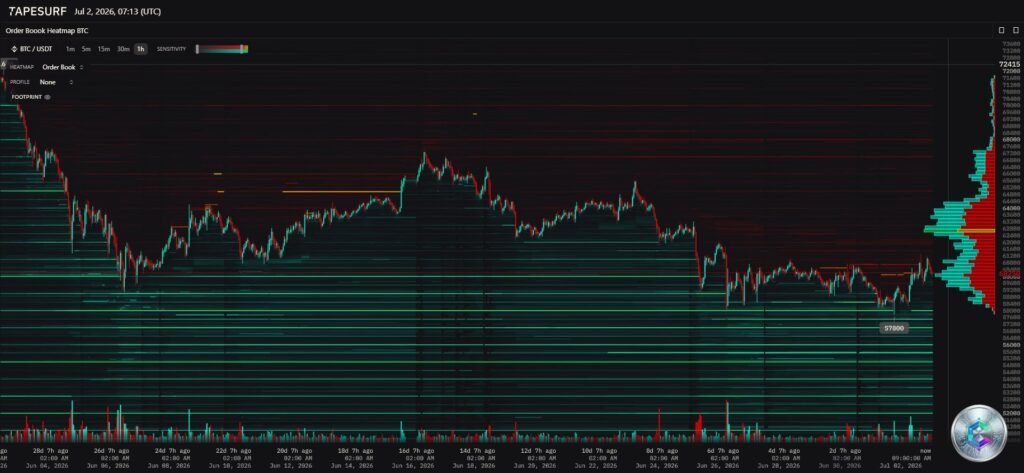
With no clear macro cues, 15-minute market microstructure is dominated by algorithmic activity around the intraday pivot at $59,101. The order book heatmap reveals two critical zones: a dense sell wall between $60,500 and $61,000, coinciding with the 200-WMA, and buyer support around $57,620. Below that level, the order book thins out sharply — the next significant liquidity pocket sits in the $53,800–$54,000 range, matching the on-chain « Realized Price. »
| Level (BTC/USD) | Nature |
|---|---|
| $60,500 – $61,000 | Major resistance / 200-WMA / sell wall |
| $60,000 | Psychological resistance |
| $59,101 | Intraday M15 pivot |
| $57,891 – $58,000 | Daily support / H&S neckline |
| $57,620 | Intraday M15 support |
| $53,800 – $54,000 | On-chain support (Realized Price) |
Fundamental catalysts to watch
July seasonality: between 2013 and 2025, Bitcoin closed July in positive territory 9 out of 13 times, with an average return of 7.25%. But the current restrictive-rate environment differs structurally from prior cycles, and Q3 as a whole has historically been sluggish (median return of just 1.84%).
MiCA goes live: July 1 marks the effective start of the EU’s Markets in Crypto-Assets regulation. Exchanges have had to restructure their liquidity pools, thinning European order books and raising the risk of flash crashes should overhang supply be dumped aggressively.
The political dimension: a financial disclosure report published July 2 shows Donald Trump generated between $1.2 and $1.4 billion in crypto-related income over the past year — a windfall that strengthens the industry’s lobbying weight in Washington as the « CLARITY Act » moves through the Senate.
Altcoins: a widening split between Ethereum and Solana
While Bitcoin dominance holds at 55.3%, major alternative-asset trajectories are diverging sharply. Ethereum is closing out a third consecutive red quarter, with the ETH/BTC ratio down 16% for the quarter, weighed down by seven straight weeks of Spot ETF net outflows. Solana, by contrast, shows remarkable resilience, posting a weekly outperformance above 8%, driven by growing institutional adoption and dominance in tokenized-equity trading.
| Asset | Price (July 2026) | Dynamics | Expected catalyst |
|---|---|---|---|
| Ethereum (ETH) | $1,570 – $1,590 | Deep degradation, ETH/BTC ratio at lows | « Glamsterdam » upgrade (H2 2026) |
| Solana (SOL) | $73 – $75 | Strong resilience, attempting to reclaim its uptrend channel | JTX terminal, Firedancer rollout |
| Sui (SUI) | $0.57 – $0.70 | Bearish pressure from token unlocks | Growth in DeFi TVL |
| Hyperliquid (HYPE) | $64.76 | Relative uptrend | Demand for decentralized derivatives |
Three scenarios for July
- Bear case: persistent inflation and continued ETF bleeding confirm a break of the H&S neckline below $57,891, opening the way toward $53,800–$54,000 and potentially the upper $40,000s.
- Sideways case: mixed data keep price locked in a compression range between $58,000 and $61,000, in a low-directionality climate prone to fakeouts.
- Bull case: dovish macro surprises, a receding Exchange Whale Ratio, and ETF flows turning positive again allow the market to absorb the $60,500–$61,000 sell wall, opening the way toward $65,000–$70,000.
Conclusion
Bitcoin heads into July 2026 in a climate that demands particular analytical rigor. The first half’s value destruction has purged much of the speculative excess, but the restrictive macro environment under Fed Chair Kevin Warsh, combined with heavy institutional outflows and a fragile technical structure, calls for caution. Everything hinges on the decisive battle to reclaim the 200-Week Moving Average — the ultimate financial pivot for the leading digital asset.
Disclaimer: This article is published for educational and informational purposes only. It does not constitute investment advice, a recommendation to buy or sell, or a financial solicitation. Cryptocurrency markets are highly volatile and carry a risk of capital loss. Always do your own research (DYOR) and consult a licensed financial advisor before making any investment decision.