
Market Context: Between Flash-Crash and Institutional Accumulation
Bitcoin is currently consolidating in a post-flash-crash zone, triggered by the geopolitical tensions surrounding the Israeli-Iranian conflict. Trading around $66,226, the BTC/USDT pair presents a complex technical profile: bearish on higher timeframes, yet increasingly punctuated by seller exhaustion signals.
The two defining macro catalysts for the coming weeks remain the CPI release on March 11 and the FOMC meeting on March 18. These events could set Bitcoin’s trajectory for the entire month.
15-Minute Analysis — Short-Term Readings
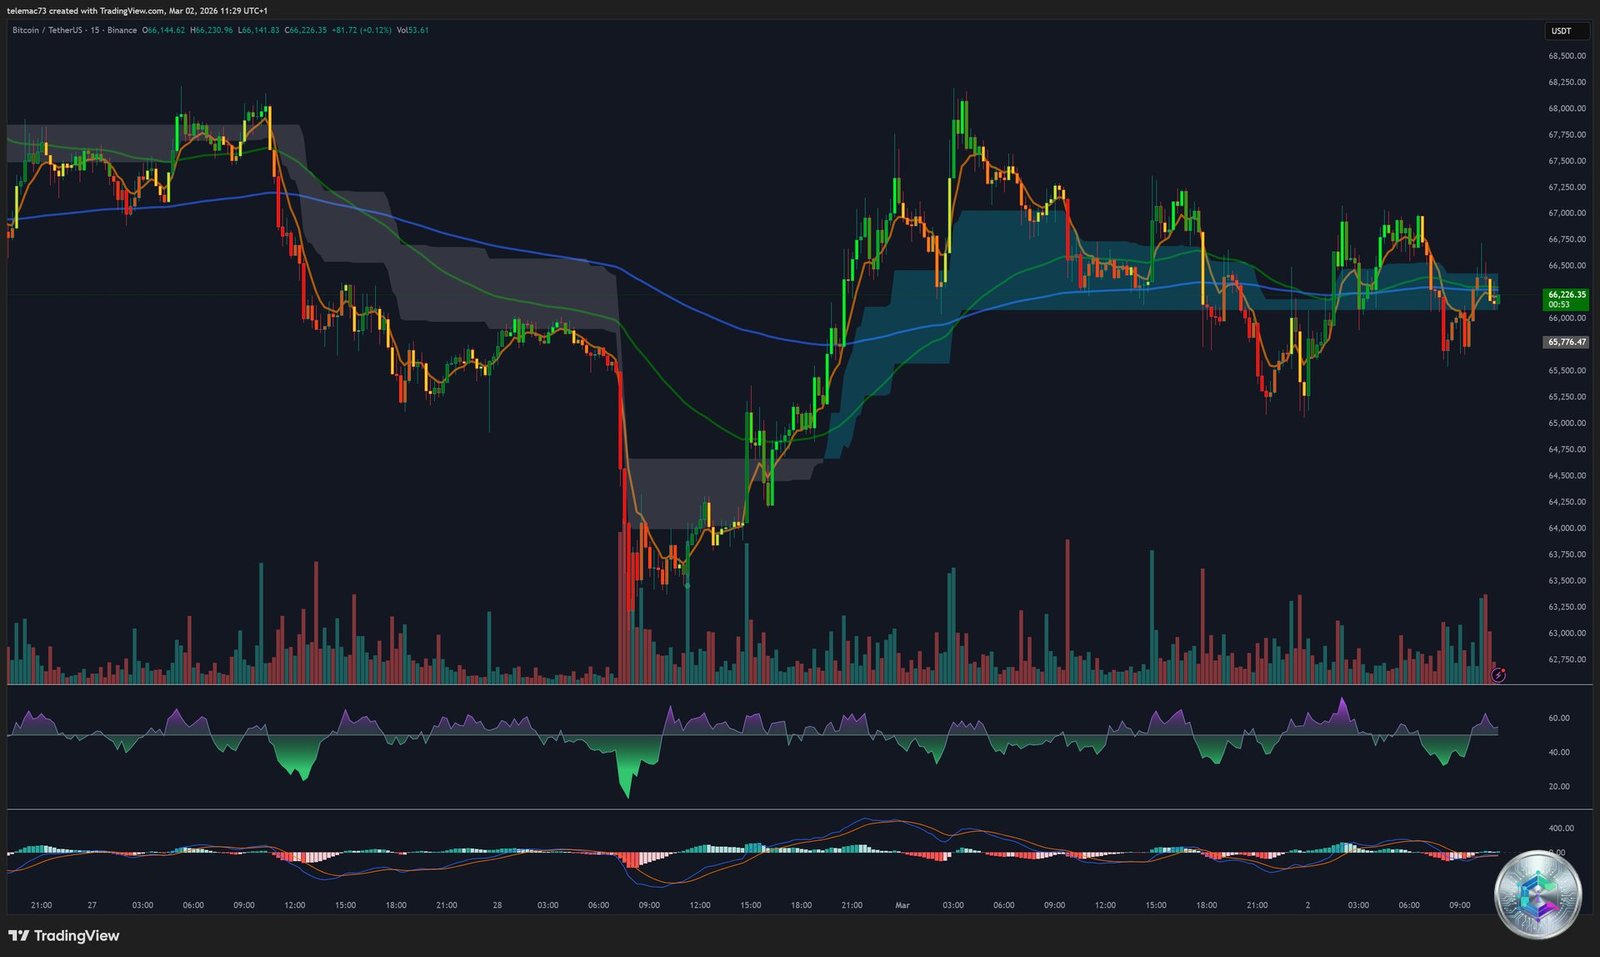
On the 15-minute chart, Bitcoin shows a stabilization attempt following the sharp volatility induced by geopolitical news. Short-term candles reveal significant lower wicks — a sign that buyers are actively absorbing selling pressure at each retracement.
- Immediate support: $65,500 (recent congestion zone)
- Resistance to watch: $67,200 (last reversal pivot)
- Key signal: An hourly close above $67,200 would open the path toward $68,000
4-Hour Analysis — The Intermediate Structure
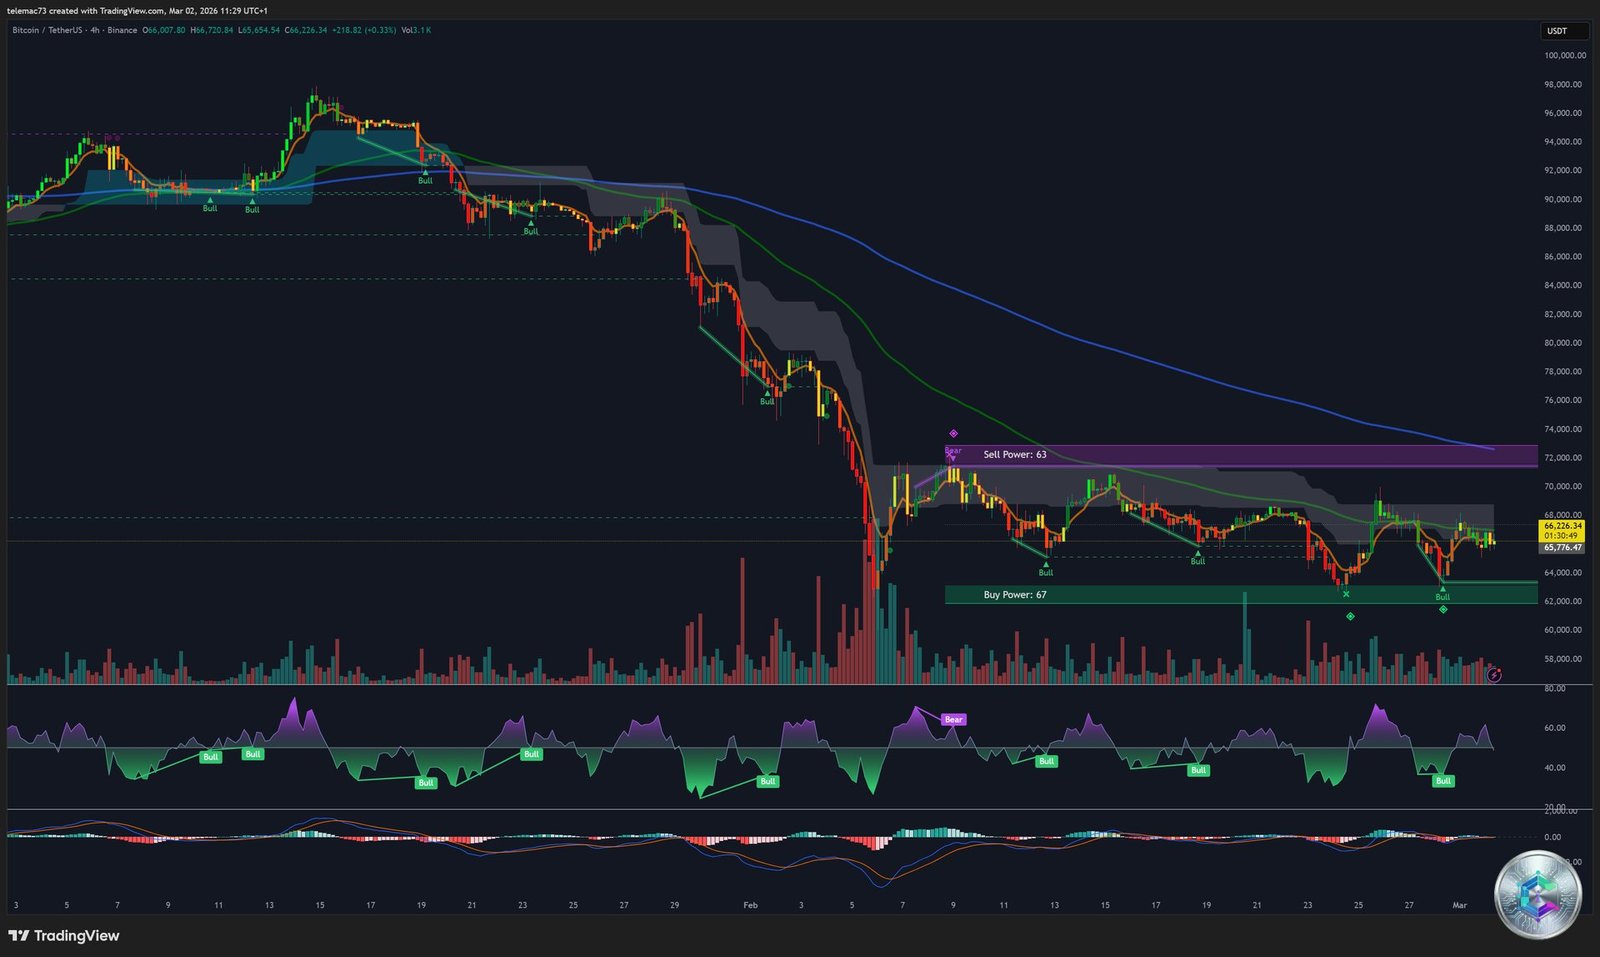
The 4-hour timeframe provides a clearer reading of the current market structure. A medium-term downtrend is visible, with a series of lower highs since the recent peak. However, the current formation resembles a descending wedge — a classic pattern that often precedes a bullish reversal.
- EMA 50 (4H): Dynamic resistance to watch, currently around $67,500
- 4H support zone: $64,000–$65,000 (former resistance turned support)
- Volume: Declining on sell-offs — confirmed seller exhaustion signal
Daily Analysis — The Decisive Big Picture
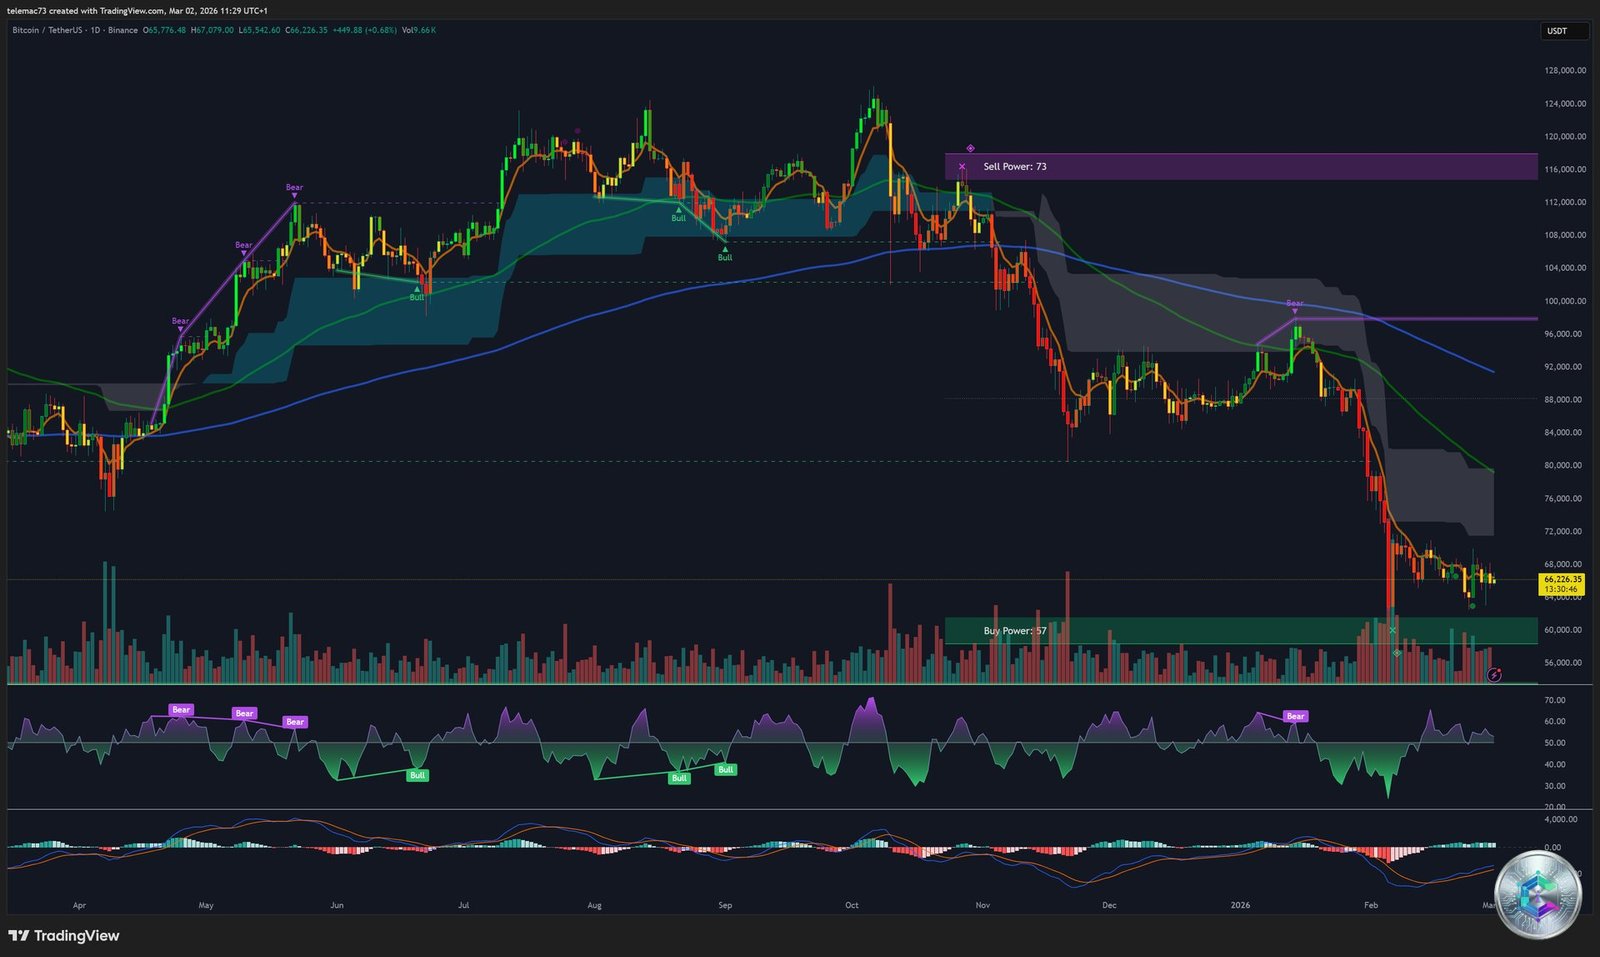
The decisive battle is playing out on the daily chart. The 200-Week EMA at $68,000–$68,330 represents the most critical resistance level right now. A weekly close above this level would be the essential technical signal to validate a sustained bullish reversal.
🟢 Key Supports
- $60,000 — Massive buy wall (1,130 BTC on the heatmap + $1.87B in concentrated puts)
- $63,000 — Institutional demand zone
- $65,500 — Active short-term support
🔴 Key Resistances
- $68,000–$68,330 — 200-Week EMA (major resistance)
- $70,000 — Psychological level + liquidity cluster
- $72,000 — Next structural resistance
Liquidity Heatmap — Where the Carnage Hides
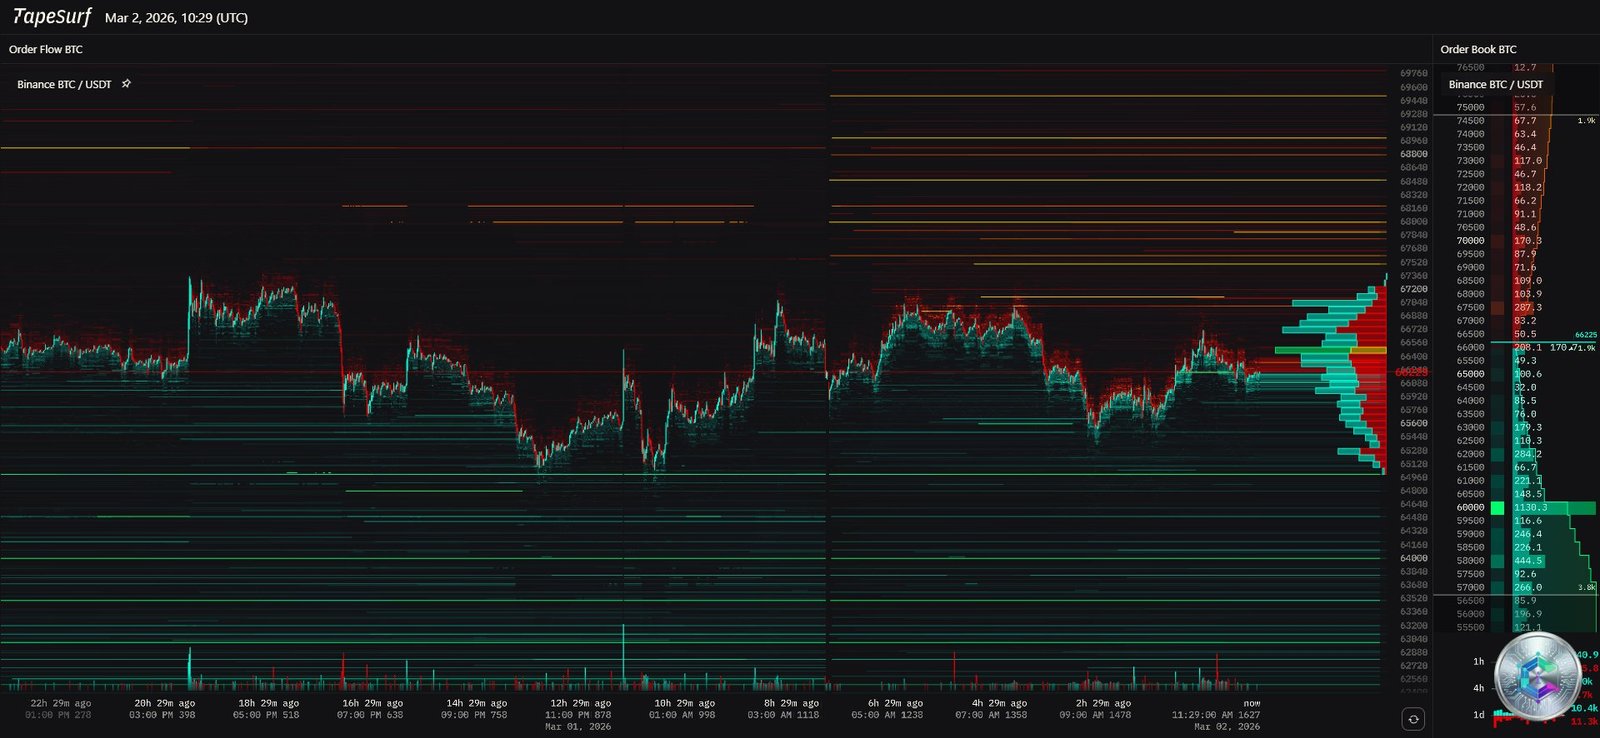
The liquidity heatmap is particularly revealing right now. It shows an exceptional concentration of buy orders at $60,000: no fewer than 1,130 BTC are parked at that level, complemented by $1.87 billion in concentrated puts. This buy wall acts as the institutional safety net for the market.
Above the current price, short liquidity clusters are concentrated between $67,500 and $68,500 — a zone that could trigger a short squeeze if breached with volume.
Sentiment & On-Chain: The Classic Bottom Divergence
The Fear & Greed Index reads 10 — Extreme Fear. Historically, such extreme readings often coincide with market bottoms or premium accumulation zones. This is corroborated by a striking on-chain data point: whales accumulated 66,940 BTC in a single day, representing hundreds of millions of dollars in institutional buying.
Retail panic creates whale opportunities. When the street sells, Wall Street accumulates.
This classic divergence between retail sentiment (bearish) and institutional action (accumulation) is a hallmark signal of major corrective bottoms in previous Bitcoin cycles.
Bitcoin ETF Flows: An Encouraging Signal
After 5 consecutive weeks of capital outflows, spot Bitcoin ETFs recorded net inflows of $787 million. This reversal in institutional flows coincides with the current price zone, reinforcing the thesis of strategic accumulation by long-term players.
Possible Scenarios for March 2026
🐂 Bullish Scenario (probability: 40%)
BTC manages a weekly close above $68,330 (200-Week EMA). Short squeeze triggered on liquidity clusters between $67,500–$68,500. Next target: $70,000–$72,000. Potential catalyst: dovish FOMC surprise on March 18.
🐻 Bearish Scenario (probability: 35%)
Break below $65,500 without a bounce. Test of institutional support at $63,000, then potentially $60,000. At $60,000, the massive buy wall should absorb selling pressure. A break below $60,000 remains an unlikely short-term scenario.
↔️ Neutral Scenario (probability: 25%)
Consolidation in the $65,000–$68,000 range until mid-March macro decisions. Volatility compression before a strong directional move. Anticipation of CPI and FOMC data keeps volumes subdued.
Conclusion: The Verdict Awaits Mid-March
The overall bias remains neutral-to-bearish on higher timeframes, but converging signals — whale accumulation, positive ETF flows, the $60,000 buy wall, and Fear & Greed in extreme fear territory — significantly limit the risk of a deep breakdown in the near term.
The $60,000–$70,000 range is the battlefield for March 2026. The verdict will be delivered by the Fed and inflation data. Until then, patience and risk management remain the best strategies.
⚠️ Disclaimer
This article is written for educational and informational purposes only. It does not constitute investment advice or a recommendation to buy or sell cryptocurrencies. The cryptocurrency market is extremely volatile. Only invest what you can afford to lose, and consult a licensed financial advisor before making any investment decisions.