


Bitcoin is navigating one of the tensest stretches of its current cycle this July 2026: caught between a promising technical rebound and the shadow of a still-fresh macro correction, the leading digital asset is heading toward a major directional verdict ahead of the July 28-29 FOMC meeting. Between returning institutional flows, a mining industry purge, and on-chain signals not seen in nearly four years, our multi-timeframe analysis breaks down the levels that will decide what comes next.
A market on a macroeconomic drip
After hitting an all-time high of $126,000 in October 2025, Bitcoin has endured three consecutive quarters of correction, bottoming at a 21-month low of roughly $57,750 in early July 2026 — a drawdown of more than 54% from its peak. Unlike the 2022 bear market, this correction has not been driven by internal crypto failures: no major exchange has collapsed, no major stablecoin has lost its peg. The pressure instead came from outside the protocol, driven by Federal Reserve monetary policy and massive outflows from spot Bitcoin ETFs.
The catalyst for the recent reversal came from the US labor market. June’s Non-Farm Payrolls report, showing only 57,000 jobs created against far higher expectations, sharply reshuffled rate-hike probabilities. The odds of another Fed rate hike at the September meeting dropped from 65% to around 50%. This easing immediately benefited risk assets: in just 48 hours, Bitcoin jumped 7.3%, moving from its $57,750 low on July 2 to above $62,000 on July 3, pulling Ethereum, Solana, and XRP along with it.
All eyes are now on the FOMC meeting scheduled for July 28-29, widely seen as the pivotal event that will determine whether this six-month correction has truly run its course.
Institutional flows cautiously return
June will be remembered as one of the toughest months for US spot Bitcoin ETFs, with $4 billion in cumulative net outflows and eight consecutive weeks of redemptions. But July 10 marked a clear break: after ten straight days of outflows, ETFs suddenly recorded $90.4 million in net inflows, alongside $18.4 million into Ethereum ETFs. A strong signal that major asset managers are beginning to view the $58,000-$60,000 zone as an accumulation opportunity rather than a falling knife.
| Indicator | Value | Interpretation |
|---|---|---|
| Net ETF outflows (June 2026) | -$4.00B | Institutional capitulation |
| Consecutive outflow streak | 8 weeks | Likely exhaustion of marginal sellers |
| Net BTC inflows (July 10) | +$90.4M | Return of institutional accumulation |
| Net ETH inflows (July 10) | +$18.4M | Renewed interest in Web3 infrastructure |
On the corporate treasury side, MicroStrategy continued its aggressive accumulation in 2026, adding roughly 175,000 BTC for $14 billion and pushing its total holdings to 847,363 BTC. A discordant note emerged on July 6, however, with a tactical sale of 3,588 BTC (about $80.8 million) — a reminder that even the most convinced holders can adjust positions under tight credit conditions.
Mining under post-halving pressure
The mining industry is going through a Darwinian selection phase. BitFuFu’s operational data for June illustrates this reality: monthly production down 29.4% to just 125 BTC, and cash reserves falling from 1,855 to 1,671 BTC. Miners are being forced to liquidate part of their holdings to cover energy and operational costs, which weighed on prices throughout June.
But the contraction in overall hashrate (from 19.5 to 15.3 EH/s) masks a fleet modernization: BitFuFu’s self-owned hashrate actually grew 9.4% thanks to the deployment of new Antminer S21 XP units, pushing average fleet efficiency to 17.9 J/TH. Once this shakeout is complete, the structural reduction in newly issued supply should start working in Bitcoin’s favor, especially if institutional demand holds up.
Regulation shifts from enforcement to structure
On July 7, 2026, the SEC formally added crypto-asset-specific rulemaking to its official regulatory agenda for the first time in the agency’s history. Amendments are under consideration to bring crypto-asset trading into existing alternative trading systems, while in Europe, ESMA launched a Common Supervisory Action on July 8 focused on the operational resilience of crypto-asset service providers. This growing clarity is a key factor in attracting still-sidelined institutional and sovereign capital.
On-chain signals: a cleaner market base
The realized profit-to-loss ratio has dropped to its lowest level in 43 months — a level historically associated with terminal capitulation phases and market bottoming. This purge has shifted coins from weak hands into the hands of high-conviction holders. Bitcoin retains 55% market dominance, while Ethereum trades between $1,770 and $1,813, supported by sustained withdrawals from exchanges.
Multi-timeframe technical analysis
At the time of writing, Bitcoin is trading around $63,163, fighting to validate a major structural breakout. Here’s what each timeframe reveals.
Daily timeframe (1D): the fight against the downtrend
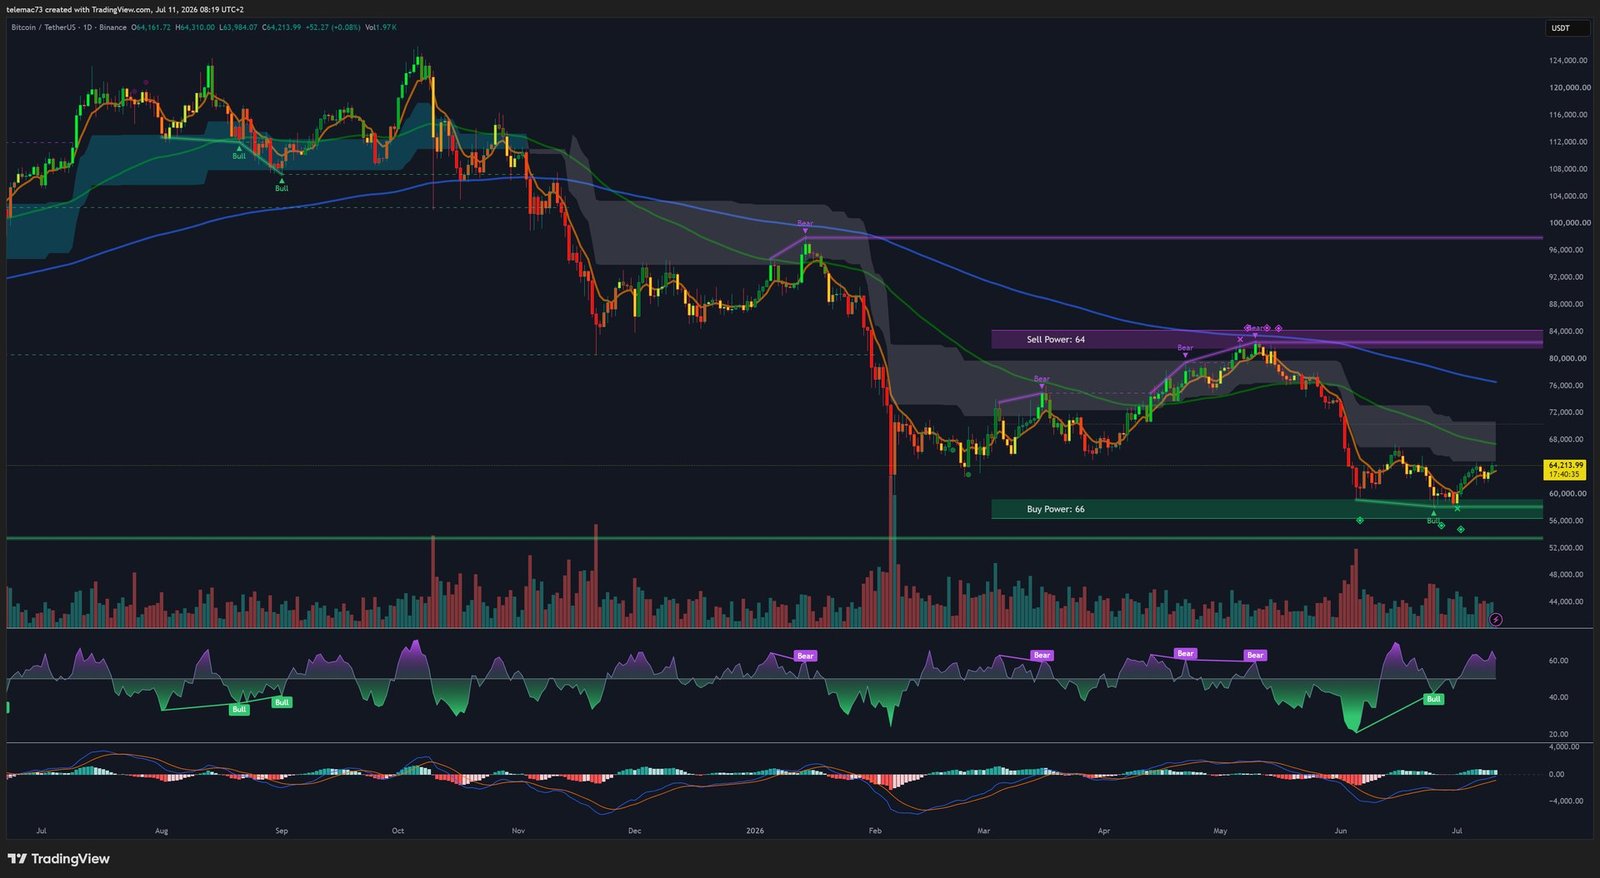
Bitcoin has been trading within a broad descending channel since October 2025, with a major support zone between $58,000 and $60,000 that held firm in late June. The early-July rebound allowed price to reclaim the 20-day EMA and break above the 50-day EMA — the first serious technical sign of a potential momentum shift. The daily RSI, after plunging into extreme oversold territory in late June, has recovered toward a neutral-to-bullish zone (around 55), while the MACD histogram shows a rapid contraction in bearish momentum, with an emerging golden cross.
4-hour timeframe: bull flag and compression triangle
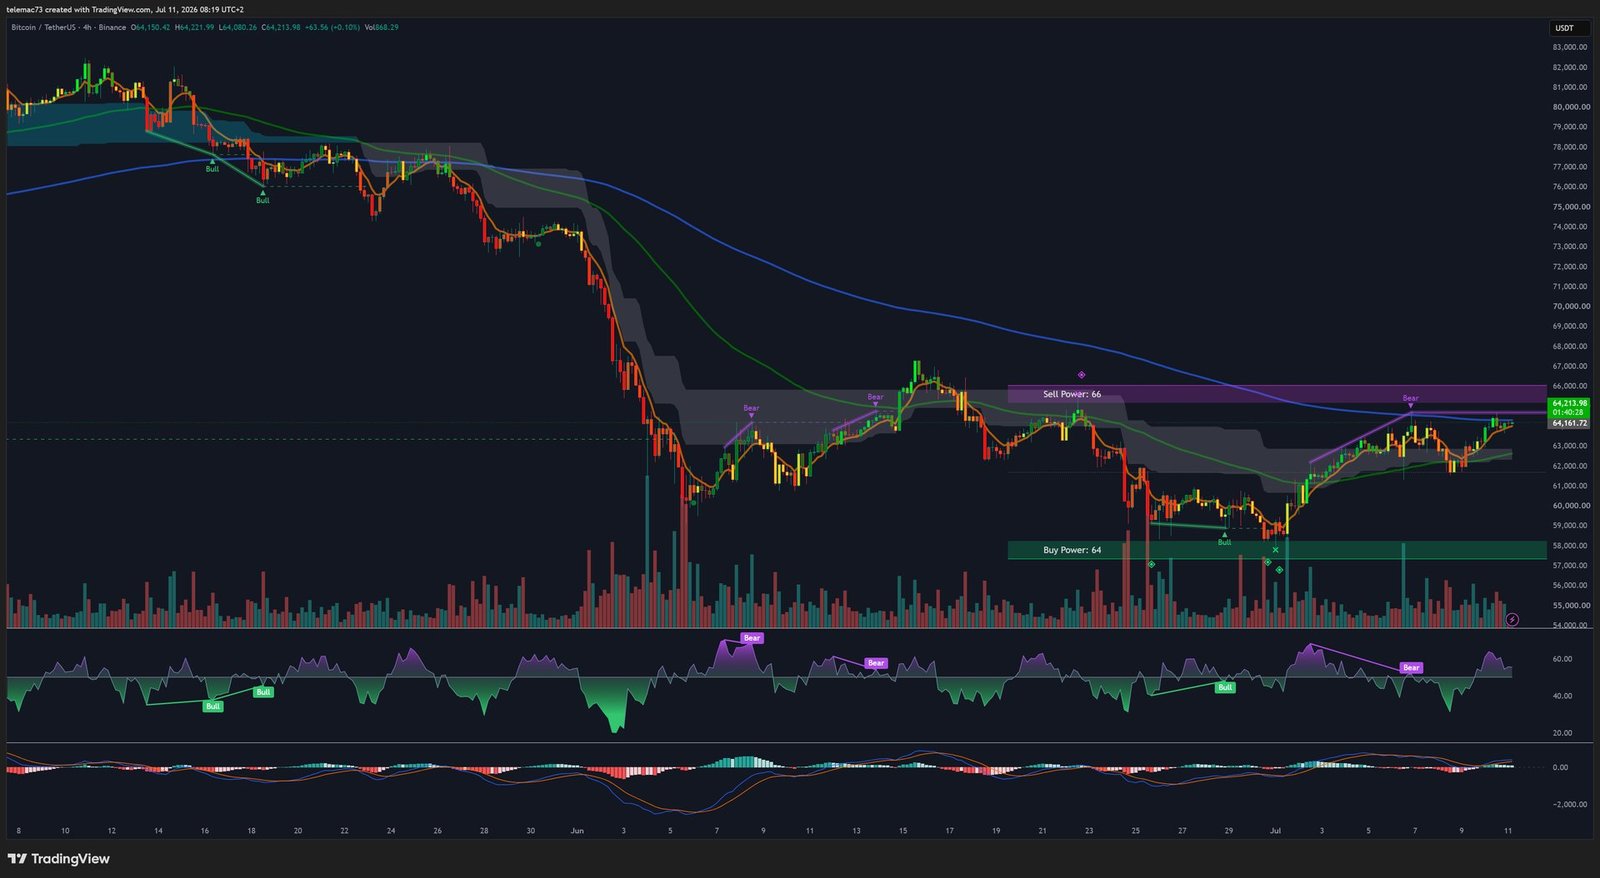
Since the July 2 low at $57,750, the market has traced a textbook bull flag pattern: a vertical flagpole followed by a slightly descending consolidation channel. Price is now squeezed inside an asymmetric triangle, building energy ahead of a directional move. The key trigger: a confirmed 4H close above $64,000-$64,300 would validate the bullish breakout, while a rejection below $62,000 would re-expose the $61,000 zone.
15-minute timeframe: liquidity hunts and intraday noise
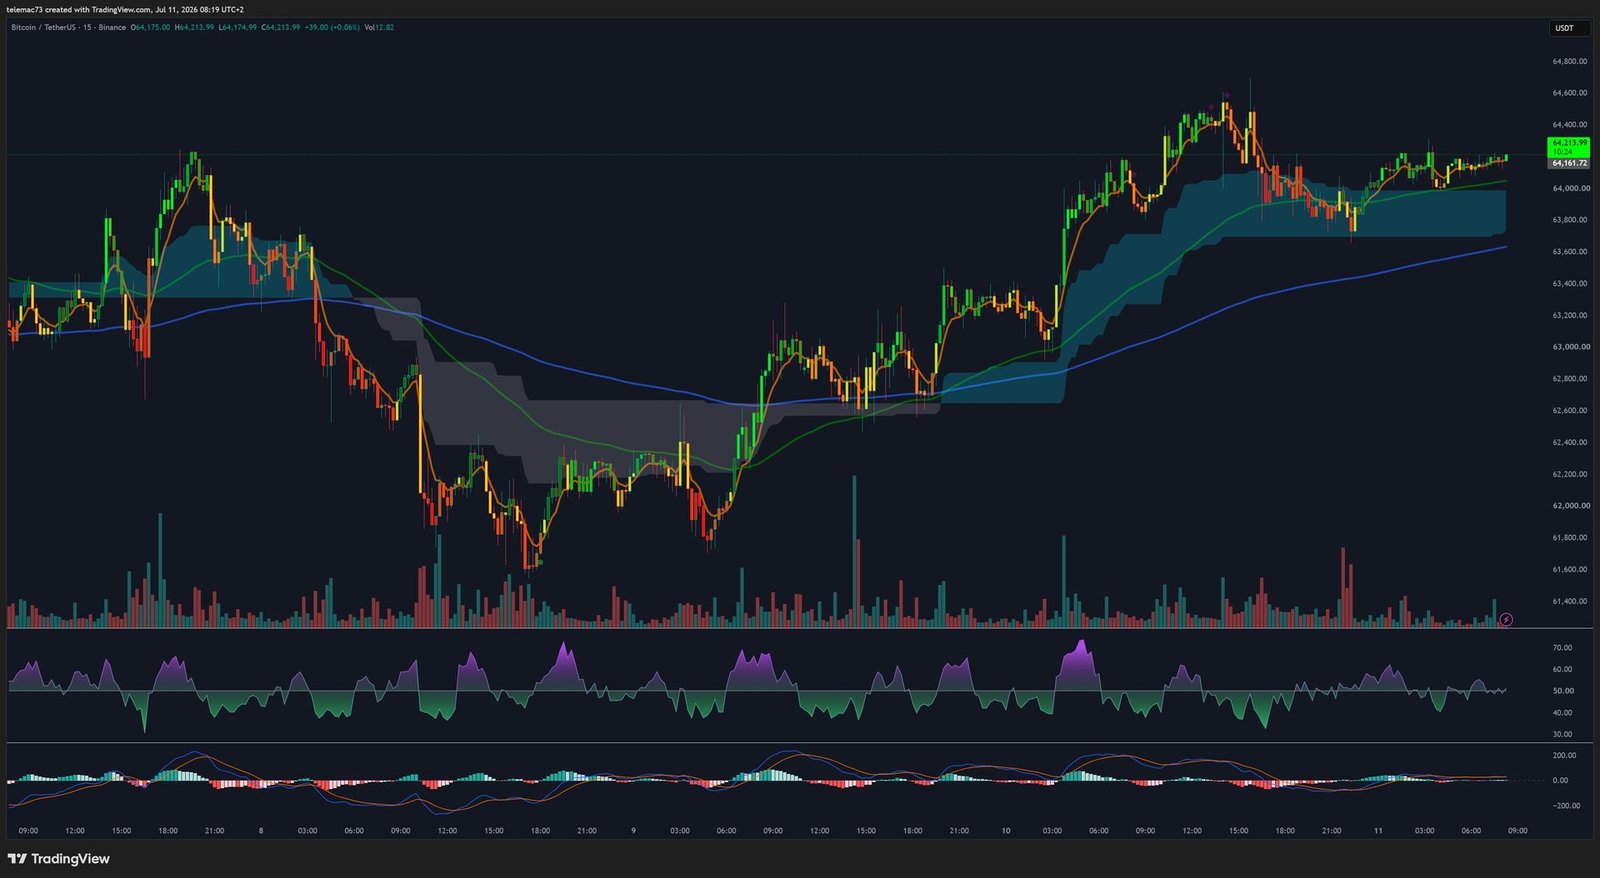
On this timeframe, price is churning between $63,163 and $63,800, punctuated by aggressive stop hunts around the US market open. Institutional order blocks point to intraday support near $62,500 and immediate resistance at $64,100. The 15-minute RSI is showing hidden bearish divergences, suggesting the move’s velocity is fading and buy-side demand isn’t yet organic enough to fuel an immediate parabolic move.
Liquidation heatmap: the magnetism of the order book
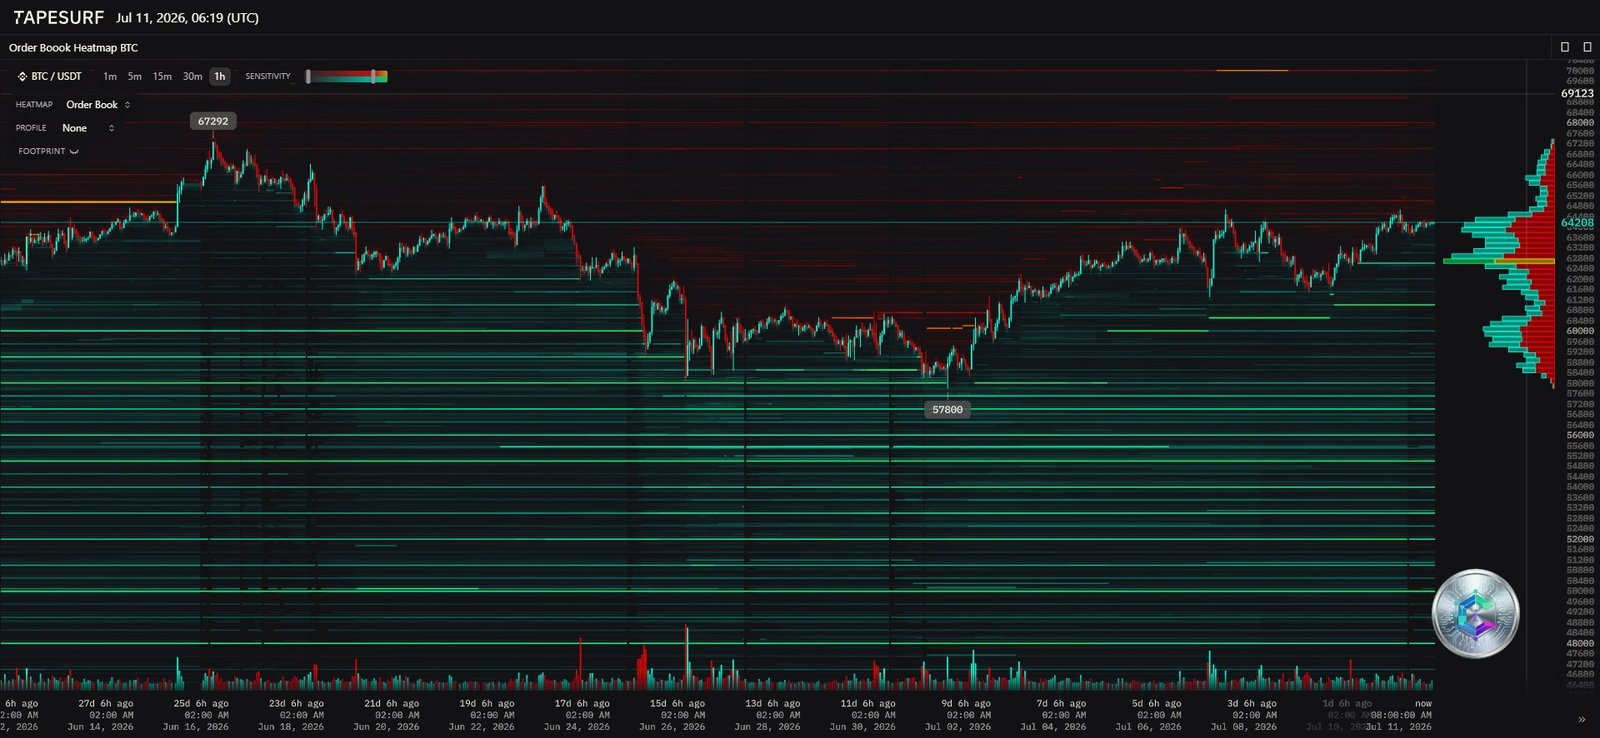
The heatmap reveals a massive cluster of potential short-position liquidations between $64,500 and $65,000: a break above the $64,300 resistance could trigger a short squeeze pushing price toward — or beyond — this zone. Conversely, sizable long-liquidation pockets sit at $62,000, with a major liquidity wall around $60,000 — the zone the market would likely sweep if the current bullish structure fails.
Key levels to watch
| Level (USD) | Category | Meaning |
|---|---|---|
| $64,500 – $65,000 | Major resistance | Short liquidation wall, short-squeeze risk |
| $64,000 – $64,300 | Validation pivot (4H) | Close required to confirm bullish breakout |
| $63,163 – $63,800 | Current zone | Battle between institutional buyers and residual sellers |
| $62,000 | Intermediate support | Break = risk of retracing to $61,000 |
| $61,000 – $62,000 | Consolidation zone | Must hold for a healthy base |
| $58,000 – $60,000 | Macro support | Last line of defense before deeper capitulation |
Two scenarios for the weeks ahead
- Bullish scenario: confirmation of institutional inflows, persistent US labor market weakness giving the Fed room to pivot, growing regulatory clarity. A confirmed daily close above $64,300 would open the path toward $68,000, or even $70,000, ahead of the FOMC meeting.
- Bearish scenario: continued mining sell pressure, risk of further corporate treasury sales, failure of the bull flag. A rejection below $62,000 would target $60,000, with a risk of capitulation toward $58,000 if institutional buyers fail to defend that level.
Conclusion
Bitcoin is currently trading in a zone of maximum volatility compression, sitting at the crossroads of a potential macro bottom and a still-possible bearish continuation. The resolution of the compression triangle on the intermediate timeframes, combined with upcoming US inflation data and ETF flows, should provide the decisive signal on the direction of the next major move in the coming sessions.
Disclaimer: This article is provided for educational and informational purposes only. It does not constitute investment advice, trading advice, or a recommendation to buy or sell any asset. Cryptocurrency markets are highly volatile, and any investment carries a risk of capital loss. Always do your own research and consult a qualified financial advisor before making any decision.

