
As Bitcoin (BTC) plunges nearly 50% from its All-Time High of $126,000 reached in October 2025, the market stands at a critical crossroads. This comprehensive analysis, conducted in mid-February 2026, dissects the macro-financial forces, order book microstructure, and psychological dynamics shaping the trajectory of the world’s leading digital asset.
🌐 The Macro-Financial Paradigm: Bitcoin Is No Longer a Decorrelated Asset
The illusion of « Bitcoin as digital gold » — a safe-haven asset immune to traditional financial market turmoil — has definitively shattered in 2026. The institutional maturation of the asset, catalyzed by the approval of Spot Bitcoin ETFs on US markets, has fundamentally transformed its behavior. BTC now displays an extremely tight correlation with American technology stocks, and more specifically with the artificial intelligence (AI) sector.
This deep connection to traditional markets places Bitcoin at the frontline of institutional de-risking waves. When the tech sector sneezes following aggressive AI valuation reassessments, Bitcoin catches a severe cold — liquidated first to preserve portfolio liquidity. In the words now consecrated by analysts: « shoot first, ask questions later. »
Adding to this sectoral correlation is the weight of US monetary policy. The Federal Reserve (Fed) keeps markets in a state of permanent tension. The strength of the US dollar — bolstered by targeted tariffs imposed by the Trump administration on Europe and Asia — exerts relentless deflationary pressure on BTC, which is intrinsically denominated and priced in dollars.
Since the October 2025 peaks, total crypto market capitalization has contracted by $2.7 trillion, accompanied by $2.6 billion in liquidations on January 31, 2026 alone.
📊 Macro-Structural Analysis: The Daily Chart Reveals a Regime Change
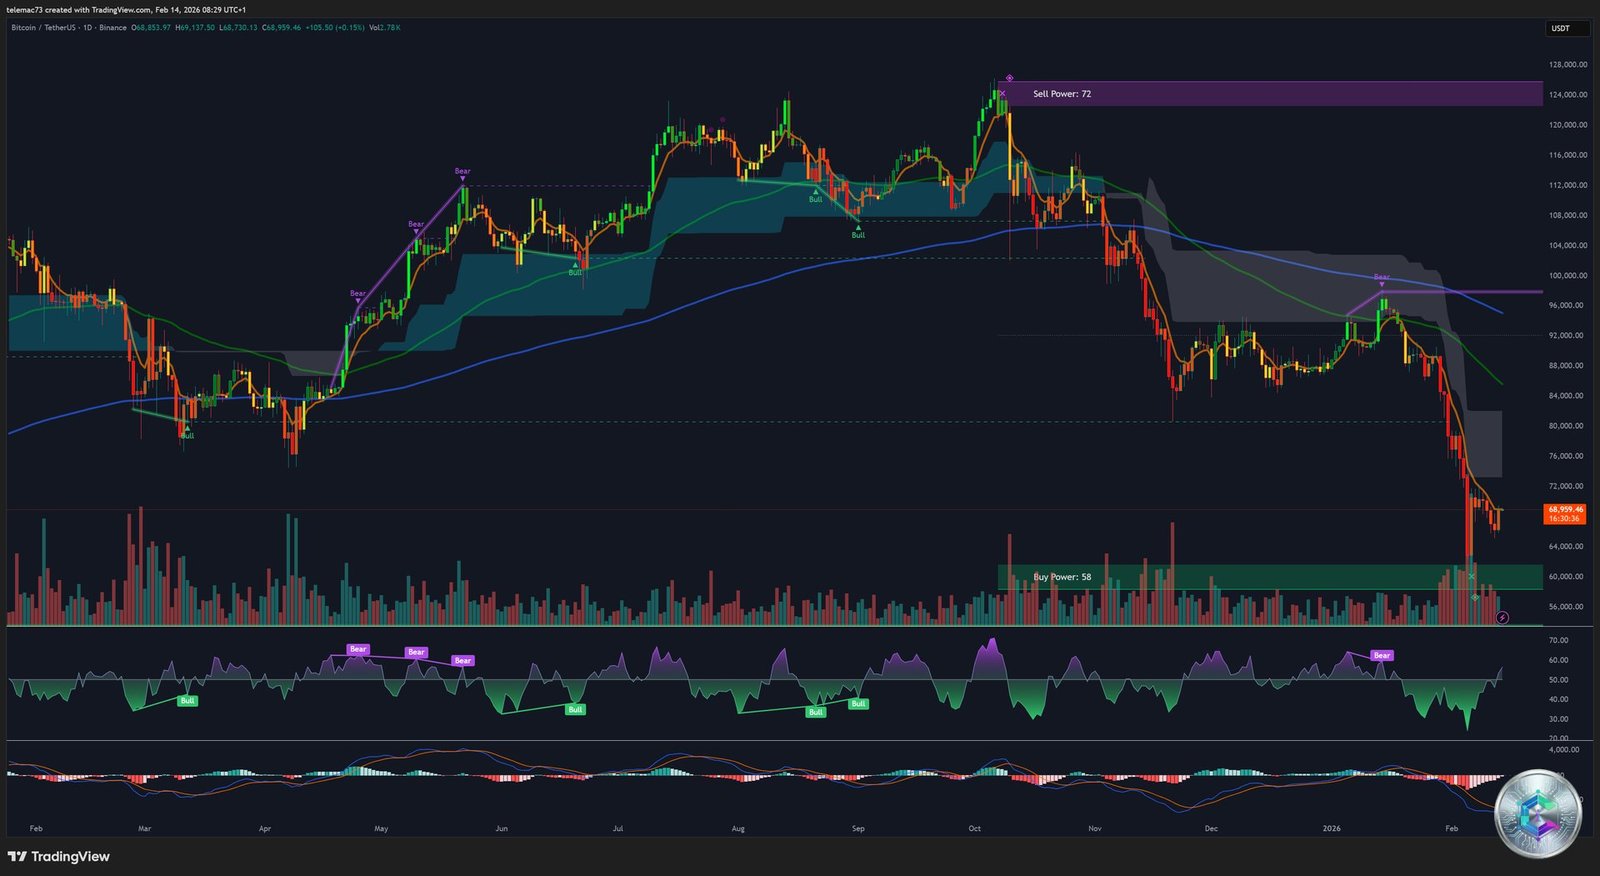
Price action since the October 2025 peak at $126,000 is characterized by an inverted staircase structure: a relentless sequence of lower highs and lower lows. The proprietary « Sell Power » indicator had registered an extreme value of 72 at the cycle top — signaling total buyer capitulation and exhausted bullish momentum.
The most critical technical breakdown of early 2026: the violation of the 200-week EMA, currently oscillating around $68,000. This indicator is universally regarded by institutional analysts as the ultimate demarcation line between bull and bear markets. On the February 11, 2026 session, Bitcoin closed below this EMA — technically invalidating the thesis of a simple corrective retracement.
This structural break opens the path toward a retest of major October 2024 support levels, situated in the $60,000 – $62,000 corridor. Should this defense fail, Fibonacci 100% extension projections target a final bearish objective at $52,000.
⏱️ Medium-Term Consolidation: The 4-Hour Chart Dynamics

On the 4-hour chart, the bearish macro-structure decomposes into a vast asymmetric consolidation phase. BTC is confined within a multi-month descending channel, whose midline aligns precisely with $70,000 — not merely a round psychological number, but the true dynamic equilibrium point of the market in the short to medium term.
Every bullish attempt to break above this level encounters a wall of intractable sellers. The 4H chart materializes this resistance as a wide compression band, systematically pushing price back toward the channel base near $65,000.
A glimmer of technical hope does emerge: a « Buy Power: 58 » signal was generated near the $60,000 waterline, indicating that residual institutional demand is stepping in to defend this critical floor. To validate a reversal, a decisive reclaim of $70,000 supported by massive volume expansion is imperative.
🔬 Intraday Microstructure: Anatomy of the 15-Minute Chart

The 15-minute timeframe reveals an arena of extreme brutality, where algorithms and market makers exploit short-term liquidity with surgical precision. The standout recent event: a false bullish breakout to $69,800 during the New York session in the second week of February.
This move formed a classic Swing Failure Pattern (SFP) — a pernicious trap that lures momentum buyers before liquidating them. The moment price reached that upper liquidity, overwhelming selling force reversed the move, triggering a cascade of stop-loss orders from trapped buyers. The RSI on this timeframe struggles to sustainably breach the 50 midline, confirming the demand’s inability to maintain consistent pressure.
Below $64,000, a dense institutional order block between $60,800 and $61,000 acts as a liquidity magnet — the footprint of institutional buyers who aggressively intervened to halt the freefall at the annual low of $59,800.
🗺️ Liquidity Mapping: The « Liquidation Sandwich »
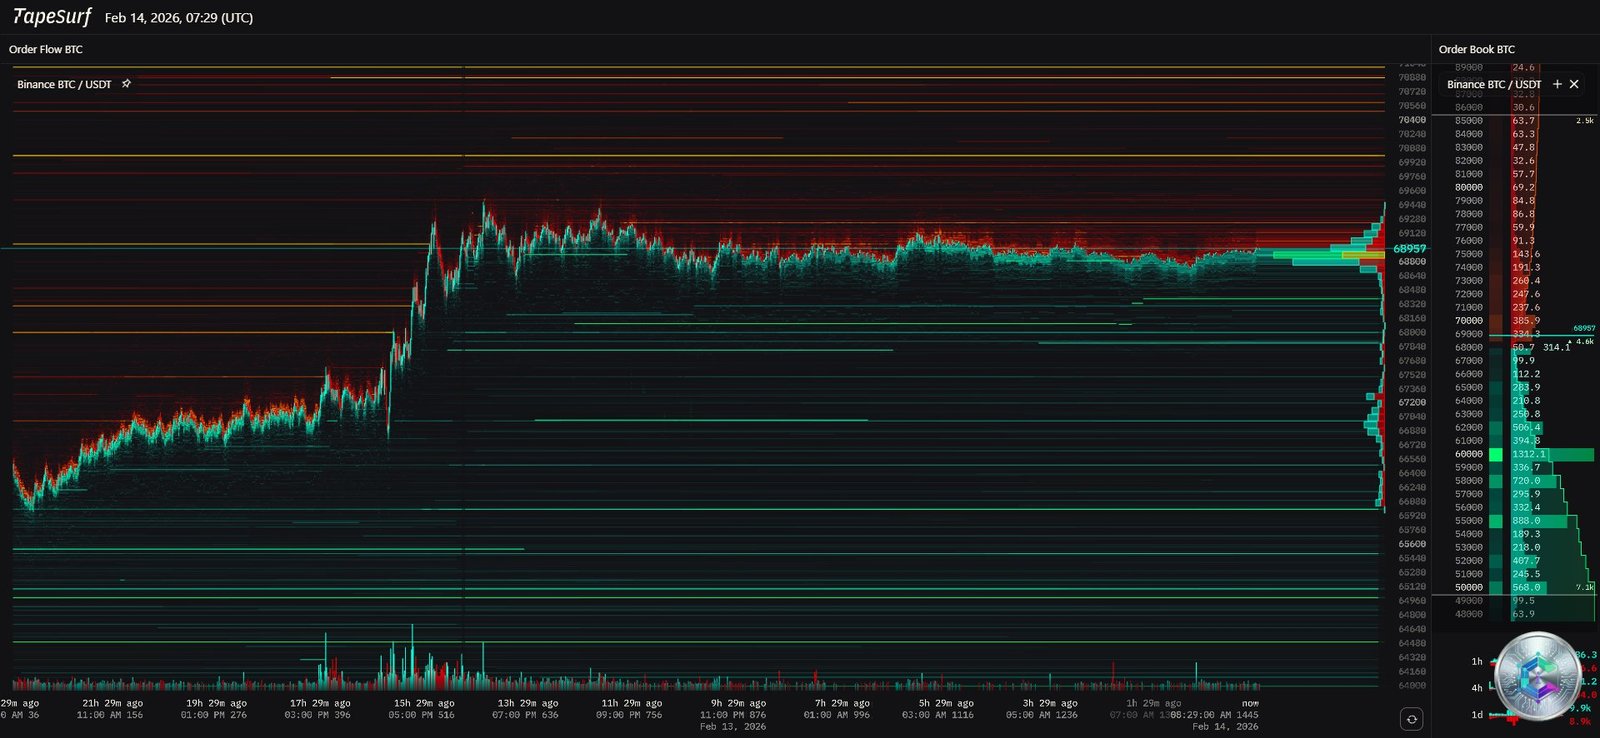
The liquidation heatmap reveals a configuration analysts describe as a « liquidation sandwich » — two oppressive liquidity walls squeezing the current spot price.
Above: an exceptional density of ask orders concentrated between $69,000 and $72,000. This armored glass ceiling represents institutional take-profit zones and defense points for existing short positions. If buyers managed to pulverize the $72,000 rampart, it would trigger an explosive short squeeze mechanically propelling price toward $78,000 – $85,000.
Below: a relative liquidity vacuum between $66,000 and the $60,000 zone. In order book dynamics, this absence of friction means that if immediate support capitulates, the rate of decline will accelerate exponentially (slippage effect) until hitting the $60,000 floor. The pivot level of $68,160 is identified as the keystone of the entire structure.
⚡ The Derivatives Market: Extreme Backwardation and Gamma Risk
The Bitcoin options market is sending a systemic alarm signal. The implied volatility term structure has inverted spectacularly into a state of extreme backwardation: short-term implied volatility has reached a staggering 85.03%, while long-term expectations stagnate around 50%.
This imbalance carries an unambiguous message: institutions are willing to pay an exorbitant premium for immediate protection against an imminent price dislocation. The demand for short-term hedging crushes any concern about long-term valuation prospects.
The danger is amplified by an accumulation of $1.24 billion in open interest on $60,000 put options (primarily on Deribit). This positioning engenders a formidable mechanism: Gamma risk. Market makers who sold these puts, in order to remain delta-neutral, are algorithmically forced to sell BTC as price declines — creating a negative feedback loop that can spiral into a cascade if the $60,000 level capitulates.
⛏️ The Mining Burden: Structural Sell-Side Pressure
Beyond speculative flows, the mining industry constitutes the primary vector of persistent bearish pressure. The average cost to produce one Bitcoin is estimated at $87,000 in early 2026. With BTC trading between $65,000 and $68,000, mid-efficiency miners are recording a latent operating loss of approximately $20,000 per BTC produced.
To survive, they are forced to immediately liquidate new production — or even tap into strategic reserves accumulated over years. This self-preservation behavior, known as « miner surrender, » creates a permanent natural selling layer that absorbs and crushes every technical rebound attempt.
🏦 The ETF Flow Dichotomy: A Volatility Amplifier
The approval of Spot Bitcoin ETFs was supposed to open the floodgates of stabilizing institutional adoption. The 2026 reality is diametrically opposite: these flows now act as an erratic volatility amplifier.
| Date (February 2026) | Spot BTC ETF Flows | Market Impact |
|---|---|---|
| Friday (previous week) | ✅ +$371M | Opportunistic buy-the-dip — false hope of stabilization |
| Monday | ✅ +$145M | Timid demand, insufficient to absorb miner pressure |
| Wednesday, Feb 11 | 🔴 -$276.3M | Brutal institutional capitulation — validated 200-week EMA breakdown |
| Rolling multi-week balance | 🔴 -$5 Billion | Global systemic de-risking — flight to safe-haven assets |
Quantitative models indicate that a genuine bullish regime change would empirically require a sequence of at least five consecutive sessions of massive positive net flows, coupled with neutral funding rates on derivatives. Currently, the conditions for such alignment are nonexistent.
🧠 Market Psychology: Extreme Fear and Capitulation
The Crypto Fear & Greed Index recorded the historically lowest score ever measured: 5/100 on February 6, 2026 — pulverizing the previous panic floors of the 2022 crypto winter. The index plunged from 11 to 5 in less than 48 hours, illustrating a massive and indiscriminate position dump by retail investors.
Currently stabilized around 9 to 15 (« Extreme Fear » zone), this toxic climate generates a self-fulfilling prophecy psychology. Paradoxically, from a contrarian standpoint, extreme panic phases historically constitute lagging indicators of market bottom formation. When the majority of marginal operators have already liquidated, the ground becomes fertile for silent accumulation campaigns by smart money.
🎯 Key Levels Matrix: Pivot Points and Scenarios
| Level | Target Price | Structural Role |
|---|---|---|
| 🔴 Ultimate Resistance (R3) | $85,000 | 50-day SMA — terminal target in case of parabolic short squeeze |
| 🔴 Intermediate Resistance (R2) | $78,000 – $82,000 | « True Market Mean » zone ($79,200) — short liquidation cluster |
| 🔴 Pivot Resistance (R1) | $72,000 | Keystone — breakout = trigger for a massive short squeeze |
| ⚖️ Macro Demarcation Line (PV) | $68,000 – $70,000 | 200-week EMA + 4H channel midline — central battleground |
| 🟡 Consolidation Support (S1) | $65,000 | Lower bound of current consolidation — liquidity void below |
| 🟠 Capitulation Support (S2) | $60,000 – $62,800 | Bitcoin’s Maginot Line — institutional block at $60,800 + Gamma risk |
| 🔴 Systemic Abyss (S3) | $52,000 | Fibonacci 100% extension — target if $60,000 defense fails |
📌 Conclusion: Between the Abyss and Resurrection
At the close of this comprehensive analysis, one conclusion imposes itself with irrefutable clarity: Bitcoin is undergoing a trial of strength whose outcome will redefine its identity as an asset for the rest of the decade. Long-term technical foundations have suffered deep structural damage, highlighted by the unprecedented violation of the 200-week EMA at $68,000.
The market moves like a tightrope walker above a gaping liquidity void, threatened by Gamma risk from $60,000 put options, an extreme stress on the mining industry, and market sentiment at historic terror levels. The dominant projection is that of a prolonged phase of range-bound absorption.
To dispel the shadow of capitulation toward $52,000, Bitcoin must demolish the psychological barrier of $72,000 — which would require the convergence of a favorable macro shock (spectacular Fed rate easing) and a resurgence of risk appetite in the technology sector, to initiate the much-anticipated chain liquidation of short sellers.
In the meantime, strict bearish risk management remains the alpha and omega of capital preservation.
⚠️ Disclaimer
This article is written for purely educational and informational purposes only. It does not constitute financial advice, a recommendation to buy or sell, nor an inducement to invest in digital assets. Crypto-assets are highly speculative and volatile instruments. Any investment carries a risk of partial or total loss of capital. Please consult a licensed financial advisor before making any investment decision.