


Bitcoin is consolidating below the critical $80,000 psychological threshold on May 16, 2026, trading around $79,049 during the European session with 24-hour volume of approximately $38.13 billion. Caught between persistent US inflation, a landmark legislative breakthrough, and methodical institutional accumulation, the world’s leading digital asset stands at a statistically rare technical inflection point. A comprehensive breakdown follows.
⚖️ The Macroeconomic Vise: Inflation vs. Geopolitical Détente
Bitcoin’s trajectory can no longer be analyzed in isolation. The benchmark digital asset is pulled between two antagonistic forces of rare intensity. On one side, resurging US inflation — highlighted by an unexpected +6% Producer Price Index (PPI) reading — eliminates any near-term hopes of monetary easing and pushes 10-year Treasury yields to 52-week highs. This high-rate environment structurally penalizes non-yielding assets like Bitcoin by mechanically increasing their discount rate, making them less attractive relative to risk-free government bonds.
Counterbalancing this, the May 14 Sino-American summit between Donald Trump and Xi Jinping produced a stabilizing consensus on keeping the Strait of Hormuz open — critical for one-fifth of global oil shipments — alongside a shared stance on curbing Iranian nuclear proliferation. This unexpected de-escalation fueled a powerful relief rally across traditional equity markets: the Dow Jones briefly crossed 50,000 points, while the Nasdaq and S&P 500 reached new all-time highs. Bitcoin, however, remained conspicuously absent from this euphoria, negatively correlated with a strengthening dollar and capped by global monetary austerity. Gold, which briefly peaked at $4,783.40, also faced aggressive profit-taking.
📜 The CLARITY Act: A Historic Legislative Breakthrough with Delayed Impact
On May 14, 2026, the US Senate Banking Committee passed the Digital Asset Market Clarity Act (CLARITY Act) by a vote of 15 to 9. This bipartisan, 309-page legislation — notable for attracting key Democratic figures including Ruben Gallego and Angela Alsobrooks alongside all 13 Republican committee members — formally codifies the classification of Bitcoin, Ethereum, and XRP as commodities, removing them from securities law jurisdiction.
The systemic importance is immense: this legal clarification removes the regulatory overhang that has kept enormous pools of institutional capital on the sidelines. The potential authorization of regulated, yield-bearing stablecoins could also serve as a fundamental bullish catalyst for H2 liquidity flows. Yet the price reaction was remarkably asymmetric — a brief intraday spike above $81,000 followed by rapid compression back to baseline. The bill still requires a supermajority of 60 Senate votes to overcome filibuster, then a complex reconciliation process with the House (H.R. 3633). Effective implementation may take one to two years. The CLARITY Act establishes a solid psychological floor that limits severe downside risk, but does not yet trigger the institutional FOMO needed to overcome macroeconomic headwinds.
🏦 The Great Institutional Accumulation
The most striking divergence of this cycle lies in the opposing behavior of institutional capital versus retail investors. While the number of active retail wallets contracted by 245,000 addresses in five days — the fastest attrition rate since summer 2024 — financial giants are accumulating methodically. US spot Bitcoin ETFs captured nearly $1 billion in net inflows in a single session early in May, demonstrating intact institutional firepower.
| Institutional Actor | Recent Activity (May 2026) | Strategic Reading |
|---|---|---|
| BlackRock (IBIT) | 70% of total US ETF flows in April | Dominant, continuous accumulation |
| JPMorgan | +174% IBIT exposure increase via Q1 13F (~$390M) | Systematic buy-the-dip strategy |
| Morgan Stanley (MSBT) | $256M accumulated, zero net outflow days | Pure institutional HODL – long-term retention |
| Metaplanet | 40,000 BTC corporate treasury | Aggressive store-of-value reserve strategy |
| MicroStrategy | 535 BTC acquired (weakest week of 2026) | Structural deceleration of corporate purchases |
This massive transfer from « weak hands » to « strong hands » is the hallmark of a maturing market cycle. Institutional entities are establishing their average cost basis around $80,300. While this consolidates the network’s foundational structure, it simultaneously drains the directional liquidity typically needed to initiate and sustain a parabolic price advance.
📊 Technical Analysis: Daily Chart (1D)
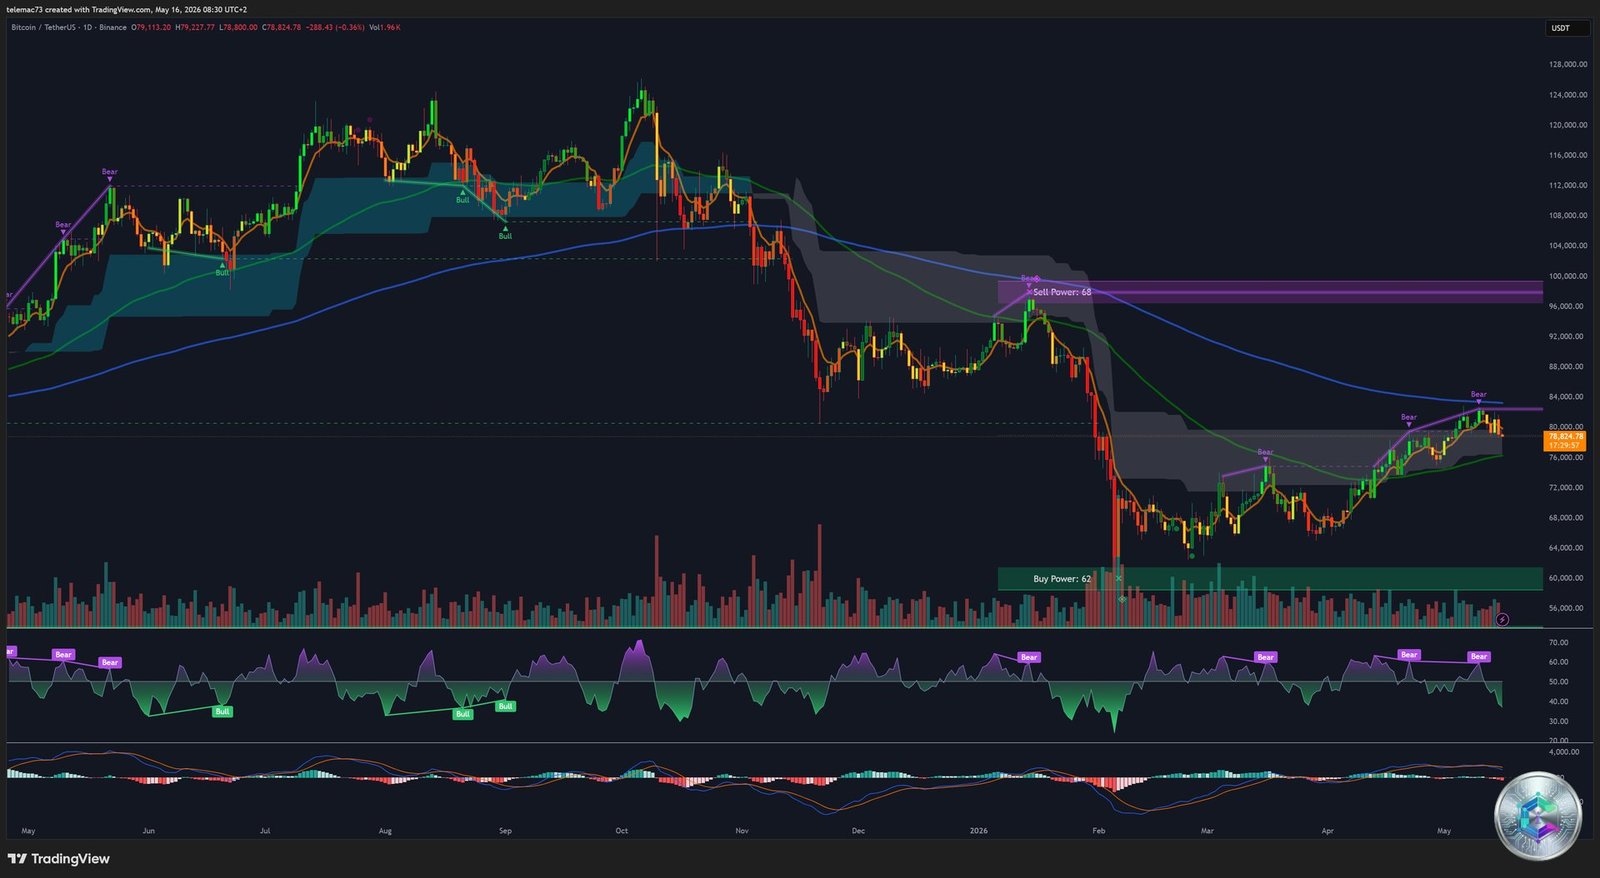
On the daily chart, the macroscopic configuration no longer presents a clearly bullish bias. Having failed to hold above its upper value area following recent macro announcements, price action is trapped in what analysts call a « volatility cage » — a narrow horizontal consolidation where every breakout attempt is swiftly repressed.
The central pivot is the formidable resistance at the convergence of the 200-day EMA and 200-day SMA at ~$82,000 — the ultimate secular trend arbiter. Its rejection on May 13 triggered a chain liquidation of over $500 million in long positions. For bulls to validate a continuation, they must break this level, retest it from above, and convert the $82,000–$84,000 zone into confirmed support via consecutive daily and weekly closes. The 50-day EMA, currently flattening around $77,000, represents the last dynamic safety net before structural deterioration.
The daily RSI displays a classic bearish divergence: while price tested equivalent highs, RSI printed lower highs, refusing to enter overbought territory — signaling deep exhaustion of underlying buying pressure. The MACD (3-10-16) shows manifest stalling near $82,908 with no imminent bullish crossover. On a brighter long-term note, the MVRV Z-Score hovers near 1 — far from the irrational euphoria levels of past cycle peaks (>3.5) — indicating a fundamentally healthy valuation with substantial theoretical upside remaining before systemic risk levels are reached.
📈 4-Hour Structure: Elliott Waves and Volatility Compression
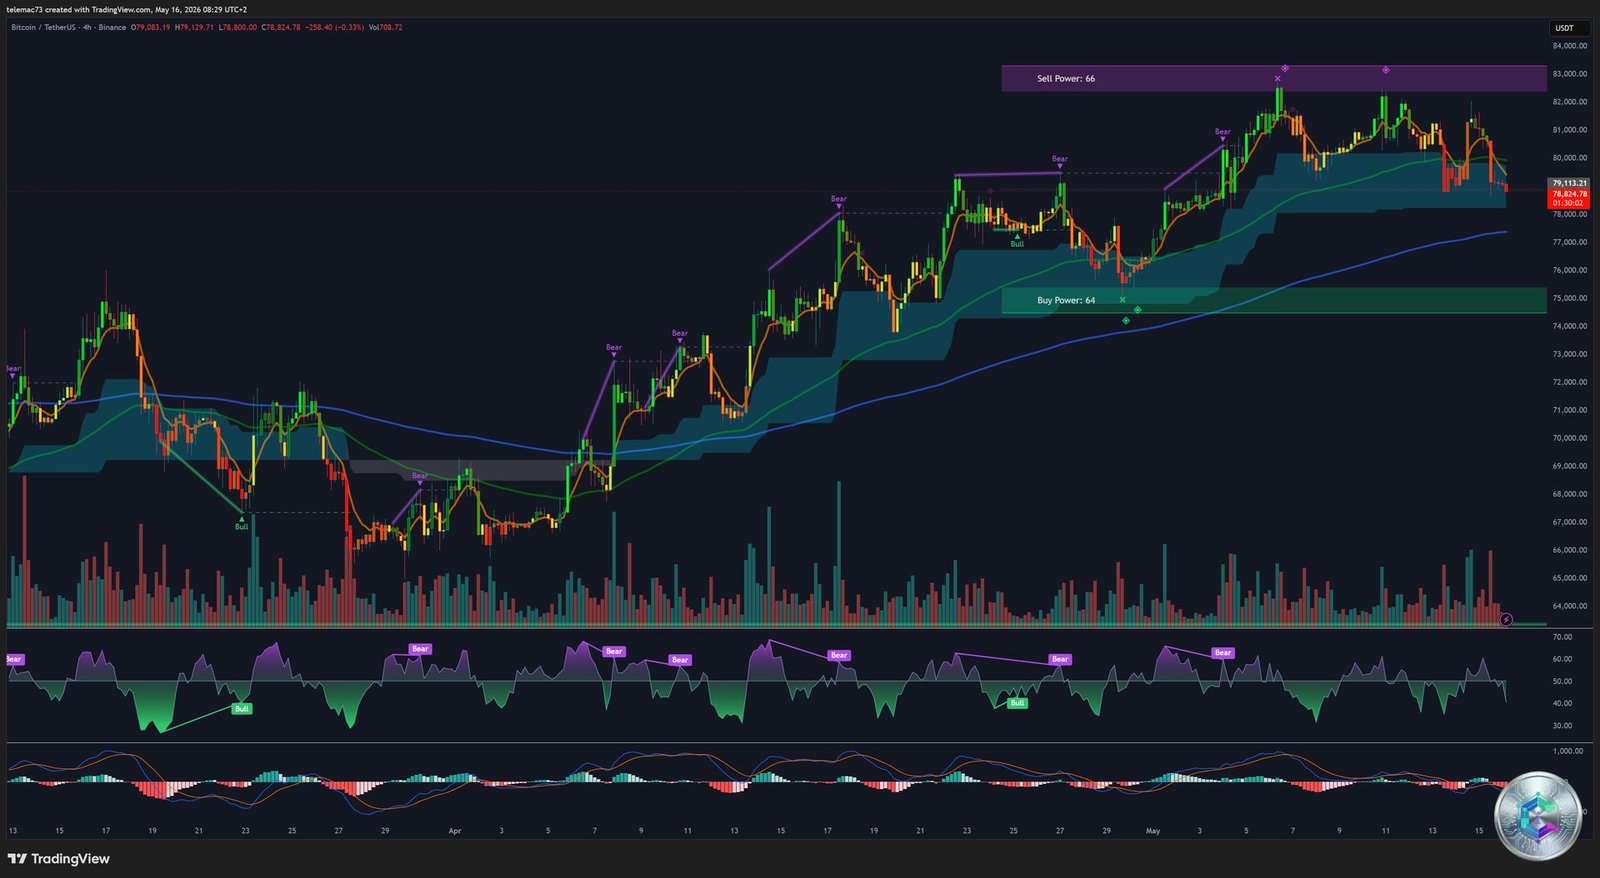
The 4-hour chart reveals a complex correction unfolding as an (A)-(B)-(C) zigzag pattern per Elliott Wave theory. Wave (A) is complete. Wave (B) was constructed as a double zigzag, efficiently absorbing residual selling pressure. The market is now developing the final impulse Wave (C), with a precise Fibonacci extension target at $83,132.33 (138.2% of Wave A amplitude).
The convergence of stagnating recent highs and higher defended lows is forming a symmetrical compression triangle — a classic precursor to explosive volatility expansion. An upside breakout would validate the bullish resolution of Wave (C). Conversely, bear flags are materializing after each rejection at $82,000, confirming that short sellers maintain medium-term control by systematically selling bounces rather than buyers supporting dips. The 4H RSI oscillates aimlessly, reflecting the compression inherent to the triangle structure.
⚡ 15-Minute Micro-Structure: The HFT Algorithm Battlefield
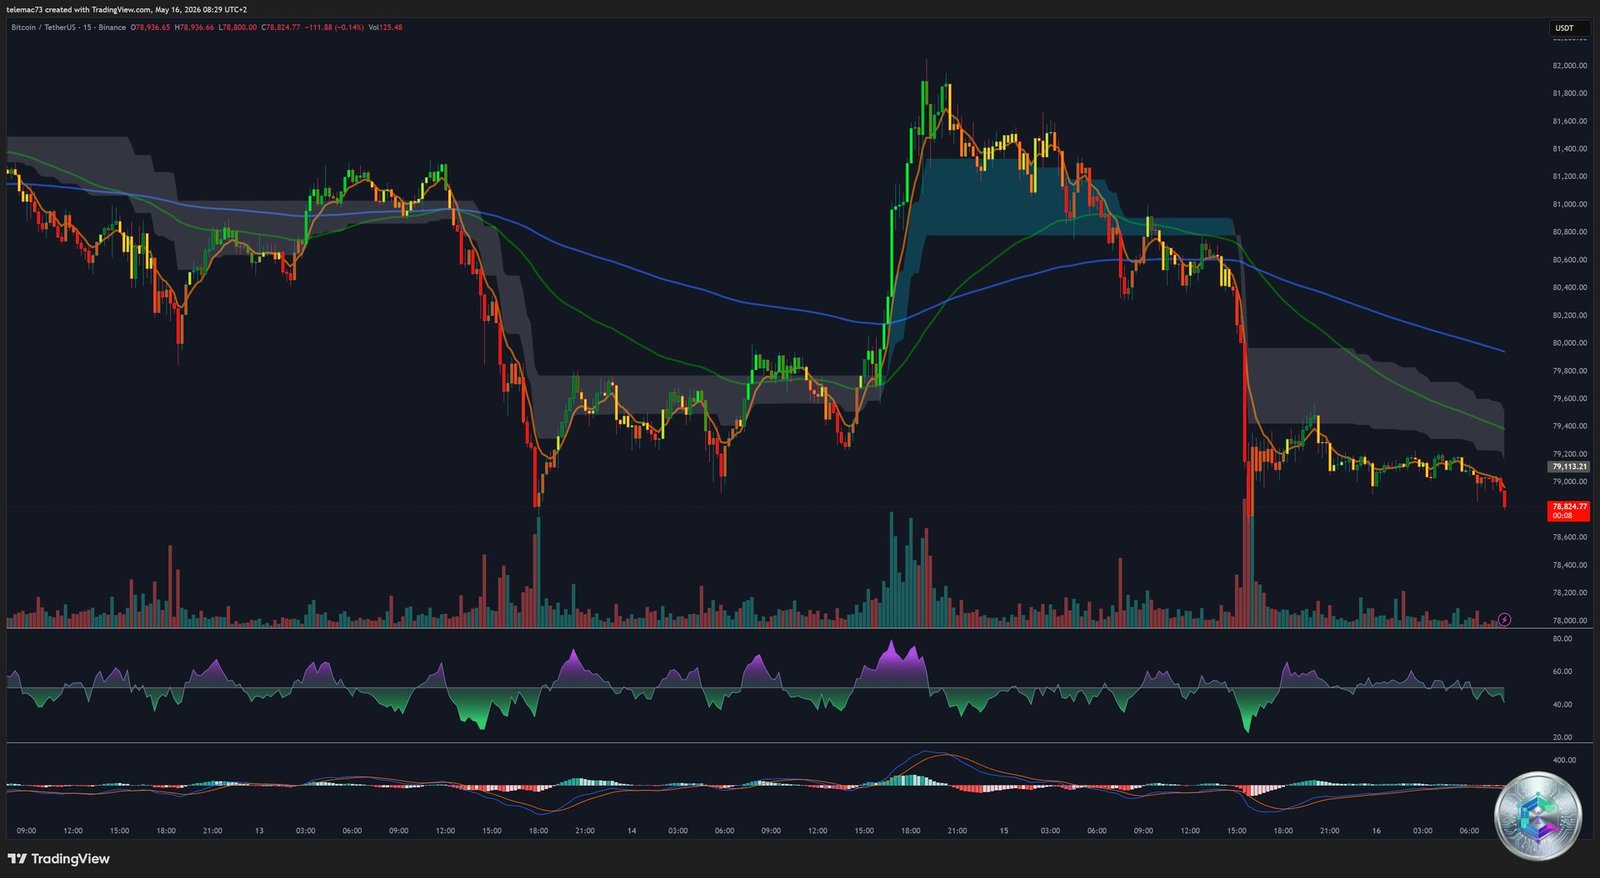
On the 15-minute chart, the analytical paradigm shifts entirely to surgical mapping of immediate liquidity pockets, dominated by high-frequency trading algorithms. The price action moves level-to-level with a very short price memory. The zone $81,105 – $80,965 is the current volumetric intraday control pivot: sustained acceptance below this threshold (confirmed by 3 consecutive 15-minute candle closes) would immediately open the door to a predatory algorithmic attack toward the critical support at $79,200 (last significant swing low).
Bollinger Bands (BBWP) reveal historically compressed volatility — a violent expansion is imminent. The succession of three consecutive lower highs signals a bias drifting dangerously toward seller control. A primary risk is a « fakie » (false bullish breakout) engineered to trap breakout buyers before orchestrating a violent return to the lower end of the congestion range.
🌡️ Liquidation Heatmap: A Market Walking on a Razor’s Edge
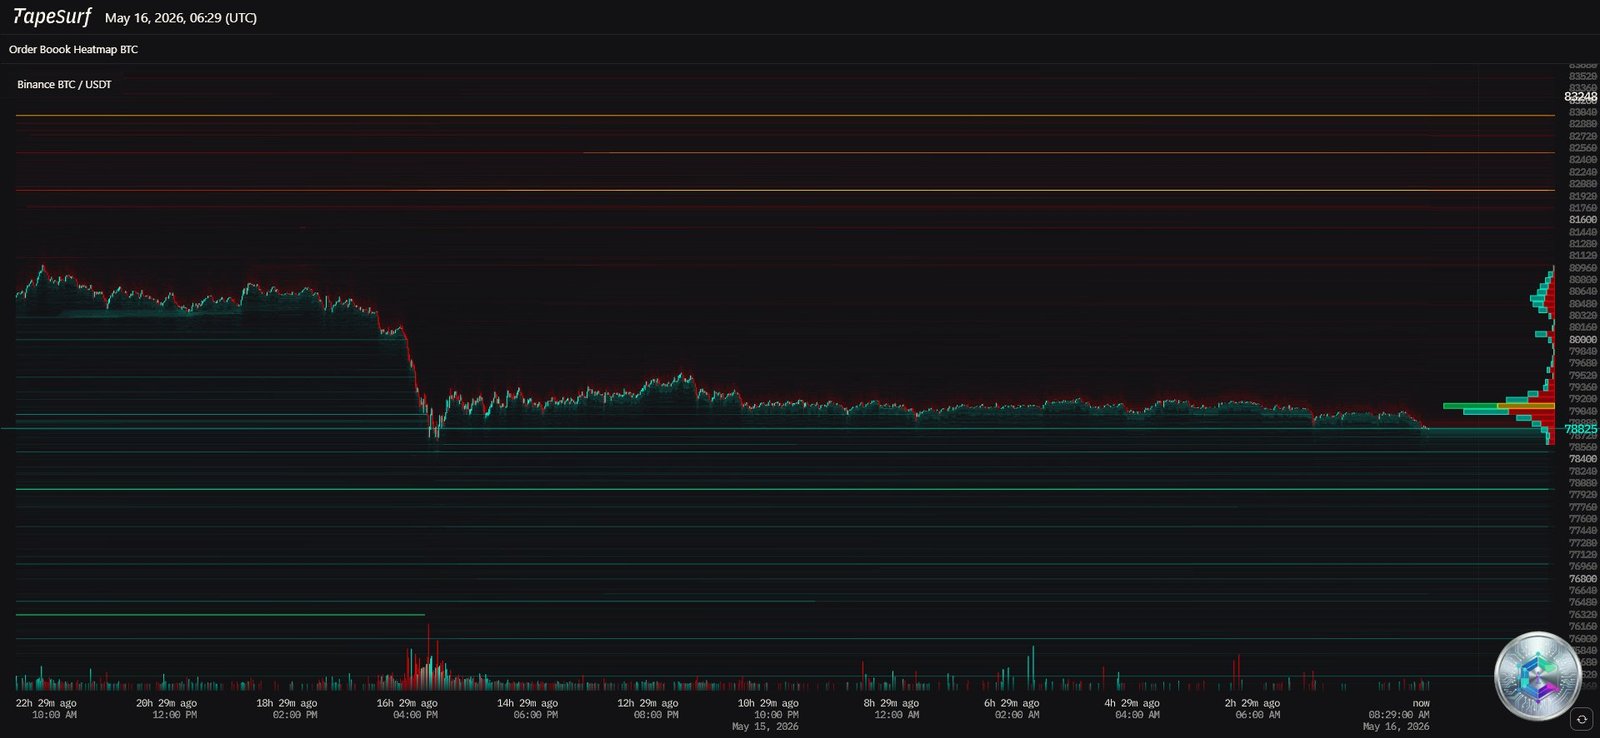
The liquidation heatmap paints an explosive picture of the current order book state. Bitcoin is literally bracketed by exceptionally dense liquidity clusters, with two diametrically opposed scenarios emerging with stark clarity:
| Price Zone | Cluster Type | Market Consequence |
|---|---|---|
| > $84,000–$85,400 | Historical distribution (~1.05M BTC) | Major structural resistance |
| $82,000–$83,000 | Overleveraged shorts (bright yellow bands) | Trigger for violent short squeeze |
| $81,105–$80,965 | HFT volumetric pivot | Algorithmic friction and decision zone |
| $79,800–$80,500 | Accumulated overleveraged longs | Trigger for bearish cascade (long flush) |
🚀 Short Squeeze Scenario (bullish): If institutional buying breaches the heavy $82,000–$83,000 ask wall, forced short liquidations would trigger mandatory algorithmic buy-to-cover orders, propelling price toward $85,000–$87,000 with the precise Fibonacci target at $85,286 (0.382 retracement).
📉 Long Flush Scenario (bearish): A decisive break below $80,000 (confirmed close under $79,200) would unleash a cascade of long liquidations into an already thin order book — exacerbated by the ongoing withdrawal of BTC to cold storage by long-term holders — causing brutal slippage toward $77,000 and potentially $75,622. This playbook was already validated on May 13: over $500M liquidated in hours, including $82M+ directly tied to BTC positions. Short-term holder profit-taking is additionally contributing ~$4M/hour worth of sell pressure near $80,000 — four times the normalized April baseline.
🔗 Altcoins: The Troubling Absence of Broad Market Participation
Bitcoin’s relative strength is not diffusing across the broader market — a characteristic symptom of prolonged capitulation phases (known as « lack of broader market alignment »). Ethereum languishes in a $2,223–$2,256 range, trapped in a long-term descending bull flag near annual lows, with the 200-day EMA at $2,600 and major structural resistance at $2,750. XRP, the theoretical primary beneficiary of the CLARITY Act, saw its intraday rally toward $1.55 immediately reversed; the $1.51–$1.57 ceiling has now held at four distinct tests since mid-February. DOGE idles at $0.1145 with zero directional conviction.
This altcoin non-participation is the symptom of risk appetite strictly confined to institutionally recognized store-of-value — Bitcoin. The ecosystem is not speculating; it is accumulating. The launch of 21Shares’ Hyperliquid spot ETF (THYP) on the Nasdaq, attracting a modest $1.2M on day one, signals that institutional infrastructure is being built for future regulated capital allocation toward protocol assets. However, these nascent flows remain marginal compared to the billions captured daily by Bitcoin.
🎯 Key Price Level Matrix
Resistances and Bullish Targets
- $82,000 – Absolute Breakout Pivot: EMA/SMA 200-day confluence. A clean daily close above = invalidation of the bearish congestion regime.
- $82,000–$83,000 – Liquidation Detonation Zone: Aggressive breach = inevitable algorithmic short squeeze.
- $83,132.33 – Elliott Wave (C) Mathematical Target: 138.2% extension of Wave A.
- $84,000–$85,400 – Historical Supply Block: ~1.05 million BTC accumulated historically. The true test of BlackRock IBIT-level demand absorption capacity.
- $90,000–$92,000 – End-of-Cycle Structural Target: Post-supply-block-absorption objective.
Supports and Bearish Risk Zones
- $79,800–$80,500 – Long Liquidation Floor: Intense friction zone. Breach = overleveraged long positions exposed to forced liquidation.
- $79,200 – Critical Invalidation Threshold: Last swing low. Volume-confirmed break = short-term bearish thesis validated.
- $77,000–$77,296 – 50-Day EMA: Dynamic intermediate support; last safety net before major structural deterioration.
- $75,622 – Fibonacci 0.236: Deep algorithmic retracement level; triggers pre-programmed institutional DCA buy programs.
- $65,000–$68,200 – Ultimate Liquidity Sink: The medium-term point of no return. A return here would signal a severe macroeconomic paradigm shift and a forced purge of all overleveraged participants.
📌 Conclusion: Tactical Patience and Smart Money Accumulation
Bitcoin on May 16, 2026 illustrates a market in deep systemic transition. Smart money — JPMorgan, Morgan Stanley, BlackRock, Metaplanet — accumulates silently while retail capitulates. Price appreciation can no longer rely on emotional speculation; it requires constant, massive injections of fresh fiat capital through regulated ETF infrastructure.
As long as US Treasury yields hold at annual highs dictated by the Federal Reserve, the opportunity cost of holding Bitcoin remains perceived as punitive by many institutional investment committees, preventing the kinetic force needed to validate a sustained breakout above $82,000. The catalyst for a structural rally toward $90,000–$92,000 will likely require a combination: final CLARITY Act passage, a Fed pivot toward accommodation, or an exogenous macro catalyst. Until then, the market is condemned to tactical patience — and smart money is ruthlessly exploiting this sideways exhaustion phase to silently acquire the value reserves being abandoned by the retail exodus, fundamentally redrawing Bitcoin’s ownership structure for the next decade.
⚠️ Legal Disclaimer: This article is written for educational and informational purposes only. It does not constitute financial advice, investment advice, or a recommendation to buy or sell any financial asset or cryptocurrency. Cryptocurrency markets are highly volatile and carry significant risk of capital loss. Please consult a qualified financial advisor before making any investment decision.

