
Introduction: A Market in Structural Transition
Bitcoin (BTC) is navigating a period of rare structural complexity in June 2026. After reaching all-time highs beyond $126,000, a confluence of exogenous factors — restrictive monetary policy, geopolitical tensions — and endogenous forces — record institutional outflows, concerning on-chain dynamics — triggered a severe correction, pulling the asset back into a critical demand zone oscillating between $60,000 and $63,800.
This report dissects, with maximum analytical granularity, the underlying forces currently governing Bitcoin’s price formation. The holistic approach integrates classical chart analysis, quantitative liquidation modeling, rigorous macroeconomic catalyst evaluation, and a deep reading of institutional and retail market psychology.
I. The Macroeconomic Environment: The Monetary Vise
The Statistical Paradox of the May 2026 CPI Report
The release of the U.S. CPI on June 10, 2026, constituted a seismic event for markets. Headline CPI recorded a +0.5% monthly increase, pushing the annual rate to 4.2% — a third consecutive acceleration, largely attributed to energy supply chain shocks exacerbated by geopolitical tensions around Iran.
Conversely, core CPI (excluding food and energy) rose only 0.2% month-over-month, below the 0.3% consensus estimate. This statistical dichotomy paralyzed trading desks: accelerating headline inflation argues for maintaining a « higher for longer » stance — theoretically destructive for non-yielding assets like Bitcoin — while decelerating core CPI offers an argument to dovish FOMC members.
The FOMC and the Warsh Doctrine
Under the leadership of new Fed Chair Kevin Warsh, the central bank adopted a severe anti-inflationary stance. A remarkably strong May NFP report — 172,000 jobs created vs. 85,000 expected — swept away hopes for an imminent rate cut. Probabilistic models now price in approximately 70% probability of another rate hike by December 2026, a spectacular reversal from dovish expectations just weeks prior.
Persistent rumors reported by the Financial Times suggest Warsh may dismantle the quarterly dot plot, viewing forward guidance as counterproductive. This potential removal of a major visibility tool adds an additional risk premium to financial markets, encouraging deleveraging and preventive liquidation of directional positions in Bitcoin.
| Macroeconomic Indicator | Value (May/June 2026) | Impact on BTC |
|---|---|---|
| Headline CPI (Annual) | 4.2% (Acceleration) | 🔴 Highly Bearish |
| Core CPI (Monthly) | 0.2% (Deceleration) | 🟡 Moderately Bullish |
| NFP Job Creation | 172,000 (vs 85,000 est.) | 🔴 Bearish |
| Rate Hike Probability (Dec. 2026) | ~70% | 🔴 Bearish |
The SpaceX IPO Rotation Myth
A dominant narrative in June 2026 posits that the colossal SpaceX IPO — targeting $75 billion raised at a $1.75 trillion valuation via ticker SPCX — is siphoning speculative liquidity away from crypto. However, rigorous chronological analysis refutes direct causality: the bulk of Bitcoin’s structural decline occurred before a single SpaceX share changed hands. The IPO acts as background noise potentially drying up marginal demand, but the forces of value destruction were fundamentally endogenous.
II. The Collapse of Institutional Flows
The Historic Bitcoin Spot ETF Hemorrhage
Over 13 consecutive trading sessions through mid-June 2026, Bitcoin spot ETFs recorded cumulative net redemptions reaching the staggering sum of $4.4 billion — the longest and most severe decapitalization sequence since their launch. This mechanical, price-agnostic selling pressure acts as an impenetrable glass ceiling: every rally attempt is systematically smothered by sell orders generated by ETF share unwinding.
The Psychological Shock: MicroStrategy’s Bitcoin Sale
MicroStrategy, the world’s largest corporate Bitcoin holder, sold a symbolic 32 BTC (~$2.5M) to cover tax obligations. While the nominal amount is infinitesimal, the psychological impact was devastating. The firm — erected as the paragon of perpetual accumulation — broke four years of absolute « HODL, » opening a crack in retail investor confidence.
MSTR stock itself now trades at a massive ~18% discount to the net asset value of its Bitcoin holdings — an aberrant configuration reflecting markets’ loss of confidence in the viability of its leveraged accumulation strategy in a high-rate environment.
III. On-Chain Pain: Network Profitability Dissected
According to K33 Research data, over 50% of total BTC supply is now trading below its holders’ acquisition cost — up from just 30% a month earlier. This majority « underwater » creates an invisible but devastatingly effective overhead supply: every bounce is perceived as a liquidity window to exit without a loss.
Paradoxically, cumulative realized losses (~$174.5B) remain below those of the 2022 bottom (~$211.5B), despite an exponentially larger market. This capitulation deficit suggests the market may not yet have reached its definitive cyclical floor.
IV. Technical Analysis: The Daily Chart
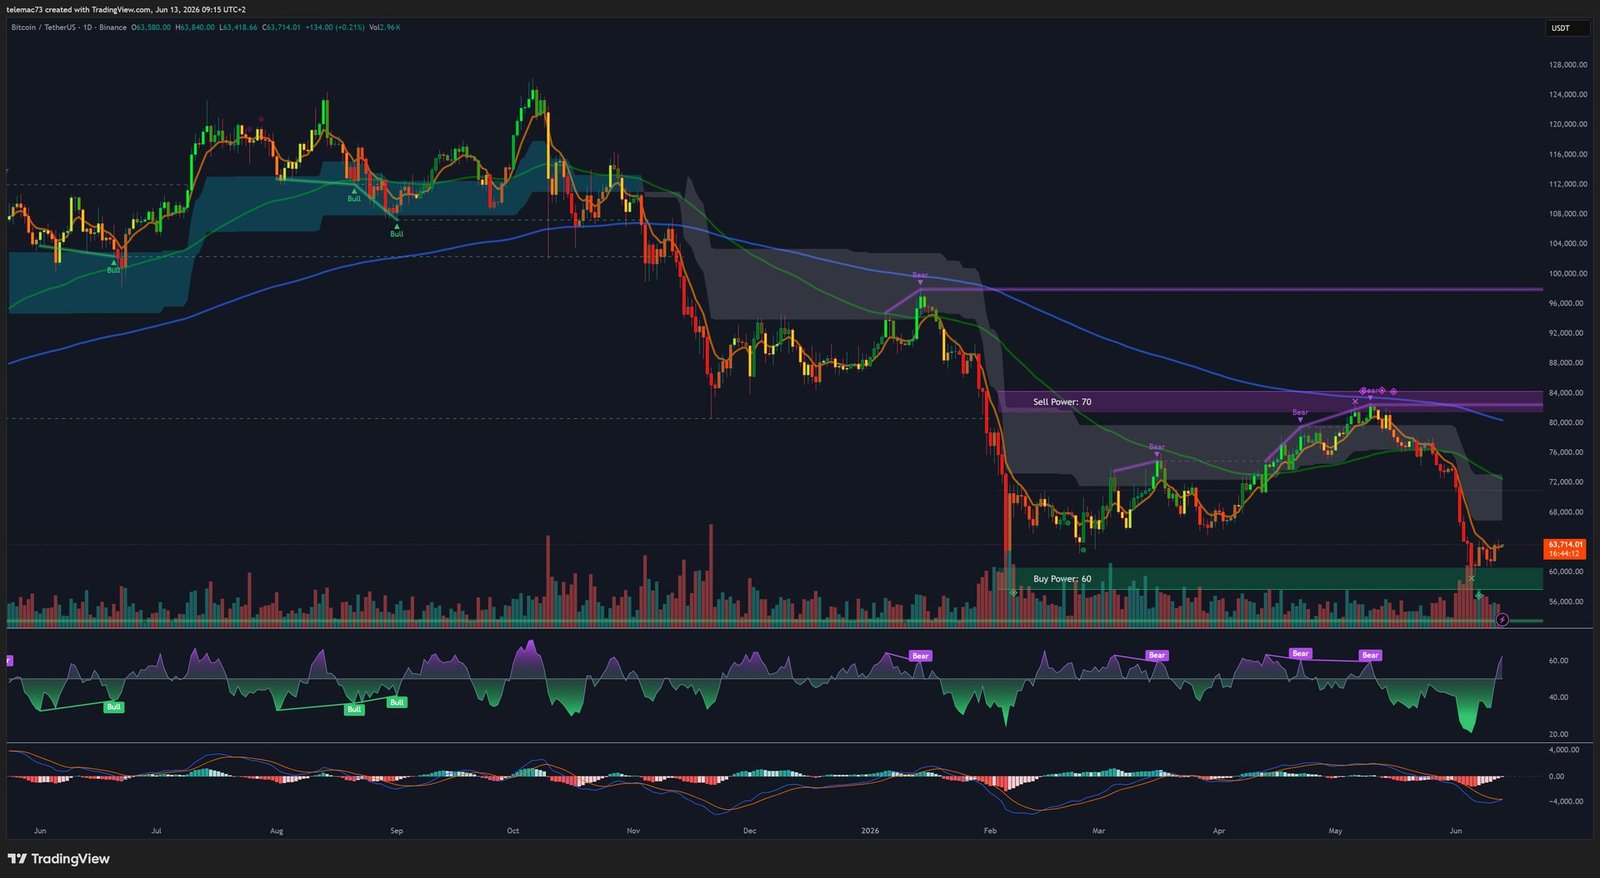
The Looming Death Cross
The daily chart reveals a fractured technical architecture. Bitcoin is struggling to maintain closes above the 200-Day Moving Average (200-MA) at $61,968.70 — the boundary separating bull and bear market regimes. More concerning: the 50-MA ($61,454.02) is converging toward the 200-MA in what could constitute a dreaded Death Cross, a signal that mechanically triggers sell algorithms in quantitative funds.
Oscillators Confirm Weakness
The 14-day RSI at 35.12 positions the asset in a zone of chronic weakness without extreme capitulation. The daily MACD at -51.45 displays a negatively expanding histogram — red bars elongating, attesting to accelerating distribution pressure. No bullish divergence is visible: the market is bleeding slowly rather than capitulating violently.
| Indicator (Daily) | Value | Signal |
|---|---|---|
| Current Price | ~$63,714 | Precarious consolidation |
| 200-MA | $61,968.70 | Macro structural support/pivot |
| 50-MA | $61,454.02 | Death Cross threat |
| 20-EMA | $61,478.57 | Dynamic resistance |
| RSI (14) | 35.12 | Weakness without oversold |
| MACD | -51.45 (expanding) | Accentuated negative momentum |
V. Medium-Term Structure: The 4-Hour Chart
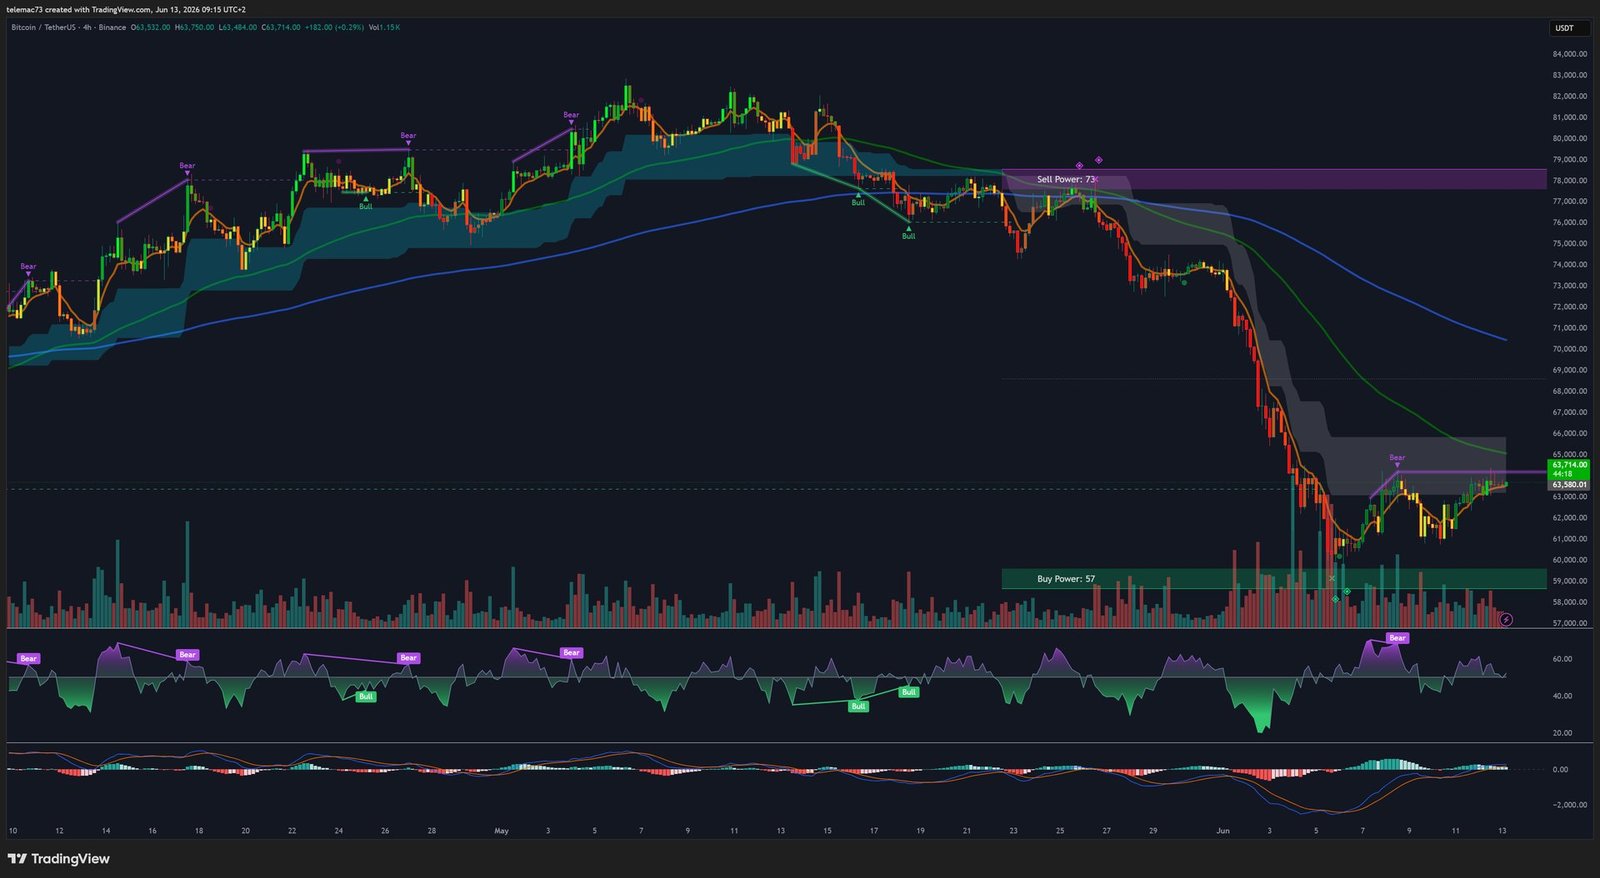
The 4H chart reveals a devastating asymmetry: Sell Power 73 vs. Buy Power 57. « Bear » annotations appear at every local peak, confirming a lower highs structure. The price navigates below a thick resistance cloud, signaling that recent participants’ cost basis all lie above the current price.
Bear Flag and Descending Triangles
Post-crash consolidation takes the form of a classic Bear Flag: following an impulsive plunge from $80,000, a lateral consolidation with declining volumes. The statistically dominant resolution of this pattern is a downside breakout, projecting a new leg down of equivalent amplitude to the initial flagpole. Descending triangles overlay this structure, with peaks sagging while the horizontal floor near $61,000–$62,000 gradually erodes.
VI. High-Frequency: The 15-Minute Chart
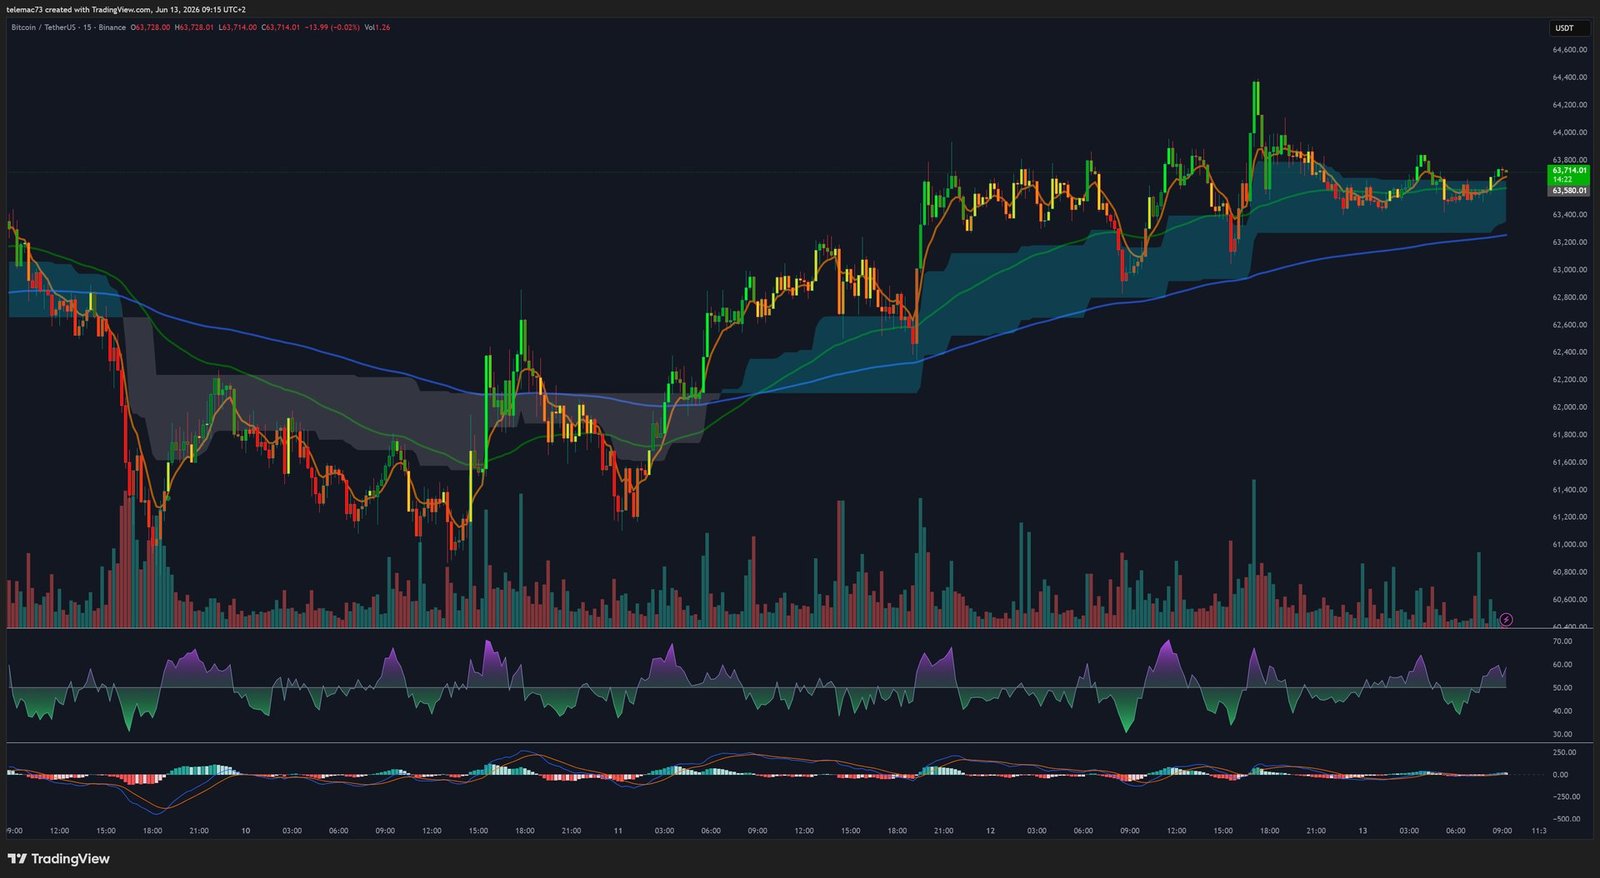
The 15-minute chart illustrates algorithmic violence around macro data releases. « Darth Maul candles » — featuring very long wicks and a tiny body — reveal the mechanics of institutional stop hunts: artificially propelling the price beyond obvious local resistances to trigger sellers’ stops, then immediately reversing to liquidate buyers. Once retail liquidity is purged, the market resumes its initial trend. Oscillators (RSI, Stochastic) oscillate frantically between overbought and oversold, their predictive utility essentially nil at this timeframe.
VII. Liquidation Topography: The Heatmap
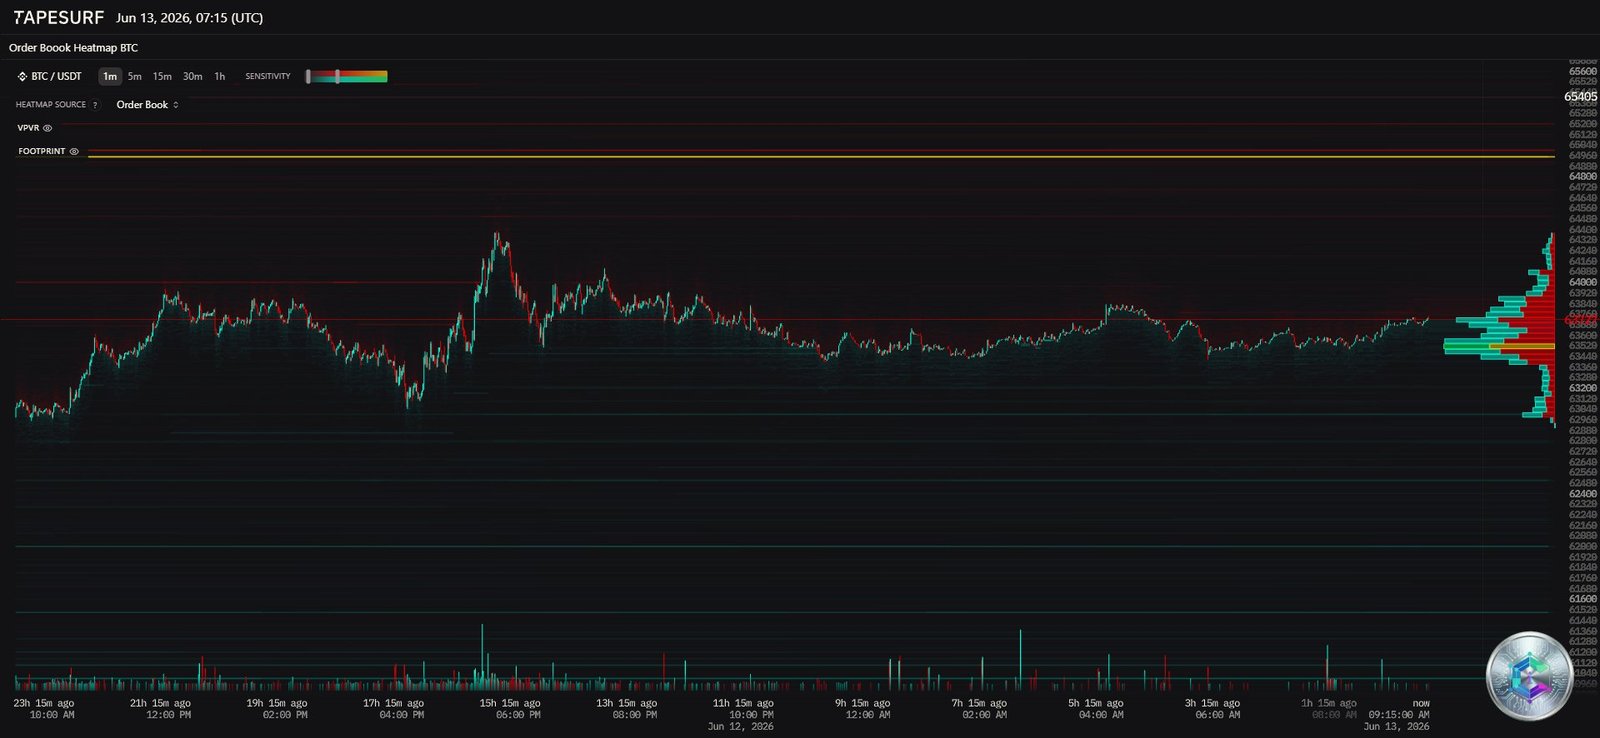
The heatmap captured June 13 at 07:15 UTC reveals a massive Point of Control (PoC) located in the $63,500–$63,900 range — the level where the market has exchanged the greatest historical volume, creating a zone of very high friction. Above the current price, thick institutional sell walls stretch around $64,800 and $65,000, acting as a reinforced concrete ceiling.
Below the critical support at $60,500 and extending into the $59,000 zone, an « ocean » of long liquidations has accumulated — built up by leveraged traders who prematurely bought the dip. Market dynamics act like a predator drawn toward these liquidity concentrations: a break below $60,500 would trigger a chain-reaction liquidation cascade capable of erasing thousands of dollars in minutes.
VIII. Probabilistic Modeling: Two Scenarios
🔴 Scenario Alpha (Dominant): Purge and Capitulation
The most probable scenario, supported by the confluence of bearish patterns (4H Bear Flag, descending triangles), negative momentum (daily MACD in negative expansion, RSI at 35), Death Cross threat, and absence of on-chain capitulation, is a downside resolution. Mechanical ETF outflow pressure ($4.4B) and the exorbitant cost of capital dictated by a hawkish Fed will eventually exhaust buy orders between $60,500 and $61,000.
A confirmed daily close below $60,500 would serve as an algorithmic catalyst, projecting price toward $59,000 or lower, in a violent but salutary capitulation event — the fundamental precondition for forging a genuine cyclical bottom.
🟢 Scenario Beta (Minority): Institutional Absorption and Short Squeeze
Invalidating the bearish thesis would require an exceptional positive exogenous shock: an unexpected Fed rhetoric shift or an unanticipated global liquidity injection. Price would need to reclaim the 200-MA at $61,968 and confirm with a weekly close above $63,000, annihilating the lower highs structure and triggering a short squeeze toward dormant liquidity pools above (~$85,650 and ~$93,000).
In the absence of tangible quantitative signals (anemic buy volumes, continuous ETF outflows, deteriorating daily momentum), current market microstructure demands capital preservation.
Key Levels to Watch
| Zone | Price | Role |
|---|---|---|
| 🔴 Major Resistance | $65,000 | Institutional sell wall (Heatmap) |
| 🔴 Dynamic Resistance | $63,000 – $63,500 | PoC + 200-MA + 20-EMA (confluence) |
| 🟡 Current Price | ~$63,714 | Precarious consolidation zone |
| 🟢 Critical Support | $61,000 – $61,500 | 50-MA + triangle floor |
| 🟢 Ultimate Support | $60,500 | Last line of bullish defense |
| ⛔ Bearish Target | $59,000 | Ocean of long liquidations |
⚠️ Disclaimer: This article is written for exclusively educational and informational purposes. It does not constitute investment advice, nor a recommendation to buy or sell digital assets. Cryptocurrency markets are extremely volatile and carry high risks of capital loss. Please consult a qualified financial advisor before making any investment decision. Cryptoinfo.ch disclaims all liability for decisions made based on this information.