


As of May 26, 2026, the global cryptocurrency market presents a highly complex structural paradigm, marked by macro-level consolidation following intense cyclical volatility. A rigorous assessment of the BTC/USDT exchange rate demands a multi-dimensional approach integrating macro-timeframe technical structures, medium-term momentum indicators, short-term intraday volatility, and deep order-book liquidity mechanics.
Macro Structure: Bitcoin Between Recovery and Major Resistance
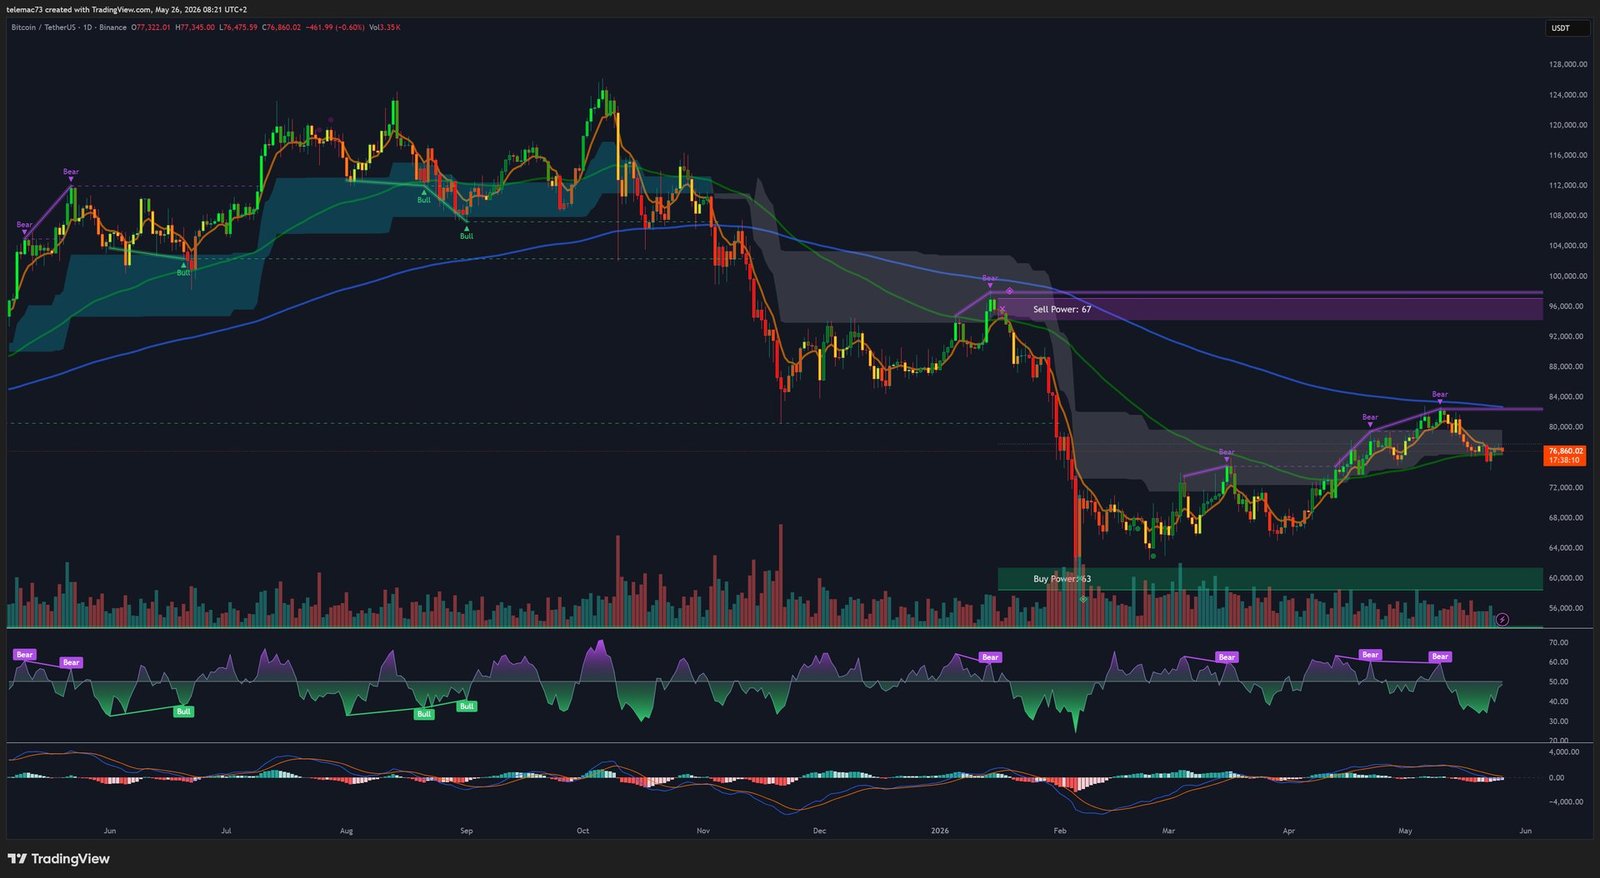
Examining the daily timeframe (1D chart) provides the indispensable macroeconomic context for understanding the current BTC/USDT price action, which is hovering in the $76,860 to $77,322 range. The macro structure reveals a market that has undergone a historic expansion followed by a severe, systemic correction, and is now engaged in a protracted phase of price discovery and structural repair.
The Cyclical Peak and Institutional Distribution
The most defining feature of the macro chart is the parabolic expansion that culminated in a historic distribution top. Price action aggressively breached the $100,000 psychological threshold, ultimately establishing an all-time structural high in the $120,000 to $124,000 region. This euphoric price discovery phase represents a period of extreme market exuberance, driven by a confluence of macroeconomic liquidity injections, institutional adoption narratives, and aggressive retail leverage.
The apex of this move is characterized by sharp, volatile wicks and the subsequent formation of lower highs, signaling a transition from aggressive markup to institutional distribution. The failure to sustain $120,000 triggered a cascading sequence of liquidation events, carving a steep, multi-month descending channel of strong bearish momentum onto the chart.
Capitulation and the Establishment of the Macro Floor
The descending structural geometry culminated in a violent capitulation event, driving BTC/USDT down to a foundational support level near $60,000. This zone is explicitly denoted by the « Buy Power: 63 » overlay. This floor represents a roughly 50% drawdown from the cyclical peak — a severe but standard corrective retracement common in highly leveraged digital asset markets.
The Buy Power overlay at this level suggests a significant influx of programmatic and institutional accumulation. The volume profile during this capitulation phase demonstrates a climax event, indicating a transfer of assets from weak hands to strongly capitalized entities. This $60,000 level now serves as the absolute macro invalidation point for the current recovery phase.
The Current Recovery and Overhead Resistance
Following the defense of the $60,000 floor, the market has embarked on a labored, multi-wave recovery sequence, lifting price back to the current $76,860 level. This recovery is heavily contested at every major Fibonacci and historical resistance node. The daily chart highlights a massive overhead supply zone designated « Sell Power: 67, » situated broadly in the $90,000 to $96,000 range — the primary bottleneck for macro continuation.
| Macro Level | Price Range (USD) | Structural Significance |
|---|---|---|
| Historical Cyclical Peak | $120,000 – $124,000 | Absolute Macro Resistance / Distribution |
| Primary Supply Block (Sell Power: 67) | $90,000 – $96,000 | Heavy overhead resistance — trapped long capitulation zone |
| Current Market Price | $76,860 – $77,322 | Mid-range equilibrium / Indecision / Localized accumulation |
| Foundational Macro Floor (Buy Power: 63) | $60,000 – $62,000 | Deep value accumulation — Institutional defense |
Medium-Term Microstructure: The 4-Hour Timeframe
Zooming into the 4-hour timeframe reveals a market operating in a state of high-tension equilibrium, characterized by complex algorithmic interactions and a delicate balance between localized supply and demand.
Moving Average Dynamics and Trend Diagnostics
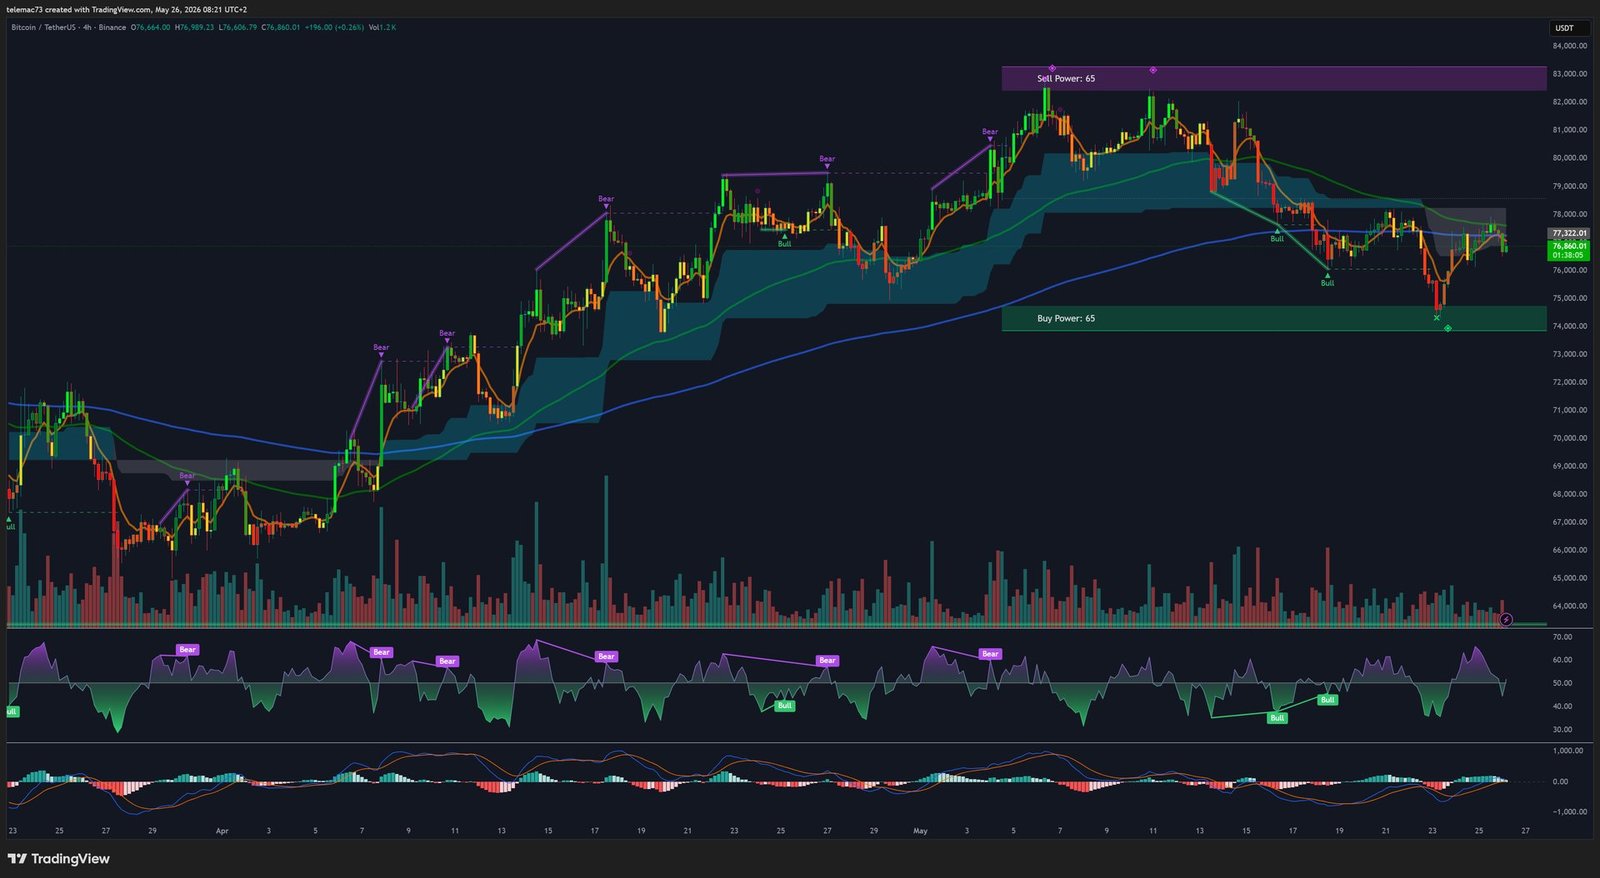
The 4-hour chart displays price trading at approximately $77,322, nestled within a complex ribbon of moving averages and a custom algorithmic cloud indicator. The immediate structural history shows a successful, impulsive rally from the mid-$60,000s, peaking above $83,000, before being rejected and retracing back into the current $76,000–$77,000 consolidation block.
The moving averages are currently in a state of convergence — commonly referred to as a « squeeze. » This severe contraction in volatility signals the imminent approach of a directional expansion. Price oscillates tightly around these averages, using them alternately as micro-support and micro-resistance: a market waiting for a systemic catalyst to dictate the next directional vector.
The Perfect Equilibrium of Power Overlays
One of the most striking features of the 4H chart is the explicit quantification of market forces via the « Buy Power: 65 » and « Sell Power: 65 » overlays. The absolute parity of these two metrics confirms that the market is in a state of perfect, albeit temporary, equilibrium. The $77,322 level is essentially the midpoint of a high-stakes tug-of-war between institutional accumulators defending the macro recovery and short-term speculators attempting to push the asset back toward its floor.
Oscillator Divergences and Momentum Shifts
The oscillator on the 4H chart is emerging from a deep bearish trough and attempting to cross the zero-line. This transition is marked by a localized bullish divergence: while price action was making lower lows during the retracement from $83,000, the oscillator was forming higher lows. This mechanical divergence suggests that underlying bearish momentum is exhausting itself. If the oscillator successfully sustains a breakout into positive territory, it will likely provide the algorithmic confirmation required to break through the Sell Power: 65 ceiling.
Intraday Volatility: The 15-Minute Timeframe
To understand the immediate, real-time pressures acting upon BTC/USDT on May 26, 2026, an analysis of the 15-minute timeframe is essential. This micro-resolution exposes the granular mechanics of intraday liquidity hunting.
Anatomy of the Intraday Sell-Off
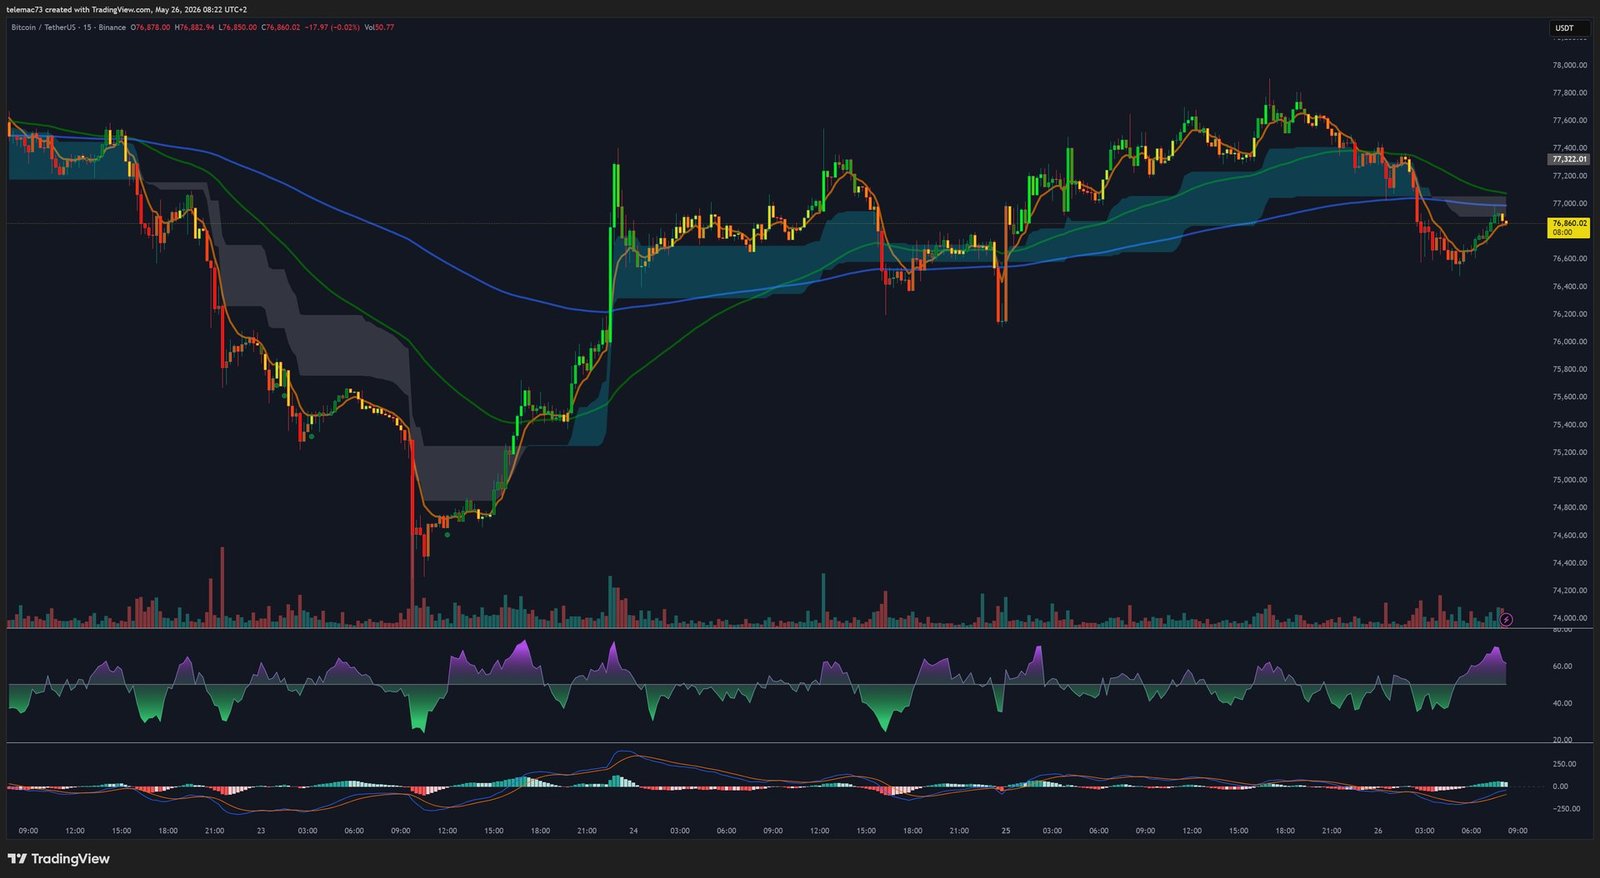
The 15-minute chart captures a highly volatile intraday sequence. Price, having recently tested the upper boundaries of local resistance near $77,600, experienced a sharp, aggressive breakdown symbolized by a cascade of high-volume red candlesticks, driving price down to the $76,860 level. This localized breakdown is characteristic of a « liquidity grab »: market makers and dominant algorithmic players engineer short-term price drops to trigger stop-loss orders situated below obvious support levels, generating the artificial liquidity required to fill their own long positions at a discount.
Cloud Inversion and Short-Term Bearish Bias
The custom cloud indicator on the 15-minute chart provides immediate visual feedback regarding intraday trend geometry. The sheer velocity of the sell-off caused a structural inversion: the cloud has flipped to a bearish configuration, thickening and hovering above the current price action as immediate dynamic resistance in the $77,100 to $77,200 range. For the intraday trend to neutralize, price must reclaim this cloud.
Consolidation and the Search for Micro-Support
At the time of the snapshot, the market is attempting to halt the intraday bleeding. Candlesticks have transitioned from elongated, impulsive red bodies to small, alternating doji and spinning top formations, signifying indecision and a localized cessation of selling pressure. The market is probing the $76,800 level to determine if sufficient passive bid liquidity exists to establish a micro-floor. If this level fails, the 15-minute structure suggests a rapid descent toward the more robust 4H Buy Power zone located near $74,000.
| Timeframe | Trend Bias | Key Support | Key Resistance |
|---|---|---|---|
| 1-Day (Macro) | Corrective Recovery | $60,000 | $90,000 – $96,000 |
| 4-Hour (Medium) | Neutral / MA Squeeze | $73,000 – $74,000 | $79,000 – $83,000 |
| 15-Min (Micro) | Bearish / Oversold | $76,800 | $77,100 – $77,200 |
Deep Order Book Dynamics: The TapeSurf Liquidity Heatmap
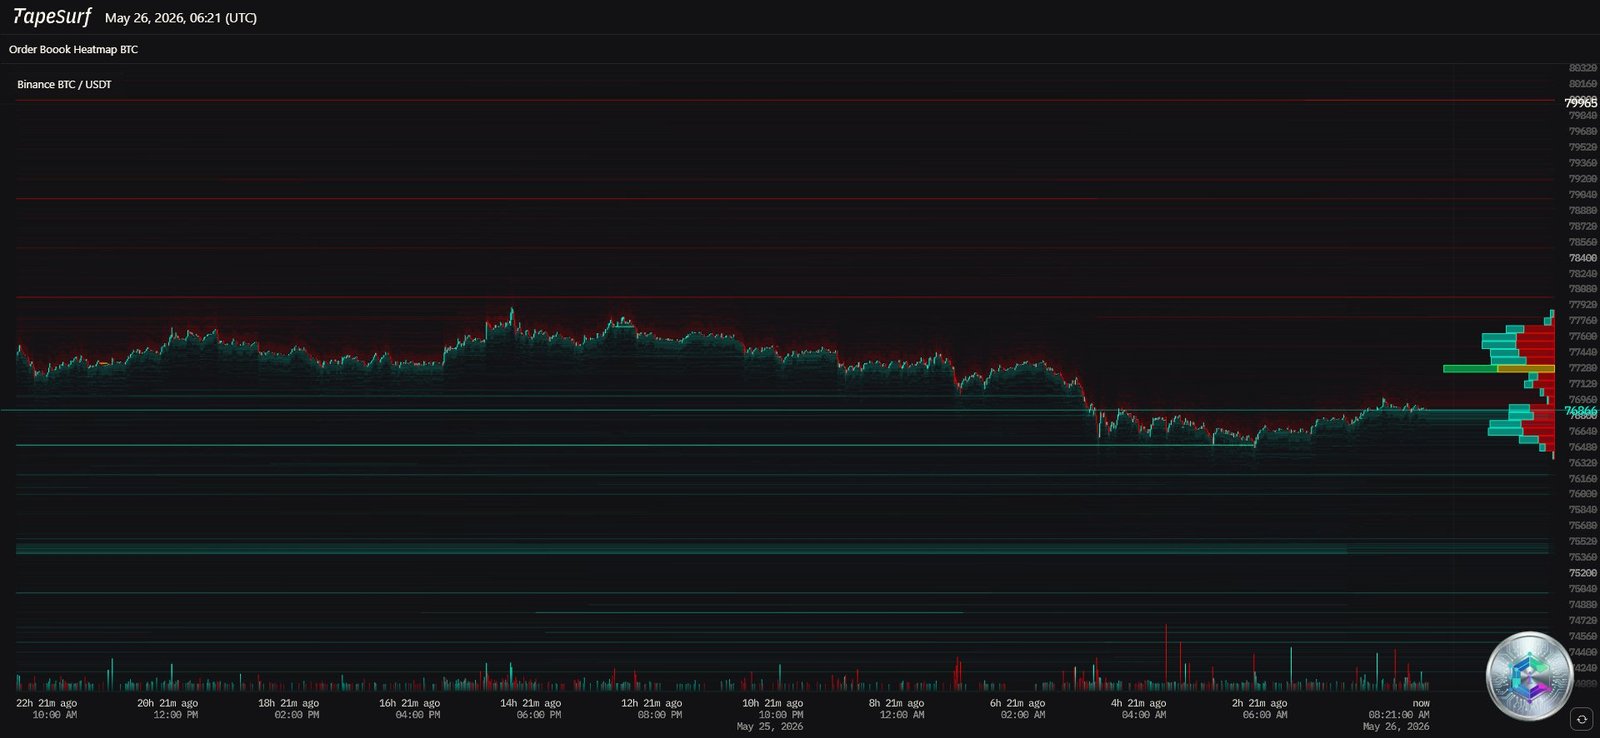
While candlestick charts visualize historical executed transactions, the order book heatmap provides a predictive window into the actual resting liquidity of the Binance BTC/USDT market at 06:21 UTC on May 26, 2026. This visualization represents the limit orders — the « maker » capital — that dictates where price will struggle to advance and where it is likely to bounce.
The Wall of Overhead Resistance
Above the current price, the heatmap reveals dense, multi-layered bands of liquidity (red and yellow) stretching from approximately $77,200 up toward the psychological $80,000 threshold. This confirms the Sell Power diagnostics derived from the candlestick charts: massive limit sell walls are actively defending the upper range. For price to break through $80,000, organic buying volume must be overwhelming enough to completely absorb these resting limit orders — a process that requires immense capital expenditure and a highly bullish macroeconomic catalyst.
The Bid Structure and the Liquidity Void
Examining the region below the current price reveals cyan bands indicating resting bid liquidity near $76,800, but the truly dense concentration of buy orders — the « walls » of support — is located significantly lower, correlating with the $73,000–$74,000 zone identified on the 4H chart.
The relative sparsity of thick bid walls immediately below current price action corroborates the vulnerability seen on the 15-minute chart. If the minor support at $76,800 gives way, the order book suggests a « liquidity void » — an area with relatively few limit orders to slow down a price drop — until the asset reaches the deeper, institutional bid clusters lower down. The TapeSurf heatmap fundamentally proves that the current market equilibrium is fragile, and the path of least resistance, strictly from a resting liquidity standpoint, may be slightly downward until those deeper bids are engaged.
Strategic Synthesis and Market Outlook
From a purely technical standpoint, Bitcoin is engaged in a delicate, medium-term stabilization process following a historic cyclical drawdown. The defense of the $60,000 macro floor has successfully initiated a recovery, but the asset is currently ensnared in a high-friction consolidation zone between $76,800 and $77,300.
Multi-timeframe analysis reveals conflicting immediate pressures: the 4H momentum suggests underlying bullish divergence attempting to force a breakout, while the 15-minute microstructure and TapeSurf liquidity heatmaps indicate immediate, heavy overhead supply and pronounced intraday vulnerability.
The market is coiled. It requires a significant influx of organic, market-taking volume to chew through the dense limit sell orders resting between $77,200 and $80,000. Failure to attract this volume will likely result in a reversion to the deeper liquidity pools resting in the lower $70,000s.
⚠️ Disclaimer: This article is written for educational and informational purposes only. It does not constitute investment advice, a recommendation to buy or sell cryptocurrencies, or any financial solicitation of any kind. Cryptocurrency markets are extremely volatile and carry significant risk of capital loss. Please consult a qualified financial advisor before making any investment decisions.

