


Introduction: A Market in Structural Redefinition
As May 2026 draws to a close, Bitcoin (BTC) is navigating a critical consolidation phase. After failing to hold the major resistance at $77,000, the asset entered a pronounced bearish correction, slipping below the psychological $74,000 threshold to test vital support zones around $73,000. This dynamic unfolds amid a cyclical seasonal weakness pattern, raising profound questions about the resilience of the current bull market.
A proper analysis demands a multidimensional approach: geopolitical tensions, institutional flows via ETFs, DeFi security turbulence, price action across multiple timeframes, and liquidity heatmap analysis.
1. Macroeconomic Context: The Geopolitical Chessboard
The Strait of Hormuz and the Energy Risk Premium
One of the most influential macroeconomic catalysts of the month has been the crisis around the Strait of Hormuz, a vital artery through which approximately one-fifth of global oil supply flows. The US administration imposed a naval blockade (Operation Epic Fury) in response to Iranian attempts to control maritime traffic by military force. This generated a massive geopolitical risk premium on energy markets, forcing the Federal Reserve to maintain a restrictive monetary policy — historically unfavorable for risk assets like Bitcoin.
De-escalation and the Paradoxical Market Reaction
Recent diplomatic developments point to an imminent lifting of the naval blockade, with a preliminary agreement stipulating the return of commercial navigation to pre-war levels within 30 days and complete demining of the waterway. While this easing propelled the S&P 500 and Nasdaq to new all-time highs, the crypto sector paradoxically continues to underperform — a telling de-correlation revealing deep endogenous weaknesses, as capital rotates toward AI tech stocks rather than Bitcoin.
2. Institutional Dynamics: The ETF Capital Flight
The second half of May 2026 was marked by an unprecedented capital hemorrhage. US spot Bitcoin ETFs recorded up to ten consecutive sessions of net outflows, totaling between $2.8 billion and $4.01 billion withdrawn.
| ETF Flow Indicator (May 2026) | Data | Market Implication |
|---|---|---|
| Cumulative net outflows | $2.8B — $4.01B | Tactical institutional retreat |
| Max daily outflows | $125M — $228M | Constant sell-side pressure |
| BlackRock IBIT | -$68.9M end of week | Even market leaders face redemptions |
| Morgan Stanley BTC ETF | -$5.26M (first net outflow) | Sentiment shift among top wealth managers |
These redemptions signal a major tactical retreat by wealth managers and hedge funds. Bloomberg analysts note that « big boy money » is not interested in BTC’s erratic volatility, seeking « gold-like » returns instead. With massive AI IPOs looming (SpaceX, OpenAI), a sectoral rotation is taking place at crypto’s expense. That said, these outflows represent only ~8% of the $36 billion in historical net inflows, and retail buyers are actively absorbing the supply.
On the corporate treasury front, MicroStrategy (holding over 843,738 BTC valued at $62 billion) briefly sparked panic by transferring 411.5 BTC to Coinbase Prime. Although the operation was reversed hours later, this incident highlights extreme market fragility and confirms no new corporate purchases since mid-May.
3. Regulatory Landscape: The CLARITY Act
On May 14, 2026, the US Senate Banking Committee advanced the Digital Asset Market Clarity Act (CLARITY Act), a 309-page bill establishing a comprehensive regulatory framework. The primary objective is to resolve the long-standing jurisdictional conflict between the SEC and the CFTC: the latter would gain oversight of « digital commodities » (Bitcoin, Ethereum), while the SEC would retain jurisdiction over security-like assets.
The most contentious political point concerns stablecoins: under banking lobby pressure, the bill prohibits interest or yield payments on payment stablecoins to prevent deposit flight from commercial banks. Uncertainty over final passage (67-75% probability per Polymarket) keeps institutional actors in a wait-and-see posture.
4. Systemic Threats: DeFi Under Pressure
Spring 2026 proved disastrous for DeFi protocol security. April recorded over $651 million drained, mainly through two North Korean Lazarus Group attacks: the Drift protocol exploit ($285M) and the Kelp DAO bridge hack ($292M). May revealed a more insidious structural vulnerability — a relentless succession of $2-$12M incidents — prompting OpenZeppelin’s founder to declare all of DeFi fundamentally « unsafe. »
On-chain metrics corroborate market deterioration: whale net outflows reached 648,000 BTC during the last week of May, the highest distribution level since February. The Fear & Greed index fell to 33, confirming a deep psychological shift toward fear.
5. Liquidity Heatmap Analysis
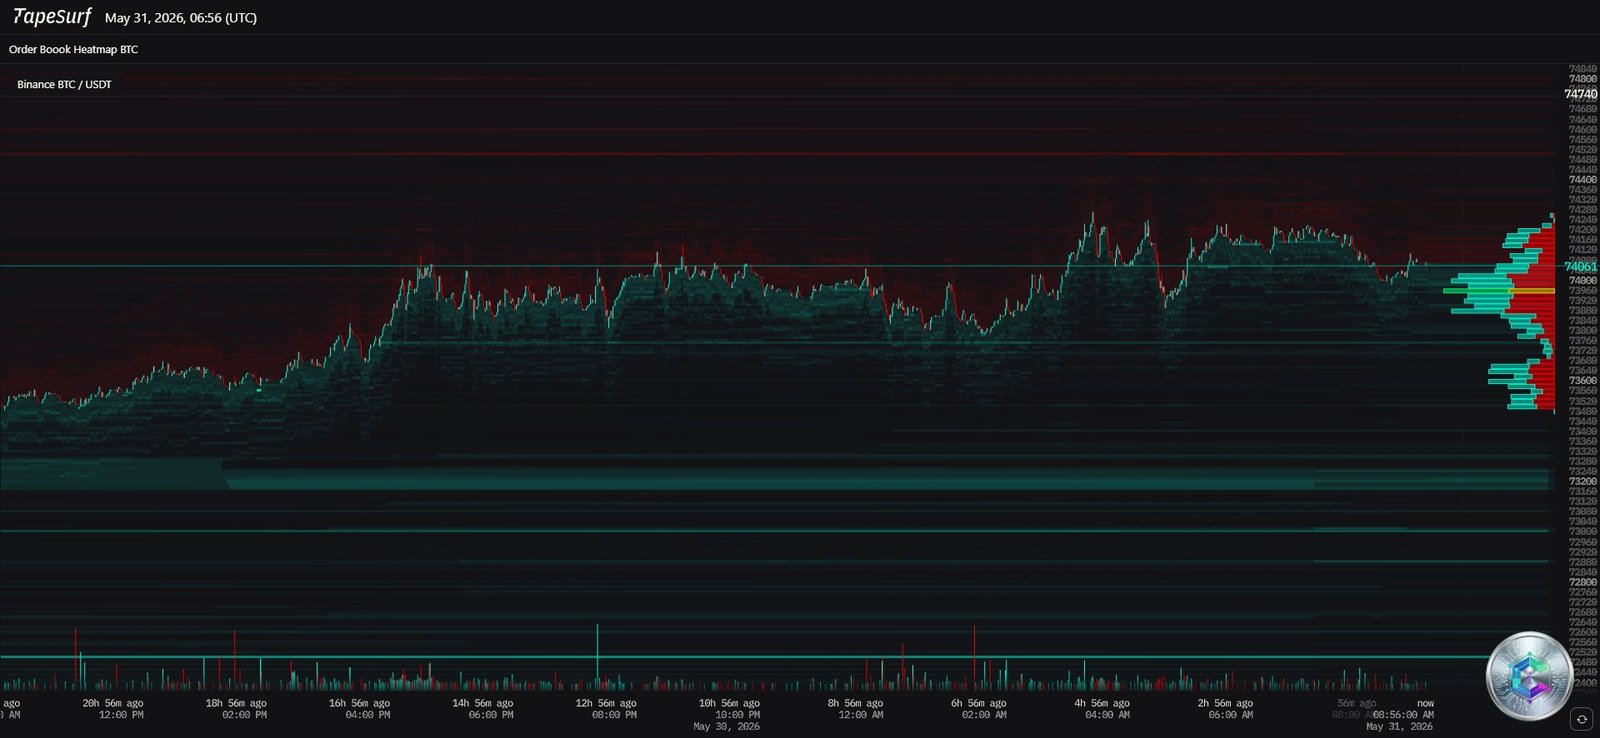
The order book heatmap reveals a clear liquidity stratification. Above the current price (~$74,061 at capture), thick red bands represent massive sell walls concentrated at $74,800–$75,000 and toward $78,000. For price to break through these levels, an aggressive wave of market buy orders would need to absorb all pending supply.
Below spot, cyan and green bands mark layered buy walls between $73,000 and $72,000. On-chain data confirms: over 6,235 BTC (~$443M) positioned as bid liquidity between $72,000 and $70,000, with an additional 1,012 BTC cluster at $68,505. When BTC broke below $73,000, the Bid/Ask ratio turned positive for the first time since April 12 — a partial stabilization signal.
6. Technical Analysis: Daily Chart (1D)
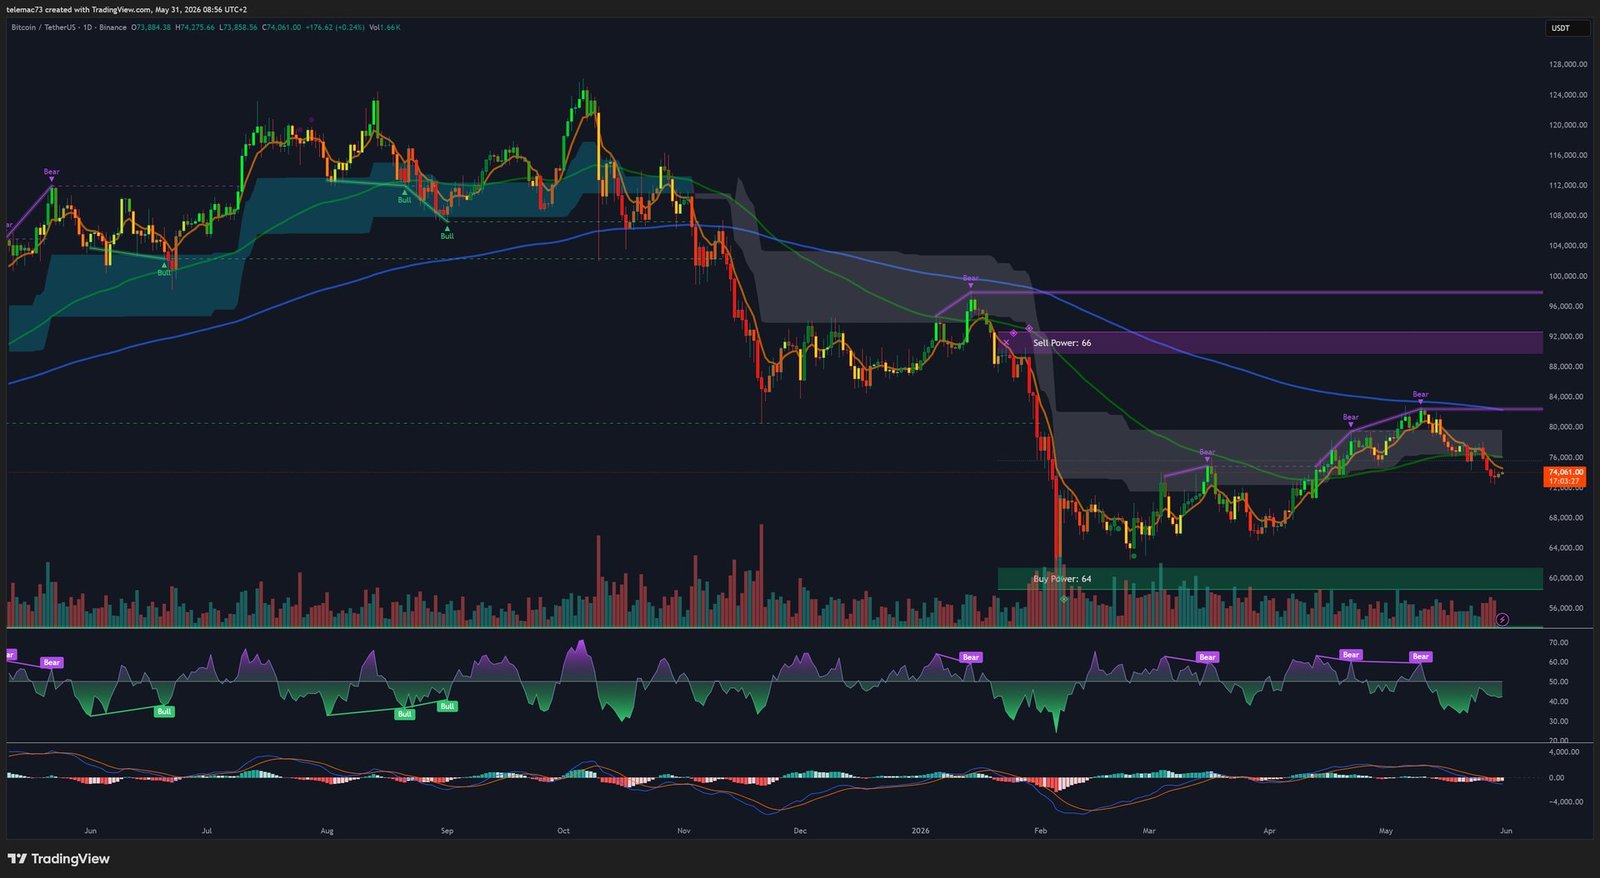
The daily chart reveals significant technical deterioration. The market is forming a textbook sequence of lower highs and lower lows, the canonical definition of a downtrend. BTC has slipped below its 50-day EMA — the first serious medium-term momentum weakness since mid-April — with this moving average now curving downward and acting as relentless dynamic resistance. The daily RSI oscillates between 35 and 40, and the MACD displays a confirmed Death Cross with its histogram deeply entrenched in negative territory.
7. Technical Analysis: 4-Hour Chart (4H)
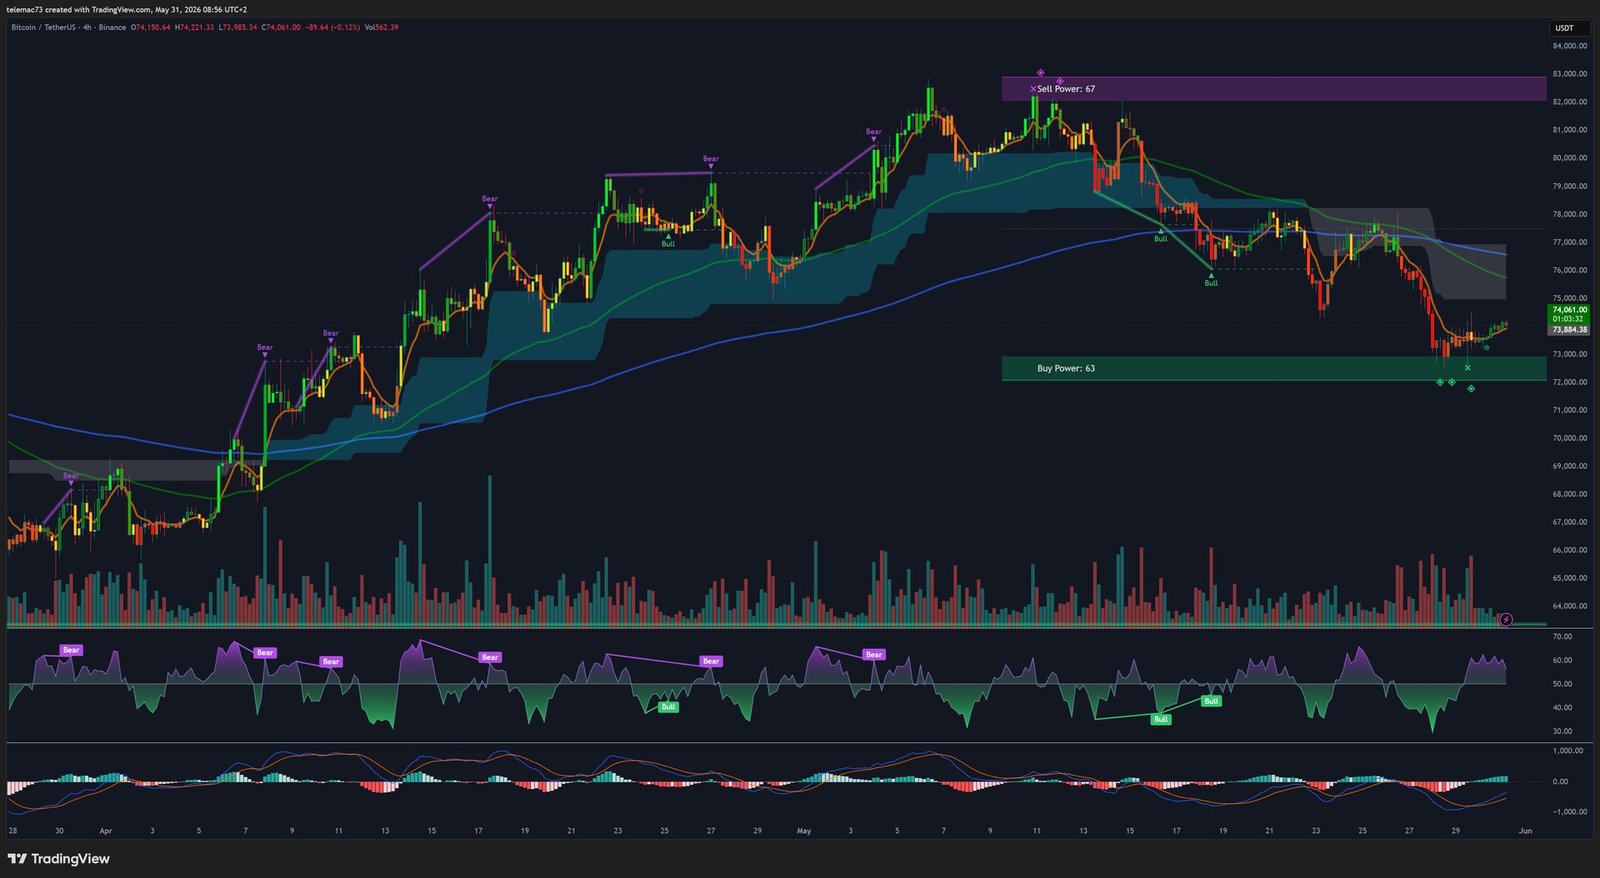
The 4H chart highlights the Ichimoku cloud / moving average ribbon system. The price aggressively broke through the cloud downward — it has twisted and widened into a dark shade, now acting as thick overhead resistance between $81,000 and $83,000. The 4H price action reveals repeated bear flags: after each bearish impulse, price consolidates in a narrow ascending channel at low volume before breaking support for the next leg down. The 4H RSI displays hidden bearish divergences, confirming entrenched sell-side pressure suppressing every recovery attempt.
8. Technical Analysis: 15-Minute Chart (Intraday)
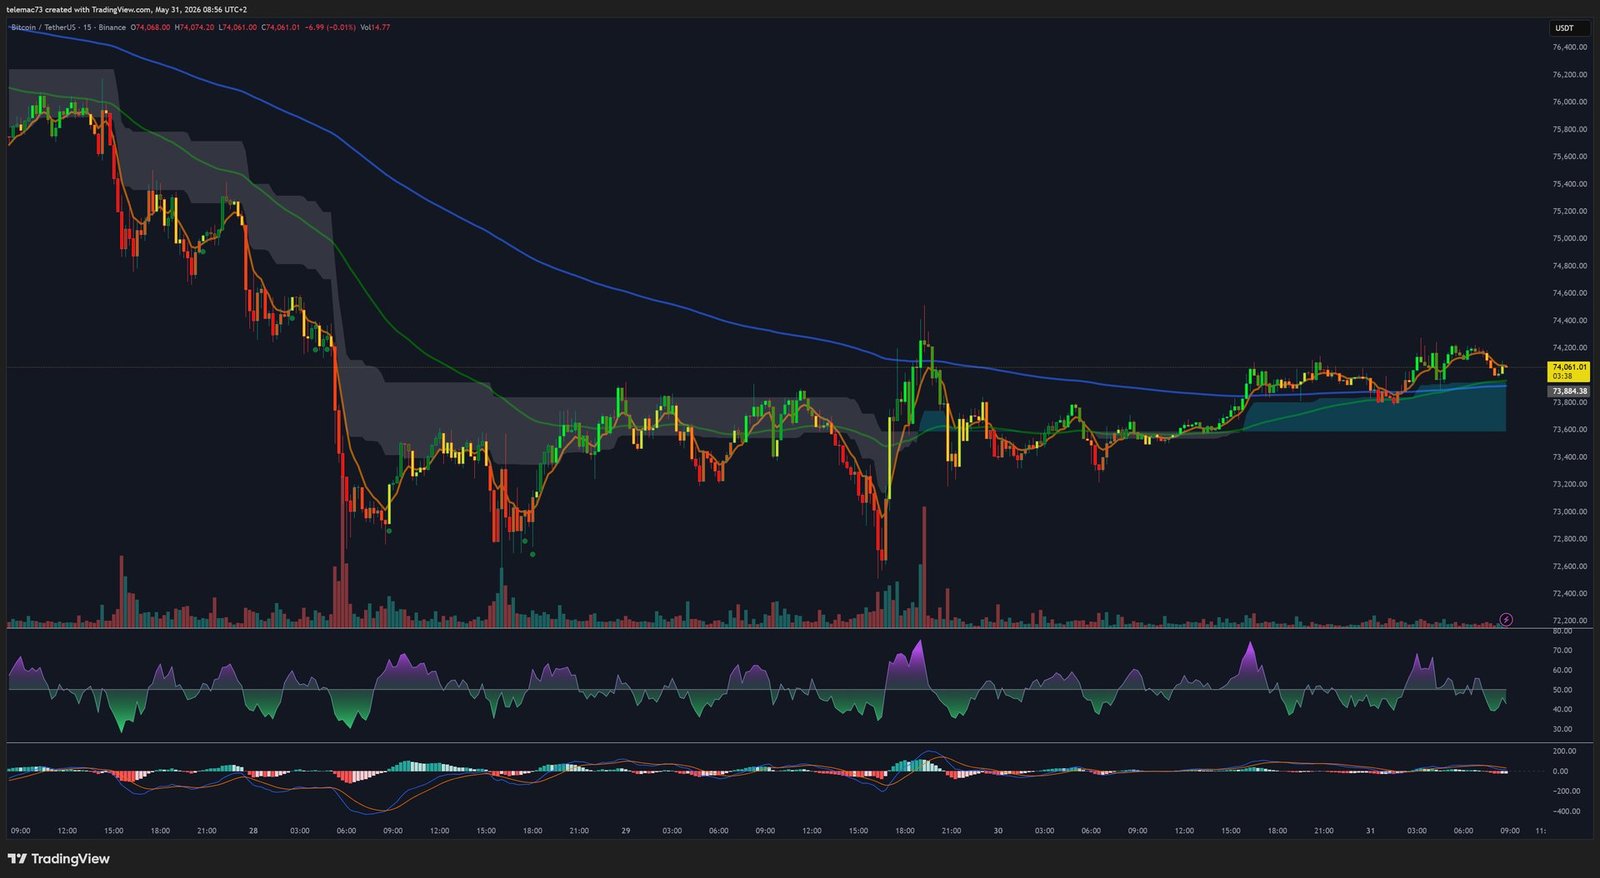
The 15-minute chart illustrates the intraday algorithmic battlefield: cascading liquidations of highly-leveraged long positions, followed by a volatility contraction phase forming symmetrical compression pennants. End-of-May options expiry represents $6.2 billion (84,112 contracts) with Max Pain at $75,000 and a Put/Call ratio of 0.84. With spot below Max Pain, market makers theoretically generate buying pressure — but low implied volatility (~20%) limits this algorithmic support’s effectiveness.
9. Cyclical Modeling: The Time-Based Capitulation
Despite the institutional narrative suggesting ETFs would break Bitcoin’s four-year cycle, empirical data shows this cycle remains remarkably intact. Analysts like Benjamin Cowen demonstrate that the current bearish phase perfectly mirrors the morphology of mid-term bear markets seen in 2014, 2018, and 2022. The most alarming technical signal: a clean rejection off the 200-day SMA, which historically seals the continuation of a bear market.
The market is not necessarily falling into a bottomless pit in one go. Rather, it enters an attrition regime — « time-based capitulation »: a choppy, frustrating, gradually declining range over many months, designed to drain liquidity from short-term speculators. The true cycle bottom may not materialize until September–October 2026.
10. Synthesis and Scenario Matrix
| Scenario | Technical Triggers | Probability & Implications |
|---|---|---|
| Bearish — Algorithmic Capitulation | Confirmed daily close below $70,000 | High. Cascading liquidations (~$2B at risk). Target: cycle bottom ~$60,000 by autumn 2026. |
| Choppy Consolidation (Range) | Hold $72,000 support but fail to reclaim 50-day EMA | Medium. Psychological attrition, $72K–$75K range, altcoins suffer severely. |
| Bullish Reversal (Invalidation) | Violent rejection + daily close above $77,000 | Low. Requires major positive macro shock (surprise Fed rate cut). |
In the current paradigm, the dominant institutional posture is capital preservation. The risk/reward ratio is heavily asymmetric to the downside. Market participants must prepare for a potential extension of the crypto winter in the near to medium term, justifying a defensive risk management approach while awaiting a full reset of macroscopic oscillators and the complete purge of excess leverage.
⚠️ Disclaimer: This article is written for educational and informational purposes only. It does not constitute investment advice or a recommendation to buy or sell any digital asset. Cryptocurrency markets are highly volatile and carry significant risk of capital loss. Please consult a qualified financial advisor before making any investment decision.

