
As of January 25, 2026, Bitcoin is experiencing a significant turbulent phase, hovering around $92,000 after rejecting the psychological threshold of $98,000 in mid-January. This correction is not mere market noise, but rather reflects a complex friction between structural institutional appetite and cyclical risk aversion triggered by geopolitical tensions and monetary uncertainty.
The Macroeconomic Context: Tariffs and FED Policy
The crypto market is currently facing two major shocks. On one hand, President Trump’s announcement of 10% tariffs on eight European nations has revived the specter of a global trade war. This unexpected geopolitical decision caused a 3.6% drop in Bitcoin, which reacted in close correlation with risk assets rather than gold, highlighting its hybrid nature as a liquidity asset sensitive to uncertainty shocks.
On the other hand, the FOMC meeting scheduled for January 27-28 keeps the market in suspense. With robust U.S. growth of 4.4% in Q4 2025 and PCE inflation at 2.7-2.8%, the Federal Reserve is expected to maintain its key rates. This absence of « easy » liquidity means Bitcoin must rely on organic flows – corporate adoption and ETFs – to support prices.
On-Chain Analysis: Investor Psychology
The NUPL indicator reveals that the market is predominantly in profit, with long-term holders (LTH) taking advantage of prices above $90,000 to materialize their gains. This « Selling into Strength » phenomenon creates excess supply that incoming demand must absorb. Bitcoin ETFs recorded $1.72 billion in net outflows over five days in mid-January, reflecting tactical risk management rather than institutional rejection of the asset.
Multi-Timeframe Technical Analysis
Long-Term Perspective (Daily)
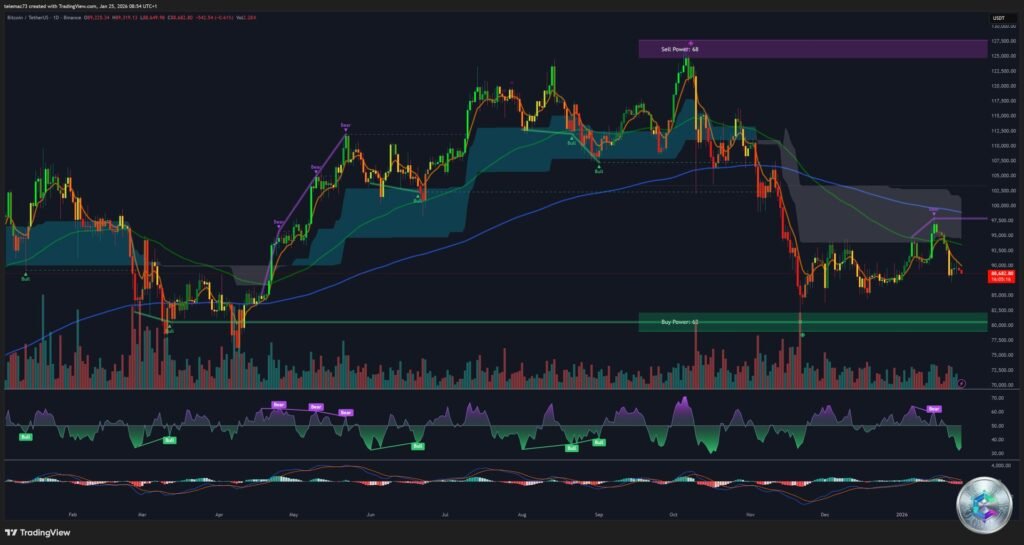
On the daily timeframe, Bitcoin is sending mixed signals. The break of the rising channel in which it had been evolving for several months signals a transition to a corrective phase. The price is currently forming a rectangular consolidation structure between $88,535 (major support) and $96,979 (resistance).
The daily RSI shows a clear bearish trend around 34-40, close to the oversold zone (30), suggesting that the potential for further downside without a technical rebound is limited. The MACD in negative territory confirms the current corrective phase.
Medium-Term Perspective (4 Hours)
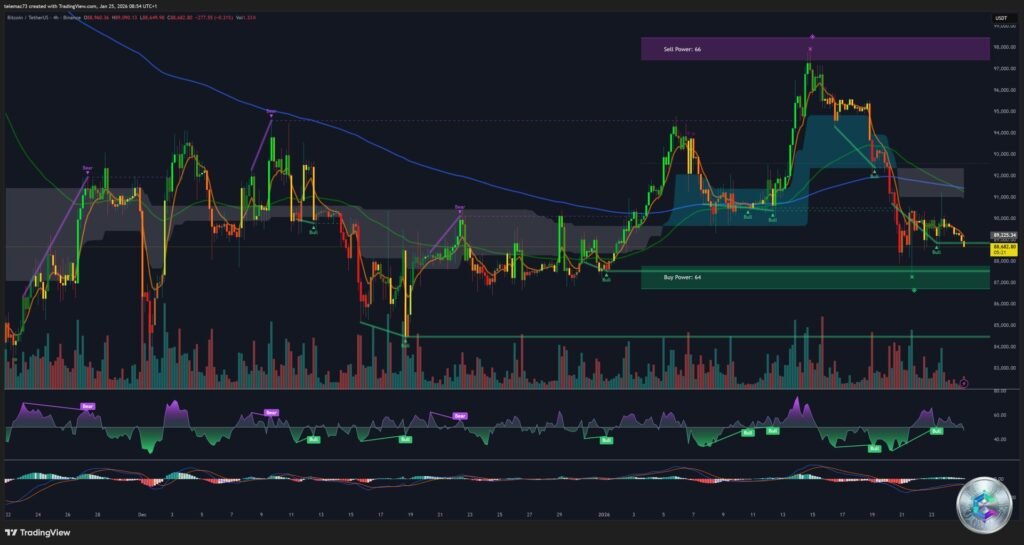
The H4 chart reveals a clear descending channel since the peak of $98,000. Each rebound attempt toward the median or upper line of this channel has been aggressively sold. Complex harmonic patterns (bearish « Bat » or « Gartley » types) have already functioned by rejecting the price in the $93,000 – $95,000 zone.
The price is trading below the 50 and 200 period EMAs on the H4, with a bearish crossover confirming the corrective trend. The $93,000 zone, where the 50 EMA passes, will act as strong dynamic resistance during the next rebound.
Short-Term Perspective (15 Minutes)
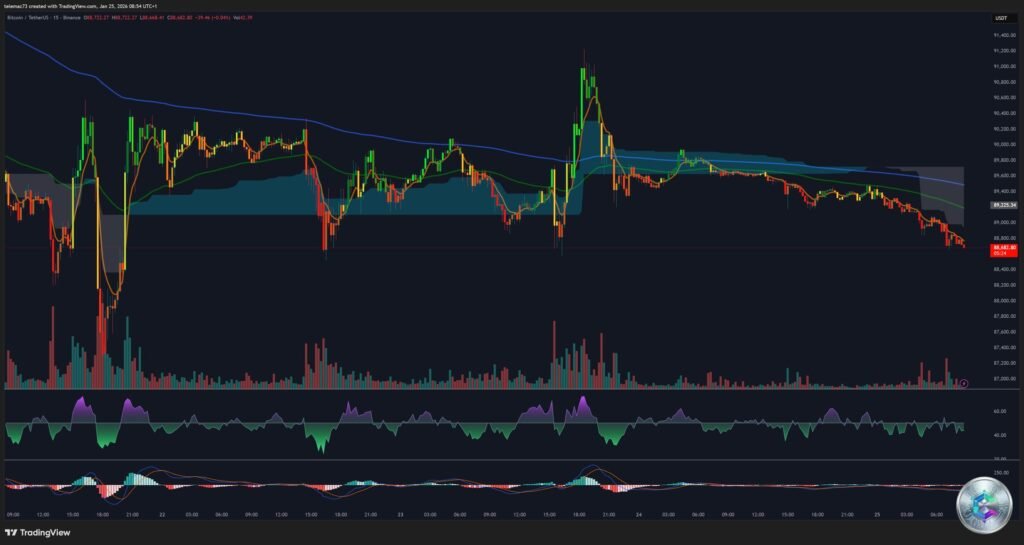
For intraday trading, the M15 chart shows a succession of descending tops and descending bottoms, characteristic of a bearish trend. However, signs of bullish divergence on the M15 RSI during recent lows could signal an imminent technical rebound toward $92,500.
Market inefficiencies (Fair Value Gaps) are visible above the current price, particularly around $92,800, which the market generally tends to fill before resuming its underlying trend.
Liquidity Analysis: The Heatmap Battle

Heatmaps reveal massive liquidity clusters that act as price magnets. A dense concentration of leveraged long position liquidations is visible below $90,000, intensifying toward $88,000 and $86,500. Market Makers have a financial incentive to push the price toward these zones to « capture » this liquidity, making a quick wick to $88,000 followed by a violent buyback probable.
On the upside, short seller liquidity begins accumulating above $93,500 and becomes very dense around $95,000 and $97,000. A confirmed break above $93,500 could trigger a « Short Squeeze » rapidly propelling the price toward the upper resistance.
Key Technical Levels
| Level | Price | Justification |
|---|---|---|
| Major Resistance | $98,000 – $98,500 | January 14 peak, extreme short liquidation cluster |
| Resistance R2 | $96,979 | Top of daily consolidation rectangle |
| Resistance R1 | $93,000 – $93,500 | 4H harmonic rejection zone, H4 EMA 50 |
| Current Price | ~$92,000 | Uncertainty zone between Pivot and Resistance R1 |
| Support S1 | $89,760 | H4 local support, first alert level |
| Support S2 (Critical) | $88,535 | Bottom of consolidation rectangle, « Must Hold » zone |
| Support S3 (Liquidity) | $86,000 – $86,500 | Major reload zone, institutional buy wall |
| Invalidation | $80,700 | Target if 86k breaks with confirmation |
Forecast Scenarios
Scenario A: Stop Hunt (45% probability)
Nervousness linked to Trump tariffs persists. Price slides below $90,000, triggering a cascade of Stop Loss orders toward $87,500 – $86,500. At this level, selling liquidity is absorbed by institutional orders, forming an important low wick. Entry signal: reclaiming $88,500 after the false breakdown. Target: return toward $93,000 then $96,000.
Scenario B: Lateral Compression (35% probability)
Major players refuse to take positions before the January 28 FOMC. Price oscillates in a tight channel between $90,500 and $93,500. Strategy: range trading, selling intraday resistances and buying supports on the 15-minute chart.
Scenario C: Capitulation (20% probability)
A major verbal escalation or aggressive FED speech triggers widespread panic. The $86,000 support is broken with strong selling volume, opening the way toward $80,700 or even $74,000. Critical risk management: firm Stop Loss below $84,000 (4H close).
Conclusion
Bitcoin stands at a decisive inflection point. The $86,000 – $88,000 zone represents the critical defense line for buyers. As long as this zone holds, the current correction should be considered a buying opportunity within a bullish cycle targeting $150,000 by late 2026. However, losing this level would fundamentally change market psychology.
In this volatile environment, patience and discipline are essential. Staggered buy orders in the identified liquidity zone (86k-88k) seem judicious, while closely monitoring FED announcements on January 27-28 which could be the catalyst for the next major move.
⚠️ Disclaimer: This article is published for educational and informational purposes only. It does not constitute financial investment advice in any way. Crypto-asset markets are extremely volatile and carry substantial risks of capital loss. Always conduct your own research (DYOR) and consult a professional financial advisor before making any investment decision.