
The digital asset market is undergoing an unprecedented structural redefinition on this February 17, 2026. After briefly touching $126,000 in October 2025, Bitcoin (BTC) has suffered a major correction of approximately 50%, bringing its price to a critical pivot zone between $68,000 and $69,000. This comprehensive analysis combines three technical timeframes (15-minute, 4-hour, and daily), a liquidity mapping via heatmap, and a synthesis of the macroeconomic and geopolitical catalysts shaping investor psychology today.
🌐 Global Macroeconomic Context
The dominant theme of Q1 2026 is undeniably the « Warsh Shock ». The appointment of Kevin Warsh as Federal Reserve Chair has radically shifted market expectations: perceived as less accommodative than his predecessors, Warsh has established a climate of caution where liquidity is no longer guaranteed by a systematic Fed Put. This shift toward tighter monetary policy comes as U.S. CPI inflation settled at 2.4% in January — a figure too low to justify an immediate rate cut, but not low enough to ignite risk-on sentiment.
| Macroeconomic Indicator | Value (Feb. 2026) | Impact on Bitcoin |
|---|---|---|
| U.S. CPI Inflation (Annual) | 2.4% | Neutral to Positive |
| Federal Reserve Rate | 3.50% – 3.75% | Negative (high opportunity cost) |
| 10-Year Treasury Yield | 4.03% | Stabilizing |
| Dollar Index (DXY) | 96.92 | Favorable (weakening dollar) |
| U.S. National Debt | ~$39 Trillion | Long-term Bullish (fiat devaluation) |
Bitcoin increasingly behaves as a high-beta asset tied to tech liquidity cycles rather than as a disconnected « store of value. » While gold gained 10% year-to-date, Bitcoin declined nearly 24%, temporarily invalidating the « digital gold » narrative in favor of a role as a global risk-appetite barometer.
🕊️ Geopolitical Dynamics: The Geneva Negotiations
A major external catalyst this week is the second round of indirect nuclear talks between the U.S. and Iran in Geneva, mediated by Oman. Markets are closely watching oil prices (Brent at $68.59) as a geopolitical risk gauge. A diplomatic breakthrough — including a partial sanctions lift in exchange for uranium enrichment dilution — could trigger a relief rally in risk assets, with Bitcoin leading the charge. Conversely, a breakdown would intensify energy-driven inflationary pressures, weighing on tech-adjacent valuations.
📊 Multi-Timeframe Technical Analysis
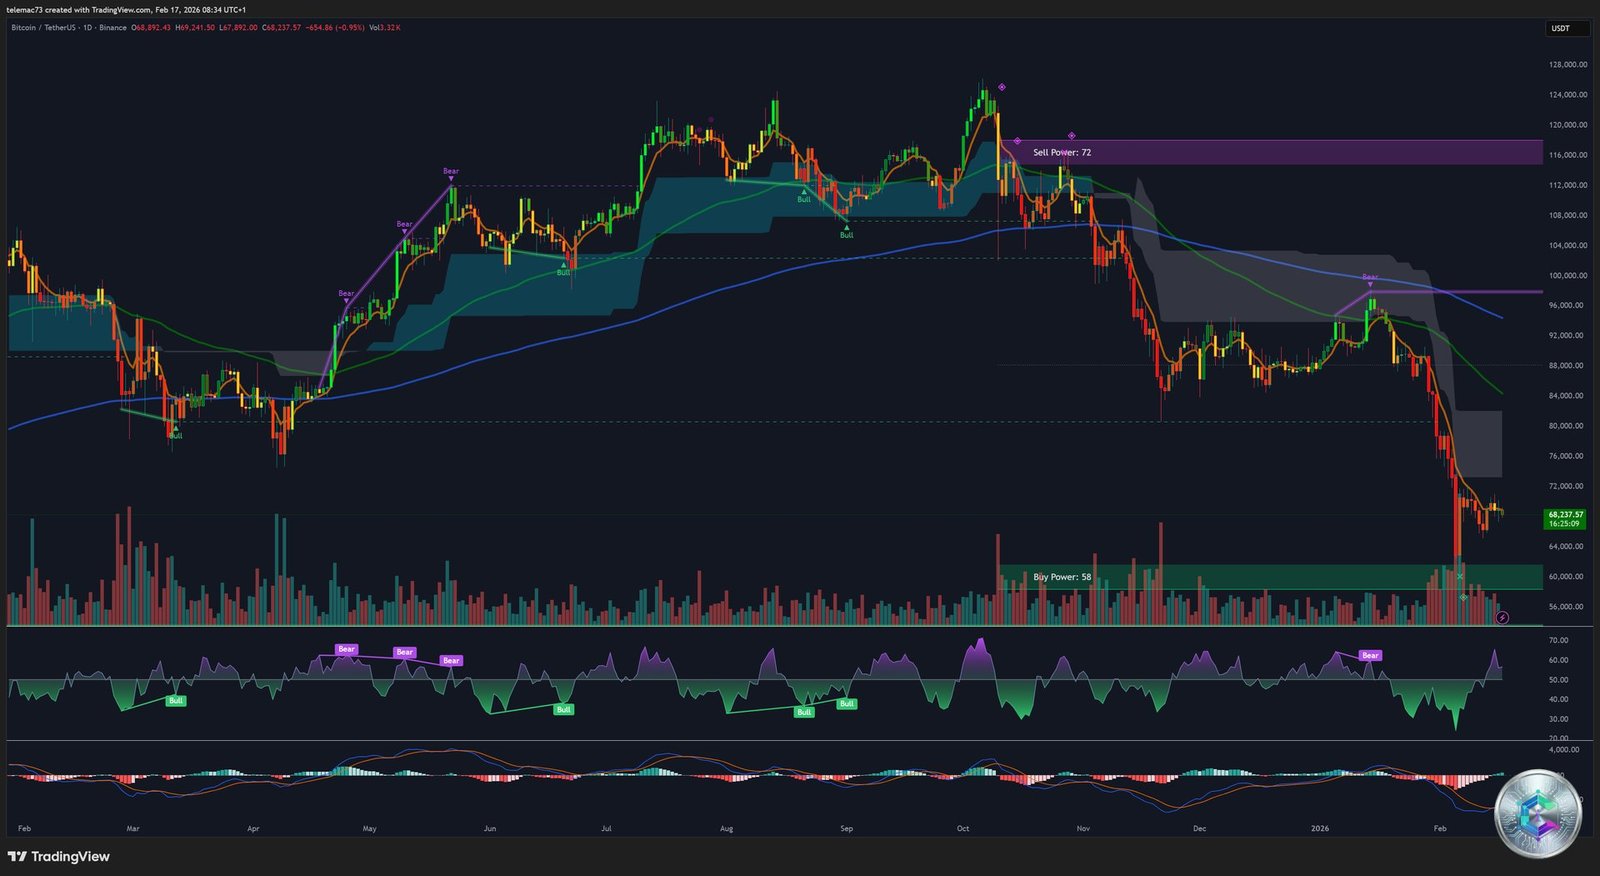
📅 Daily Chart (1D): Descending Channel & Moving Averages
On the daily timeframe, Bitcoin remains locked in a multi-month descending channel. The breakdown below $75,000 earlier this year accelerated deleveraging toward the critical demand zone at $60,000.
- Long-Term Pivot Resistance: The 200-day EMA sits between $95,700 and $101,300. While price remains below this level, the market is technically in a bearish or major corrective cycle.
- Immediate Resistance: The 20-day EMA around $73,200 acts as a dynamic ceiling capping every attempted rally since early February.
- Momentum Signals: The daily RSI is recovering from extreme lows (15–28) toward 36, signaling seller exhaustion. A positive divergence on the Stochastic RSI suggests a mean reversion toward $72,000 is statistically likely.
⏱️ 4-Hour Chart (4H): Bear Flag & Consolidation Zone
The 4-hour chart shows a coiling phase following the February 5th flash crash. The structure resembles a Bearish Pennant, with the flagpole formed by the $88,800 → $60,000 drop. The $68,800 level serves as the short-term pivot. A sustained close above this level could target the descending trendline at $71,300. However, declining volume signals weak buyer conviction at current levels.

⚡ 15-Minute Chart (15m): Intraday Microstructure
At the intraday level, volatility is compressed due to U.S. holiday closures (Presidents’ Day) and Asian market shutdowns for Lunar New Year. The 15-minute chart shows a series of lower highs since the weekend’s $70,000 test, indicating persistent weakness.
| Intraday Level | Price (USD) | Action |
|---|---|---|
| Local Resistance | $69,500 – $69,800 | Profit-taking zone for scalps |
| Immediate Pivot | $68,826 | Watch volume reaction |
| Local Support | $67,800 – $68,000 | Short-term bounce buy zone |
| Breakdown Zone | < $67,200 | Invalidation of intraday bullish thesis |

🔥 Liquidity Mapping (Heatmap Analysis)
The liquidation heatmap is the most powerful tool for understanding the invisible forces pulling price. Bitcoin currently sits in a « liquidation sandwich ».
📈 Upside Magnet: Potential Short Squeeze
A massive concentration of ask liquidity and short liquidation levels sits between $70,000 and $72,000. Estimates suggest over $5.45 billion in short positions could be forcibly liquidated if price breaks above $70,000 with meaningful volume, triggering a violent short squeeze cascade.
📉 Liquidity Void Below: Long Flush Risk
Below current price, a relative liquidity void extends from $66,000 to $60,500. Should $67,000 support fail, price could cascade rapidly to the next major cluster at $60,500, where approximately $350 million in long positions remain. Binance’s heatmap identifies $66,100 as the critical survival threshold for highly-leveraged traders.

🏛️ Institutional Analysis & ETF Flows
Institutional behavior through the 11 U.S.-approved Bitcoin ETFs remains the primary driver of spot demand. The narrative has evolved from aggressive accumulation to a phase of « disciplined rebalancing. »
| ETF Issuer | Weekly Flow | Strategic Notes |
|---|---|---|
| BlackRock (IBIT) | – $235M | Dominant despite outflows; benchmark indicator |
| Fidelity (FBTC) | – $125M | Capital withdrawal on macro caution |
| Grayscale Mini (BTC) | + $110M | Migration to lower-cost structures |
| Total Net (Week) | – $360M | Institutional « Wait and See » signal |
Despite weekly outflows, BlackRock’s IBIT attracted $60 million in inflows on February 13th alone, confirming that « strong hands » are using sub-$65,000 dips to accumulate. Institutional holders now represent an estimated 6.33% of total Bitcoin market cap — underscoring their pivotal role in price stability.
⛏️ Network Fundamentals & Miner Capitulation
A critical indicator of Bitcoin’s « physical floor » is its production cost. In February 2026, the mining industry is in the midst of an intense purge phase:
- Average Production Cost: Estimated at $87,000 per BTC — approximately 28% above current market price.
- Difficulty Adjustment: Mining difficulty dropped 11.16% in the latest cycle, reflecting the mass shutdown of inefficient machines (standard S19 series no longer profitable below $75,000).
- Miner Capitulation: Miners are liquidating reserves to cover energy costs and service debt. While painful in the short term, this cleanses the network, leaving only the most financially efficient operators. Historically, this signal precedes bear market bottoms.
🧠 Market Sentiment & Investor Psychology
The Fear & Greed Index currently oscillates between 7 and 14 — « Extreme Fear » levels not seen since the Terra Luna collapse in 2022. This psychological backdrop reveals three distinct behavioral layers:
- Retail Sentiment: Forums and social media reflect 85% pessimism, dominated by fears of a return to $40,000. This level of public exhaustion has historically preceded trend reversals.
- Whale Accumulation: Wallets holding between 10 and 10,000 BTC accumulated approximately 18,000 BTC over four days. This silent « Smart Money » accumulation while retail sells at a loss suggests structural bottom formation.
- Supply Profitability: Only 55% of circulating supply is currently in profit. When nearly half of all holders are underwater, the urgency to sell diminishes, replaced by forced HODLing behavior.
🗺️ Key Support & Resistance Levels
| Level | Price (USD) | Strategic Significance |
|---|---|---|
| Resistance R3 | $84,117 | 50-day EMA; medium-term bias shift |
| Resistance R2 | $76,350 | Fibonacci 1.0 level; structural recovery confirmation |
| Resistance R1 | $71,700 – $72,500 | Short liquidation cluster; squeeze trigger |
| Daily Pivot | $68,826 | Current consolidation equilibrium |
| Support S1 | $65,700 – $66,200 | Bearish pennant low; first line of defense |
| Support S2 | $60,033 – $60,500 | Cycle low; 200-week MA cluster |
| Support S3 | $55,000 – $57,800 | Network realized price; bear market floor |
🔭 Scenarios & Forward Outlook
🟢 Bullish Scenario – The Spring Squeeze (Probability: 35%)
If the Geneva talks succeed and Fed minutes signal openness to June rate cuts, Bitcoin could break the $72,000 resistance. This would trigger a cascade of short liquidations, propelling price toward $81,000, then $85,000 by end of March.
🟡 Consolidation Scenario – The Long Base (Probability: 45%)
The most probable outcome is continued range-trading between $60,000 and $73,000. This absorption phase allows digestion of institutional losses and completion of inefficient miner capitulation. Thin holiday liquidity and the Fed’s pause favor a directionless consolidation.
🔴 Bearish Scenario – Final Capitulation (Probability: 20%)
A U.S.-Iran military escalation or renewed inflation surge could force a final deleveraging. A break below $60,000 would open the path to the realized price at $55,000, or even the cycle floor at $38,000 – $45,000 in a Black Swan scenario.
✅ Conclusions & Strategic Recommendations
The global analysis as of February 17, 2026 suggests that Bitcoin has likely established a local bottom around $60,000, supported by strong on-chain fundamentals and a production cost acting as a physical floor. However, the absence of an immediate catalyst and the Fed’s cautious stance limit near-term upside potential.
For professional investors, the recommended strategy rests on three pillars:
- Progressive Accumulation in the $60,000 – $65,000 zone, identified as a high-value area for long-term positioning.
- Leverage Caution until the $72,500 pivot is reclaimed with volume, to avoid stop hunts in this low-liquidity regime.
- Monitoring Traditional Safe Havens (Gold/Silver): the divergence with Bitcoin is at a peak, signaling an imbalance that must eventually resolve through capital rotation back into the digital sector.
In conclusion, Bitcoin is maturing — transitioning from emotional to structural volatility driven by global capital flows. This coming-of-age process is painful for short-term speculators, but lays the groundwork for a healthier growth trajectory in the 2026–2027 cycle.
⚠️ Disclaimer: This article is written for educational and informational purposes only. It does not constitute investment advice, nor a recommendation to buy or sell digital assets or any other financial instrument. Cryptocurrency markets are extremely volatile and carry a risk of total capital loss. Always conduct your own research (DYOR) and consult a licensed financial advisor before making any investment decision.