
The digital asset ecosystem is navigating, in March 2026, a period of historic turbulence and deep structural redefinition. Bitcoin (BTC), the undisputed barometer of global liquidity, stands at the confluence of major macroeconomic shocks, geopolitical tensions unseen in decades, and a fundamental restructuring of its institutional flows. After reaching a staggering all-time high of $126,073 in October 2025, the asset has entered a prolonged correction phase, oscillating in an unstable range between $60,000 and $74,000 in early March 2026. This in-depth analysis decrypts the underlying forces shaping Bitcoin’s price action.
⚙️ 1. Macroeconomic & Geopolitical Landscape: A Trial by Fire
🔥 1.1 Middle East Escalation and the Energy Shock
Since late February 2026, the direct military escalation involving the United States, Israel, and Iran has sent an asymmetric shockwave across global financial markets. Coordinated airstrikes and Iranian retaliations targeting energy infrastructure have caused major maritime disruptions. The blockade and persistent threats to the Strait of Hormuz — a strategic chokepoint through which approximately 20% of global oil and LNG supply transits — have fundamentally redrawn the global risk map.
This logistical stranglehold pushed energy prices to critical levels. The international Brent crude benchmark surged more than 25% within weeks, breaching the psychologically and economically punishing threshold of $91 per barrel. Institutional capital retreated massively into traditional safe-haven assets: the US dollar (the DXY index posted a +1.07% single-session surge) and physical gold, which broke through the historic $5,400 per ounce barrier.
Bitcoin, by contrast, behaved like a classic high-beta risk asset, with correlation to the S&P 500 and NASDAQ climbing to 0.78 during peak volatility. During the initial strikes, BTC suffered a violent cascading liquidation, crashing to the $63,000 zone. The subsequent bounce toward $71,000 appears to be primarily short covering rather than genuine safe-haven capital reallocation.
📉 1.2 Stagflation Threat: Catastrophic NFP and a Paralyzed Fed
The external energy shock compounds severe internal deterioration in US economic fundamentals, creating a stagflationary environment. The highly anticipated Non-Farm Payrolls (NFP) report published on March 6, 2026 acted as an additional bearish catalyst. While economists expected 59,000–60,000 new jobs, the US economy instead destroyed 92,000 jobs in February, pushing the unemployment rate to 4.4%.
This brutal contraction, combined with wage inflation structurally above 4%, places the Federal Reserve in a historic monetary impasse. Bond markets, via the CME FedWatch tool, now price in a 98% probability of rates remaining unchanged at the mid-March FOMC meeting. For Bitcoin, the « Higher for Longer » paradigm represents a powerful headwind: attractive risk-free yields on Treasuries dramatically increase the opportunity cost of holding volatile, yield-free assets.
🏦 2. Institutional Microstructure and ETF Flows
📊 2.1 ETF Flow Bipolarity: From Frenzied Euphoria to Abrupt Distribution
Bitcoin Spot ETFs — approved by the SEC in January 2024 — now hold a combined AUM approaching $130 billion, representing 6–8% of total Bitcoin supply in circulation. They have become the market’s dominant marginal price-setter, amplifying volatility in both directions.
After five consecutive weeks of net outflows (~$4 billion), early March saw a spectacular reversal: between March 2–4, US Spot ETFs absorbed approximately $1.145 billion in net inflows, acting as the primary driver of the recovery above $70,000. BlackRock’s IBIT dominated, capturing $322.4M on March 3 and $306.6M on March 4 — approximately 66% of total market inflows.
However, on March 6, in the wake of the catastrophic NFP data and Middle East escalation, ETFs recorded their worst single-day outflows in three weeks, losing $349 million in a single session. On-chain data confirms the distribution: « whale » entities (10–10,000 BTC) used the spike toward $74,000 to offload approximately 66% of the positions they accumulated near $62,000 in late February.
🔄 2.2 Death of Cash-and-Carry and the Rise of Directional Flows
A critical second-order observation involves the disappearance of the « Cash-and-Carry » arbitrage strategy — buying Spot ETF shares while simultaneously shorting CME futures to capture the basis premium. The basis has compressed to a level where financing costs, elevated by the Fed, have rendered the trade unprofitable. Consequently, the ~$1.1B in inflows observed early March were purely directional, uncovered long bets — fundamentally increasing the market’s sensitivity to macroeconomic shocks and explaining the intensity of recent intraday swings.
🏢 2.3 Corporate Accumulation: The MicroStrategy Effect
In stark contrast to ETF volatility, MicroStrategy (MSTR) maintains a relentless, cycle-agnostic accumulation strategy. The firm disclosed investing $4.3 billion to acquire approximately 48,000 BTC in the first two months of 2026 alone — surpassing its entire 2022 acquisition volume. Even during the Iranian conflict, the company added an additional 3,015 BTC ($204M) at an average price of $67,700.
On March 4 alone, approximately 31,900 BTC ($3 billion) were withdrawn from exchanges into cold storage. This structural removal of floating supply mechanically amplifies price sensitivity to any demand increase.
⚖️ 2.4 Regulatory Landscape: CLARITY Act Stalled, Swiss FINMA Advances
The « Digital Asset Market CLARITY Act » (H.R. 3633), passed by the House in July 2025, remains paralyzed in the Senate. The March 1, 2026 White House deadline expired without a compromise. This legal uncertainty blocks capital allocation from the most conservative pension funds. President Trump publicly intervened, accusing the banking lobby of obstructing the bill.
Meanwhile, Switzerland’s FINMA published Directive 2026/1, strictly regulating crypto custody risks — aligned with EU MiCA standards — creating a stark contrast with American regulatory uncertainty and solidifying Europe’s institutional crypto infrastructure.
📈 3. Multi-Timeframe Technical Analysis
📅 3.1 Daily Chart (1D): The Shadow of the Death Cross
Bitcoin’s macro structure is unambiguously bearish since the October 2025 cycle peak of $126,073. Five consecutive months of red candles, with a series of lower highs and lower lows — the academic definition of an asymmetric bear market.
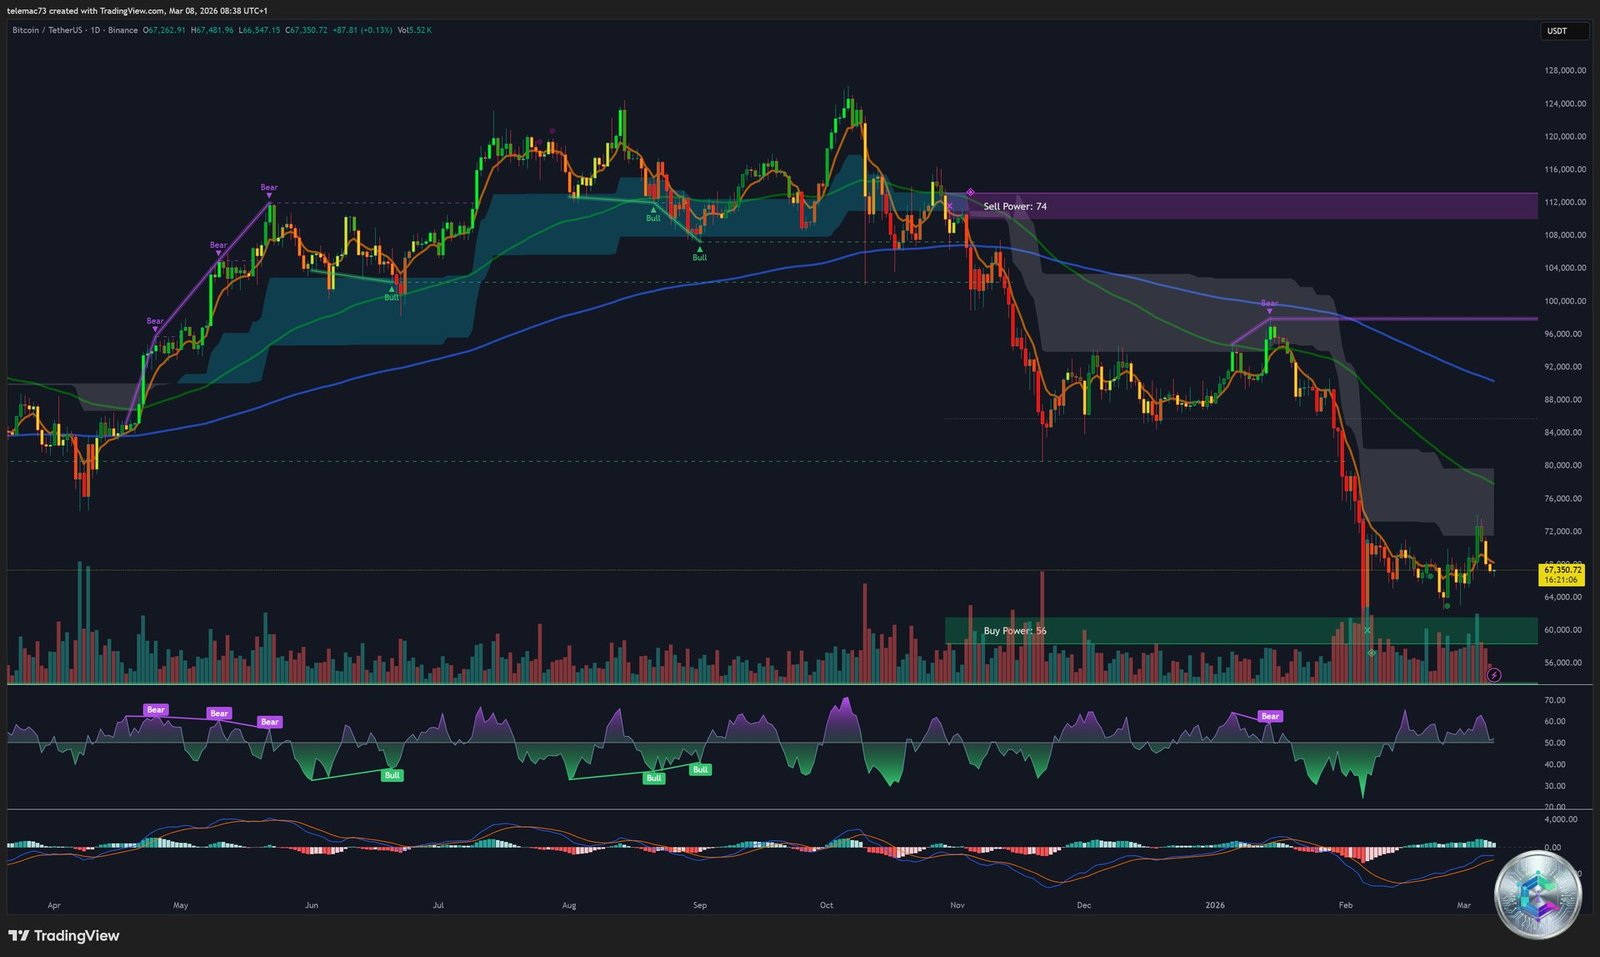
Bear Flag Formation: The daily chart reveals a large-scale bear flag — a slightly ascending consolidation channel following an initial 39% drop from the ATH (the flagpole). The upper resistance boundary sits firmly at $72,000–$74,000; the lower dynamic support at $62,300. A decisive daily close below this level projects the price mathematically toward $42,000–$45,000.
Death Cross Confirmed: The 50-day SMA has crossed below the 200-day SMA — a major signal with strong historical reliability:
- 2014: An additional 52% decline followed this signal
- 2018: A subsequent 50% drop
- 2022: An additional 46% collapse after the signal
Oscillators: The RSI (14-period) reads 32.57, near oversold territory. A hidden bearish divergence was identified between early and late February (price forming lower highs while RSI formed higher highs — a fake bounce). The MACD is deeply anchored below zero at -430.9, with no Golden Cross in sight. The ADX at 59.96 confirms an exceptionally strong bearish trend, dismissing the hypothesis of a benign sideways range.
⏱️ 3.2 4-Hour Chart (4H): Battle Within Compression Triangles
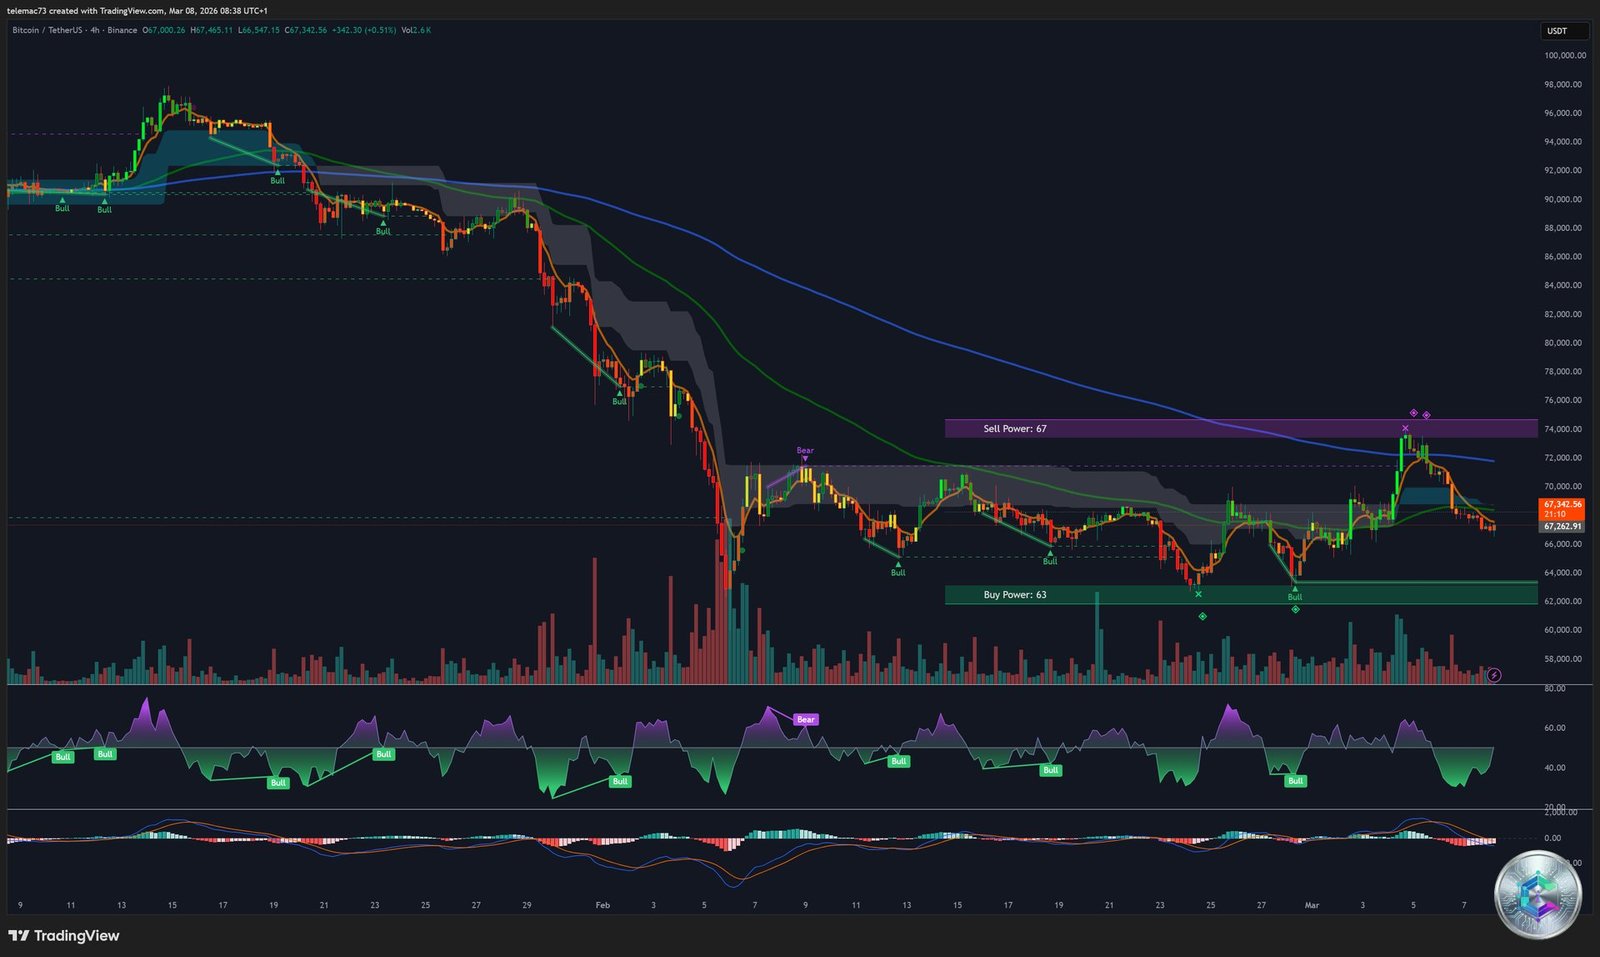
On the 4H timeframe, price attempts a recovery through compression structures (symmetrical triangles, bull pennants). The critical battle rages around the 50-EMA (~$68,400) — briefly crossed to the upside before failing against the 200-EMA acting as an impenetrable ceiling. Attempts above $70,000 were rejected with long upper wicks (rejection wicks), the visual signature of a massive supply wall.
The 4H MACD briefly produced a Golden Cross during the early March ETF-driven rally, but the histogram quickly flattened, confirming the move was a technical short squeeze, not a genuine trend reversal. The current presence of inside bar candles signals extreme volatility compression — typically a precursor to an explosive directional breakout.
⚡ 3.3 15-Minute Chart (15m): The Algorithmic Battlefield
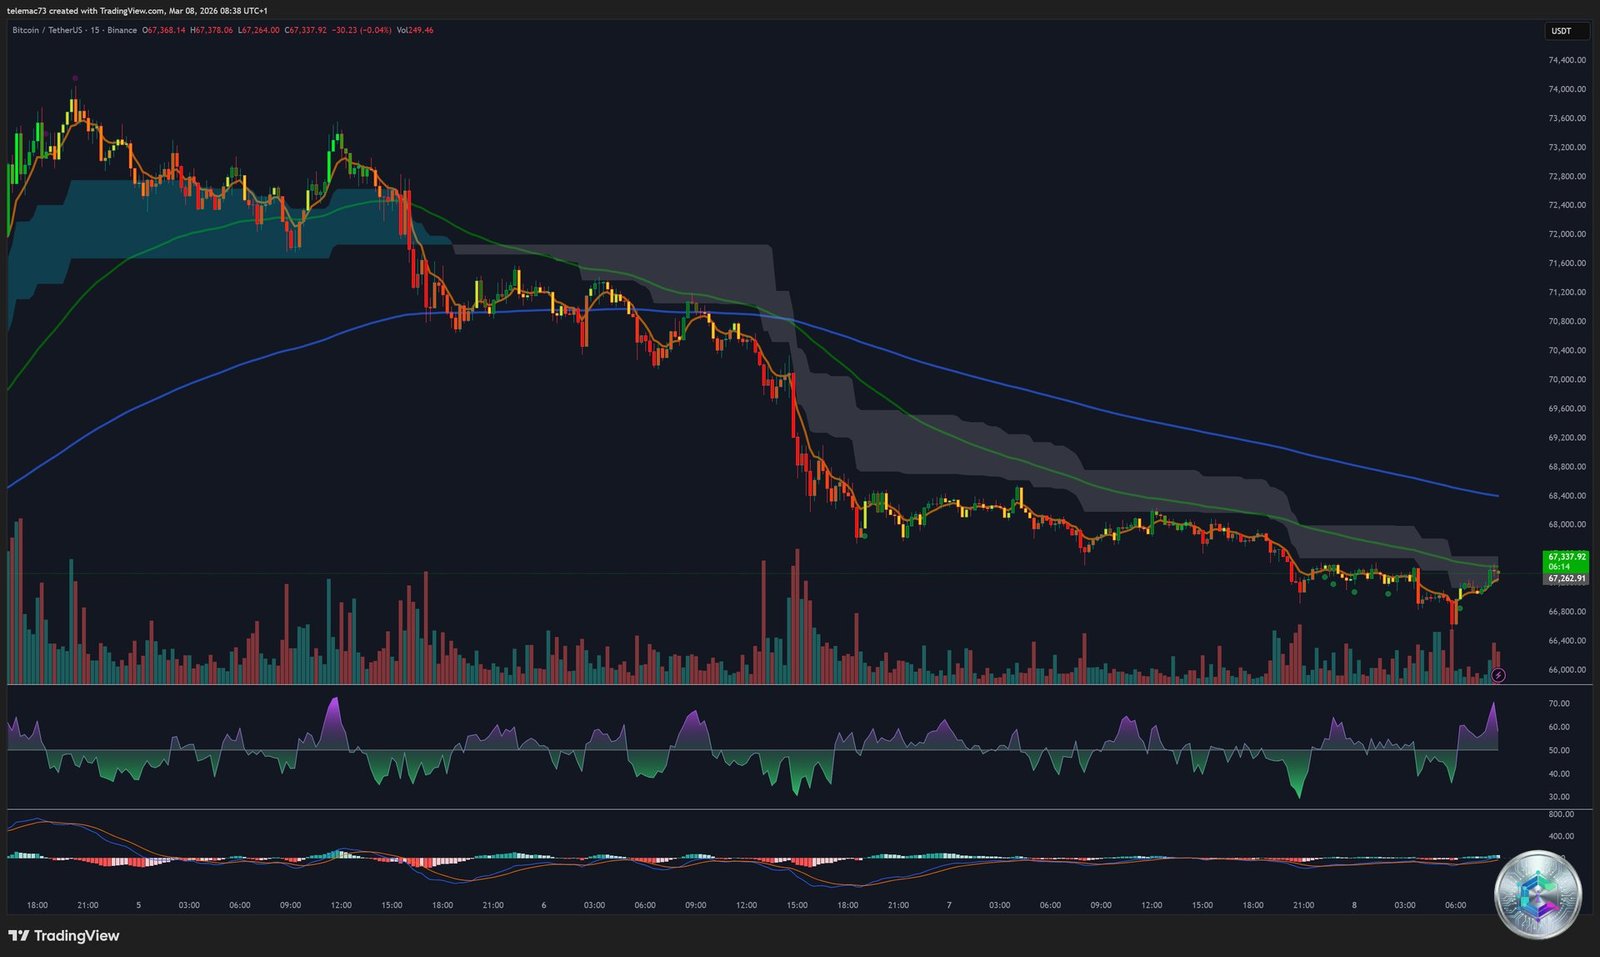
The 15-minute chart exposes the raw mechanics of the market, dominated by HFT algorithms and liquidity hunting. The recurring « Liquidity Sweep » phenomenon is clearly visible: sudden vertical spikes above $71,000 trigger short stops and trap breakout traders — once the liquidity is absorbed, the market reverses almost instantly. The VWAP shows price spending the majority of US session time below its volume-weighted average — sellers consistently dominate intraday order flow, using each spike to distribute positions at better prices.
🗺️ 4. Liquidation Heatmap: Mapping the Leverage Landscape
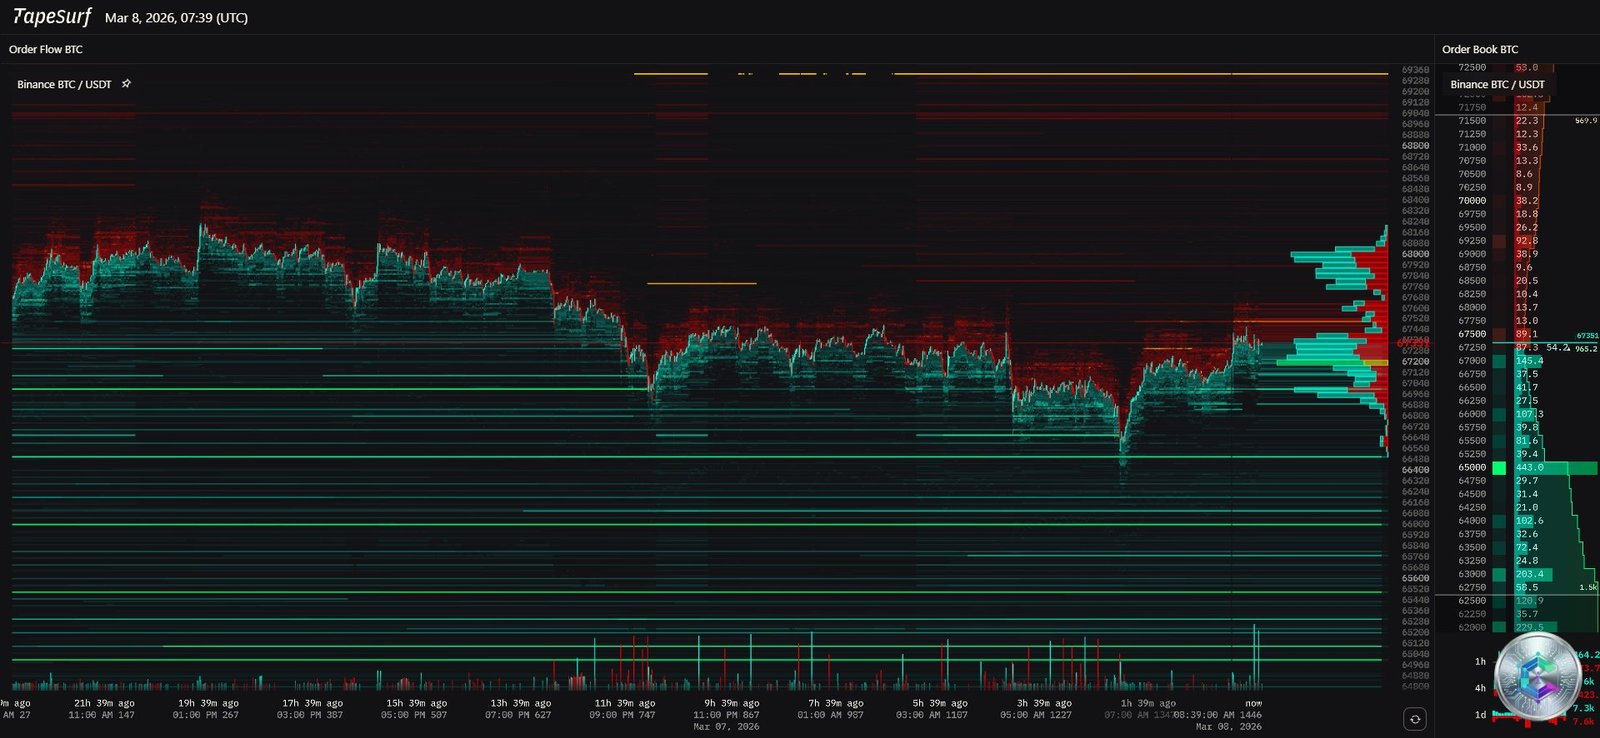
🔴 4.1 The Upper Fortress: $71,800 – $74,400 Short Squeeze Zone
The heatmap reveals an exceptional concentration of short liquidations clustered between $71,800 and $72,000 — glowing red/yellow on the heat chart. These are highly leveraged (50x–100x) short positions betting against Bitcoin’s ability to break its bear flag structure. Further above, the zone spanning $73,750 to $74,400 constitutes the most heavily defended resistance corridor in recent crypto history, having reversed the trend multiple times since early 2024. A breach of $71,800 would trigger a mechanical short squeeze feedback loop propelling price toward $80,000–$85,000.
🟢 4.2 The Downside Abyss: $54,000 and the Long Squeeze Threat
Below current prices, the $60,000 level represents the ultimate bull cycle demarcation line. A confirmed daily close below this level would trigger a cascading long squeeze. Analyst Ali Martinez highlights the $54,000 zone as a critical liquidation magnet, where over $70 million in leveraged long positions face immediate liquidation risk. A breach would accelerate price decline toward the mathematical bear flag target of $42,000–$45,000, marking entry into a deep crypto winter.
🎯 5. Strategic Key Levels — March 2026
| Zone | Price (USD) | Strategic Significance |
|---|---|---|
| 🟢 Ultimate Resistance (Breakout) | $79,000 – $80,700 | Full bear cycle invalidation. Return to euphoria phase. |
| 🔴 Major Resistance (Supply Wall) | $73,750 – $74,400 | Historical ceiling, multiple rejections. Requires massive ETF volume. |
| 🟡 Short-Term Pivot (Resistance) | $71,800 – $72,000 | Short liquidation epicenter. Dynamic 200-day EMA resistance. |
| ⚪ Current Price Zone | $67,000 – $68,000 | « No man’s land » — indecisive battle between macro risk-off and speculation. |
| 🟡 Initial Support (4H) | $65,000 – $65,500 | 4H close below this level reignites short-term bearish trend. |
| 🔴 Critical Support (Bear Flag) | $62,300 | Structural base. Bull thesis survival depends on holding this level. |
| 🔴 Macro Floor | $60,000 | Major psychological support. Loss targets $54K liquidation zone. |
| 🔥 Liquidation Magnet | $54,000 | $70M+ vulnerable longs. Downside siphon if $60K fails. |
| 💀 Ultimate Bear Target | $42,000 – $45,000 | Mathematical bear flag projection if $60K collapses. |
🧠 6. Market Psychology, Altcoins & Strategic Conclusion
The Crypto Fear & Greed Index is frozen at 12/100 — extreme fear. Bitcoin dominance has surged to 58.6%, reflecting a massive flight of capital from altcoins toward the relative safety of BTC. Nearly 38% of altcoins are trading at all-time lows, suffering corrections more devastating than those seen after the FTX collapse, confirming the total absence of liquidity for speculative second-tier assets.
Bitcoin’s fundamental structure has nevertheless undergone a positive mutation. Integration through spot ETFs and the unwavering balance sheet strategies of entities like MicroStrategy give the market an unprecedented shock-absorption depth. Unlike the endogenous collapses of 2022 (Terra/Luna, Celsius), the current weakness is purely driven by exogenous factors: Middle East oil geopolitics, the spectre of US stagflation, and the Fed’s forced intransigence.
Technically, Bitcoin is caught in a vice of rare severity between:
- To the upside: a massive short concentration at $71,800 (potential short squeeze rocket fuel)
- To the downside: a liquidity abyss below $60,000 (downside siphon toward $42,000–$45,000)
In this environment, risk/reward asymmetry dictates absolute capital preservation as the primary mandate. Validation of a new bull cycle is strictly conditional on a confirmed daily and weekly close above $74,400, supported by uncontestable institutional volume. As long as this glass ceiling remains intact, the downside resolution of the bear flag continuation pattern remains the reference scenario favored by quantitative pricing models.
The coming weeks will be defined by three binary catalysts:
① The trajectory of the CLARITY Act in the US Senate
② CPI/PCE inflation data on March 11–13, 2026
③ The outcome of military tensions in the Strait of Hormuz
⚠️ Disclaimer
This article is written for educational and informational purposes only. It does not constitute financial advice, investment advice, or any recommendation to buy or sell any financial asset or cryptocurrency. Cryptocurrency markets are extremely volatile and carry a high risk of capital loss. Always conduct your own research (DYOR — Do Your Own Research) and consult a licensed financial advisor before making any investment decision.