
The first week of June 2026 will be etched into the annals of cryptocurrency markets. Bitcoin (BTC) endured a correction of rare brutality, plunging below the psychological threshold of $60,000 to a capitulation low of $59,100, before staging a technical rebound toward $62,100. This decline of over 15% in a single week represents the worst weekly performance of the asset since July 2024. Understanding this market dynamic requires a holistic approach integrating macroeconomics, institutional capital flows, order book microstructure, and multi-timeframe chart analysis.
🌍 Macroeconomic Environment: The Catalyst of the Shock
The primary trigger for this correction originated in traditional financial markets. The publication of the May Non-Farm Payrolls (NFP) report acted as a seismic shockwave: 172,000 jobs created, demolishing the market consensus of 89,000 and surging well above April’s 115,000. This unexpected resilience in the US labor market immediately repriced expectations for Federal Reserve rate cuts.
Mechanically, US Treasury yields surged, the dollar strengthened, and the opportunity cost of holding non-yielding assets like Bitcoin skyrocketed. The Nasdaq 100 fell 3.3% (its worst day since April 2025), dragged down by Nvidia and TSMC (-5%). The S&P 500 shed 2.6%. Cross-asset correlation fired on all cylinders.
Compounding the quantitative shock was an elevated geopolitical risk premium, fueled by persistent US-Iran tensions that kept investors in maximum risk-aversion mode.
🏦 Institutional Rotation: AI Is Draining Crypto Liquidity
Bitcoin is down approximately 21% year-to-date, in stark contrast to the Nasdaq-100’s performance. This decoupling is driven by a massive sector rotation toward artificial intelligence. Anthropic’s IPO (~$965B valuation), Alphabet’s AI infrastructure plan ($80B), and SpaceX’s Nasdaq roadshow ($1.765 trillion target) are exerting an irresistible gravitational pull on available capital.
The direct consequence has been an unprecedented hemorrhage from US spot Bitcoin ETFs: over $4.21 billion withdrawn over three weeks, including $3.4 billion in a single recent week — erasing the primary buying force that had propelled BTC toward $80,000 earlier in the year.
The psychological impact was amplified by Strategy (MicroStrategy) selling 32 BTC — mathematically insignificant in volume, but symbolically devastating: the entity’s first sale since 2022 cracked the institutional « diamond hands » narrative.
📊 Multi-Timeframe Chart Analysis
Daily Chart: Macro Structure and Secular Support
The daily timeframe paints an unforgiving picture. From its highs above $70,000, Bitcoin entered a classic Bear Flag distribution pattern — an initial bearish pole followed by a slightly ascending consolidation channel. The resolution was emphatically downward, triggering a selling cascade with a measured move target in the $62,000 zone.
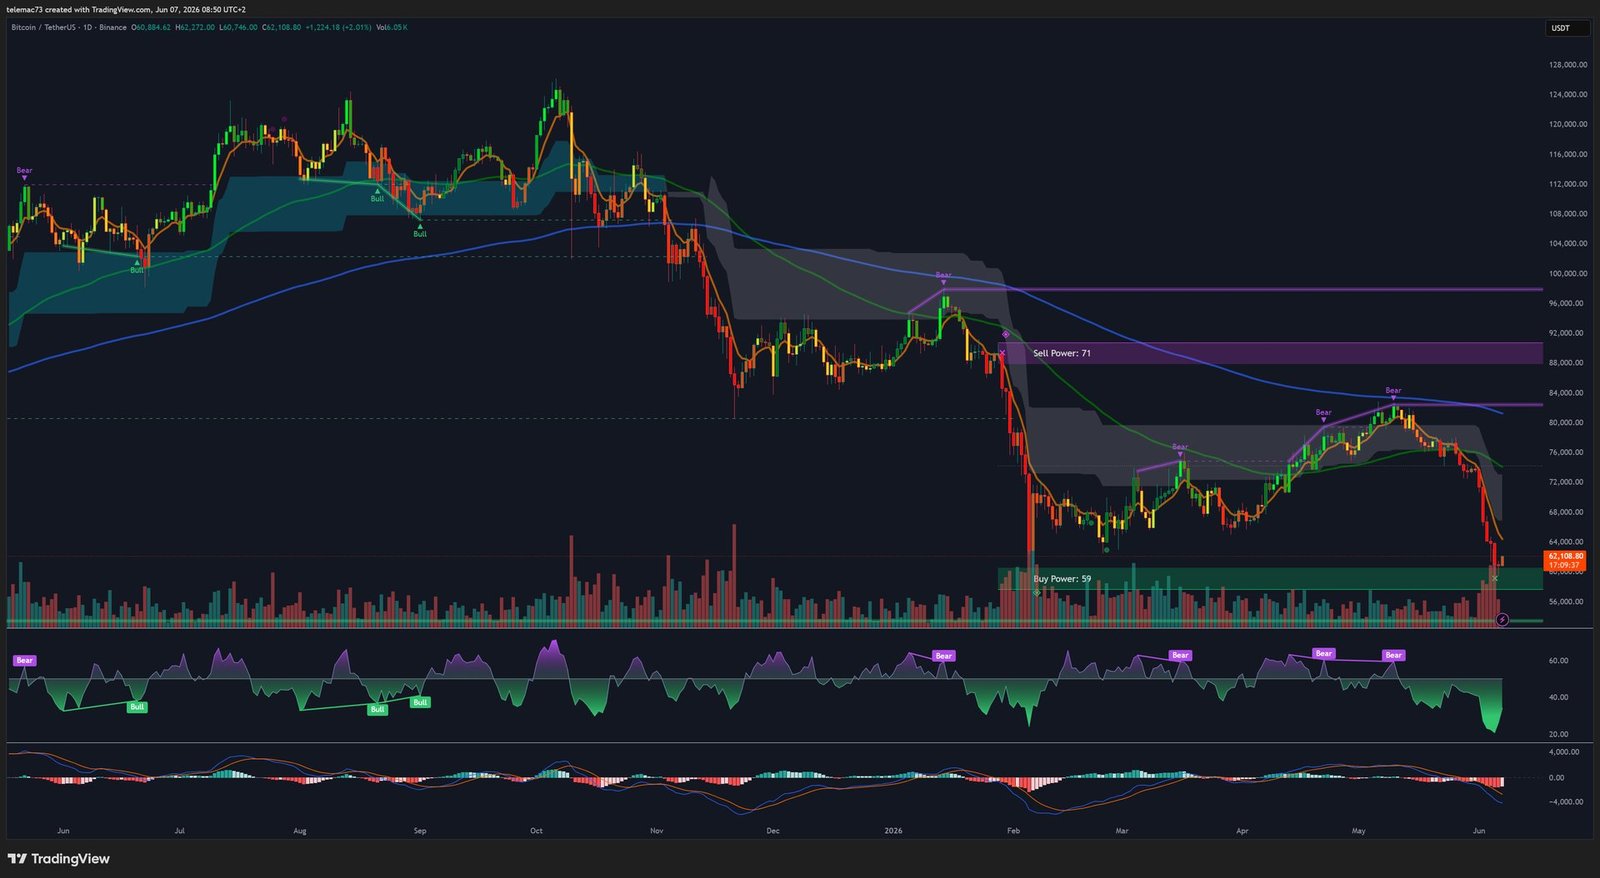
The most critical technical level currently being tested is the 200-Week Moving Average (200-WMA), sitting in the tight range of $61,700–$62,000. Historically, this line marks the boundary between bull markets and prolonged crypto winters. The daily RSI plunged to a record low of 17 — a statistical anomaly signaling extreme oversold conditions and paradoxically one of the most asymmetric theoretical accumulation zones of the cycle. The logarithmic Rainbow Chart has slid into « Fire Sale » territory, generating its rarest buy signal.
The daily MACD shows a « Death Cross » in full expansion, with the histogram widening in negative territory. Directional momentum remains firmly anchored on the sell side.
4-Hour Chart (H4): Intermediate Dynamics
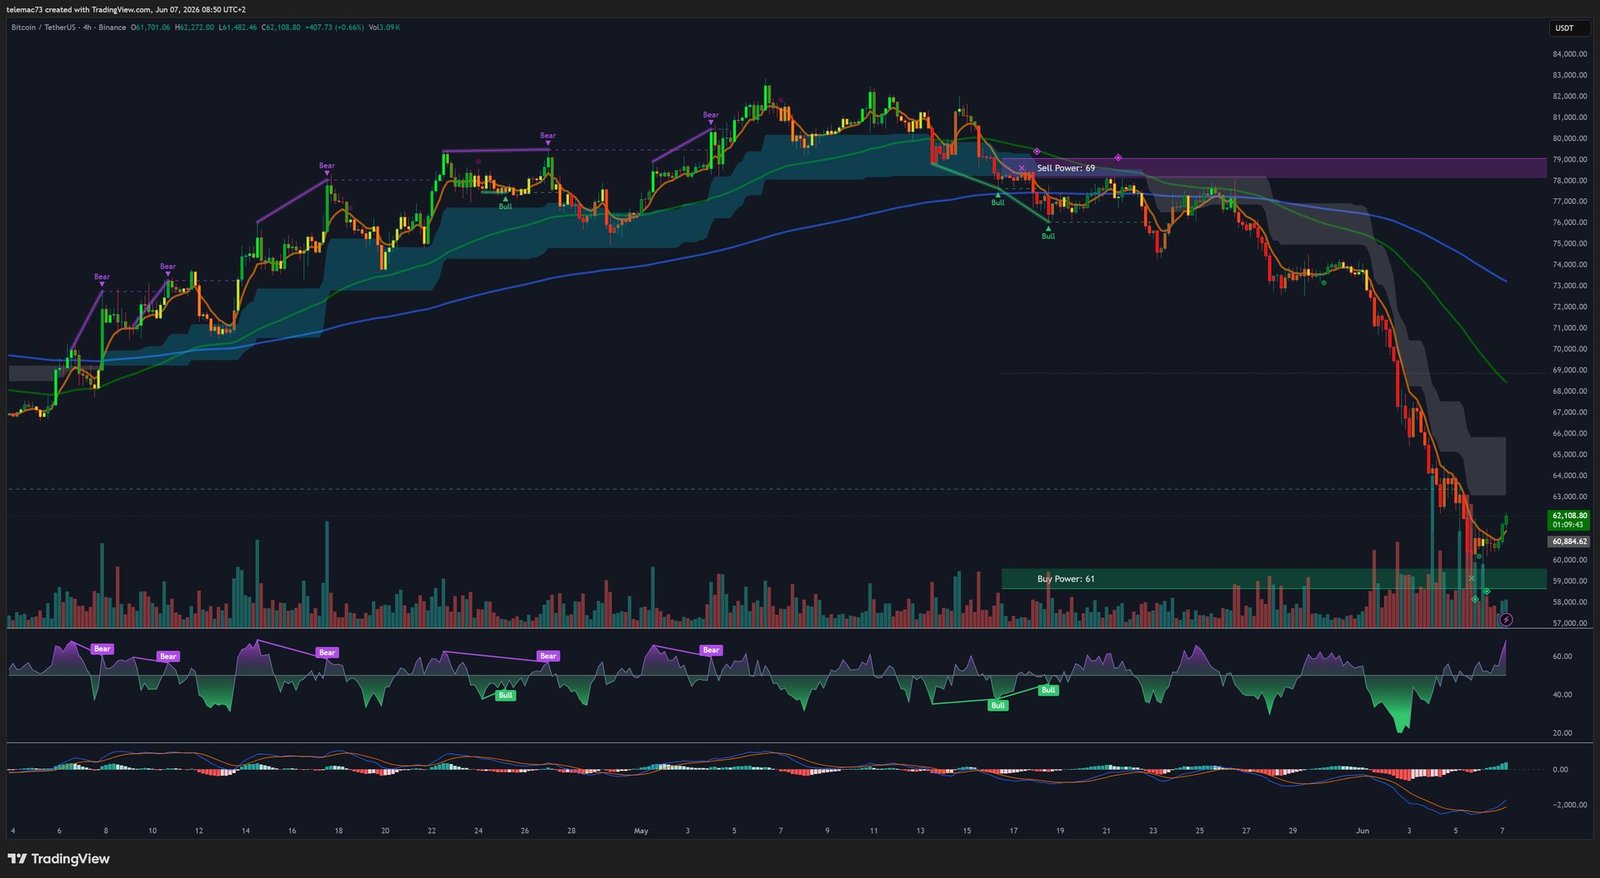
On the 4-hour timeframe, the fractality of the decline reveals its internal mechanics. Price trades below all major EMA resistances in a mathematically impeccable lower highs / lower lows structure. A Death Cross of the moving averages provides trend-following algorithms the signal to maintain leveraged short positions.
An asymmetric compression triangle had formed ahead of the NFP release. Buyers’ inability to defend the lower boundary — in a context of anemic spot liquidity ($679 billion in April, lowest since October 2023) — precipitated the violent breakdown. The H4 RSI does show a slight bullish tremor, however, suggesting early seller exhaustion approaching the $60,000 zone.
15-Minute Chart (M15): Microstructure and the NFP Shock
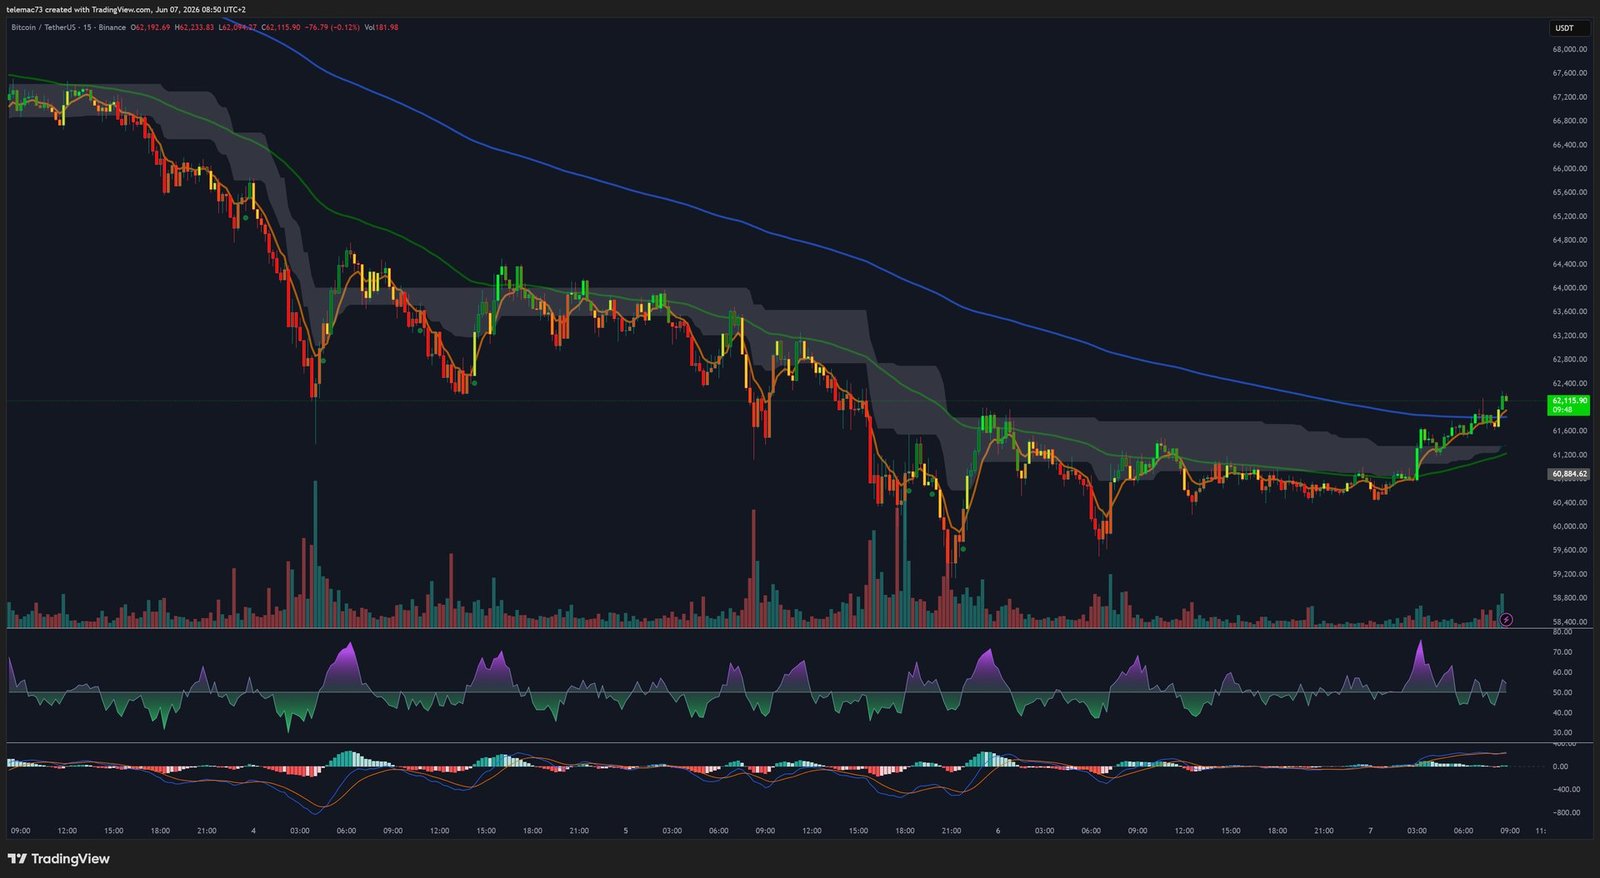
The 15-minute timeframe documents the market’s mechanical reaction to the NFP shock with surgical precision. A ferocious capitulation candle pierced local supports down to $60,884 (and $59,100 on other exchanges), triggering a spectacular V-shape recovery: the stop-loss sweep immediately attracted buy-the-dip participants and mean-reversion arbitrage bots, pulling price back to $62,115.
The M15 MACD printed a « Golden Cross » (bullish crossover below zero, histogram turning green). This signal validates the short-term bounce — while remaining subordinate to the dominant daily trend, which stays deeply bearish.
🔥 Order Book Heatmap: Liquidity Topography
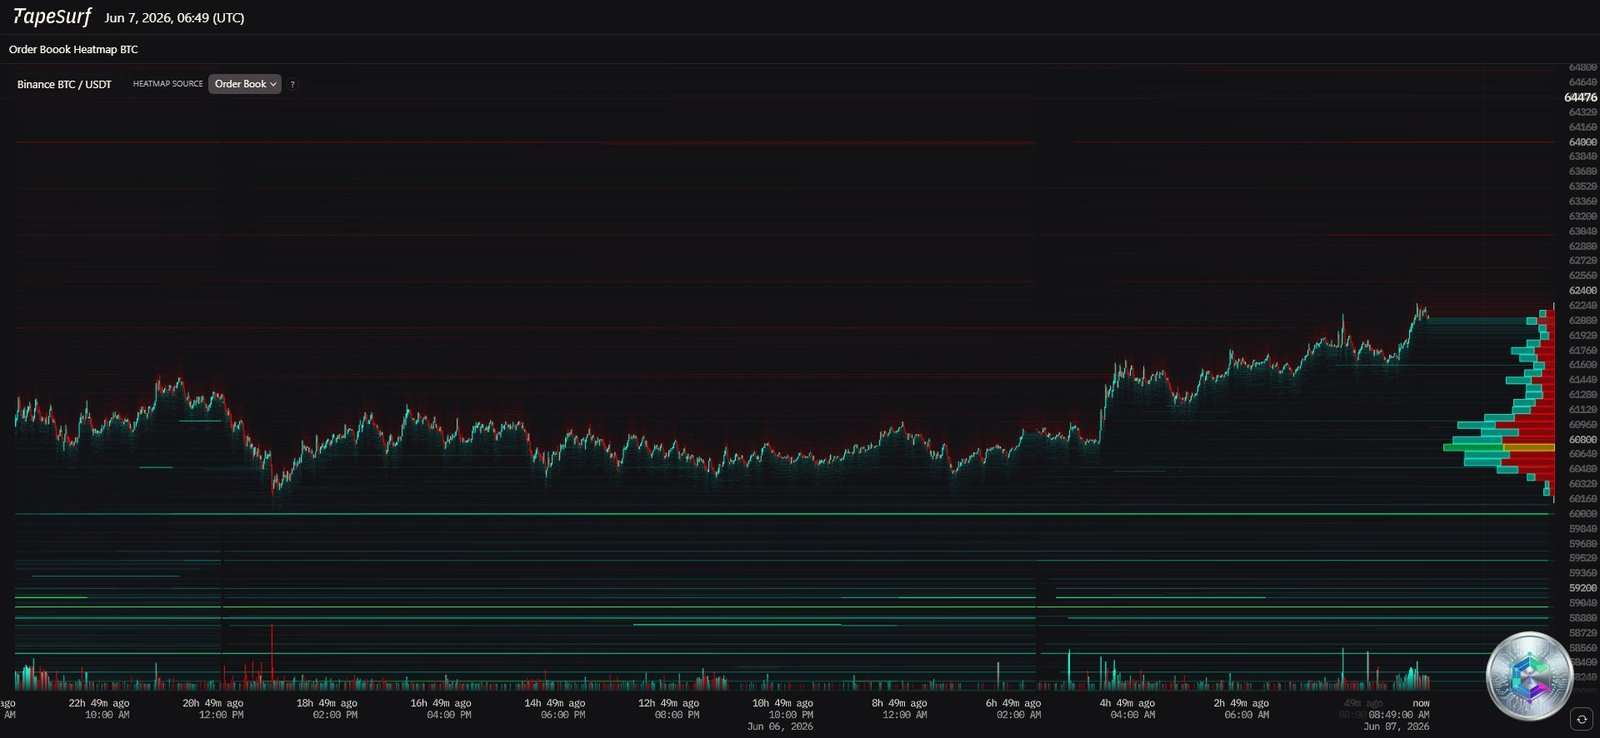
The order book heatmap (TapeSurf, BTC/USDT Binance) reveals a strikingly asymmetric topography. Between $64,000 and $65,000, a massive concentration of incandescent red and yellow blocks constitutes an institutional sell wall — every relief rally will run headlong into this glass ceiling. Conversely, green blocks between $60,000 and $61,000 materialize institutional buying interest that cushioned the initial drop. The visual density of the sell wall remains superior to the bid cushion, confirming a persistently bearish directional bias.
💥 The Liquidation Event: $1.8 Billion Wiped Out
The drop below $60,000 triggered a historically violent « leverage flush. » Within 24 hours, exchange risk algorithms forcibly liquidated between $1.73 billion and $1.8 billion in positions, leading to the temporary ruin of 291,000 to 330,000 traders worldwide. The breakdown is revealing: 85% of liquidations were long positions.
| Asset | Liquidations (24h) | Price Impact |
|---|---|---|
| Bitcoin (BTC) | $500M–$777M | Drop to $59,100 then rebound |
| Ethereum (ETH) | ~$400M | -12% |
| Solana (SOL) | ~$89M | -11% |
| Total Crypto | $1.73–1.8B | Market cap to $2.06 Trillion |
📅 Macro Calendar: The Week of Maximum Danger (Mid-June)
Bitcoin enters an exceptionally dense and perilous macroeconomic window:
| Date | Catalyst | Potential BTC Impact |
|---|---|---|
| June 10 | CPI (US Inflation) | Hot CPI → hawkish Fed → bearish pressure |
| June 11 | PPI (Producer Prices) | Confirms/denies inflationary persistence |
| June 12 | SpaceX IPO (expected) | Massive drain of speculative capital |
| June 16–17 | FOMC + Dot Plot | Hawkish = extended downtrend / Dovish = short squeeze |
🎯 Strategic Scenarios and Projections
Bearish Scenario (dominant probability): If CPI surprises to the upside and the Fed’s Dot Plot reduces anticipated rate cuts, the $53,000 target (macro Bear Trap) becomes the base case for July. This level aligns with projections from Standard Chartered and analyst Aralez — representing a final capitulation phase allowing institutions to accumulate massively before the cycle’s true ascent toward six figures.
Bullish Scenario (contrarian): A below-expectations CPI or an accommodative Dot Plot would trigger a thunderous mean-reversion. The RSI at 17 and M15 bullish divergences would position this rebound as a violent short squeeze. Price inefficiencies created during this crash would be filled at spectacular speed. The immediate resistance wall to clear remains $64,000–$65,000.
Stabilization at $60,000–$62,000 remains the most mathematically probable short-term scenario according to AIX Alpha’s 10,000 market simulations, temporarily ruling out the hypothesis of an uninterrupted linear collapse.
🧭 Strategic Conclusion
Bitcoin finds itself in June 2026 caught between two contradictory forces. On one side, the crushing pressure of restrictive macroeconomics (high rates, strong dollar) and competition from an AI sector that is vampirizing the innovation narrative and institutional liquidity. On the other, extreme oversold statistical anomalies (RSI at 17, Rainbow Chart in « Fire Sale ») and the fierce defense of the 200-WMA by institutional accumulation algorithms.
The mid-June calendar (CPI, FOMC, SpaceX IPO) will dictate the final resolution. The rational investor today must prioritize capital preservation through options hedges, while preparing progressive accumulation strategies at extreme discount levels. Betting on a linear continuation of the decline exposes short sellers to symmetrically violent liquidation risks.
⚠️ Disclaimer: This article is written for educational and informational purposes only. It does not constitute investment advice, nor a recommendation to buy or sell cryptocurrencies or any other financial asset. Cryptocurrency markets are extremely volatile and carry the risk of total capital loss. Always conduct your own research and consult a qualified financial advisor before making any investment decision.