
Introduction: A Market Under Extreme Pressure
In mid-March 2026, Bitcoin (BTC) is trading within a critical valuation zone between $69,000 and $71,600, at the intersection of powerful opposing forces. On one side, mounting global macroeconomic pressures exacerbated by unprecedented geopolitical tensions. On the other, an internal market structure underpinned by robust and persistent institutional demand.
By integrating on-chain data, deep order book analysis via liquidity heatmaps, and granular technical analysis across timeframes ranging from Daily down to 15 minutes, this report provides a comprehensive panorama of current and future price dynamics.
Macroeconomic and Geopolitical Context
The market is operating under the direct influence of heightened geopolitical tensions. Recent airstrikes involving the United States, Israel, and Iran have introduced a tangible war premium across global financial markets, pushing WTI crude oil beyond the psychological $100/barrel level. Paradoxically, despite Bitcoin suffering a brutal flash crash to the $62,400 threshold, the asset subsequently staged a technical rebound of more than 13%, demonstrating remarkable structural resilience.
This notable divergence from traditional risk assets — the Nikkei index fell 6% over the same period — empirically reinforces the Bitcoin-as-digital gold and asymptotic safe haven narrative against systemic geopolitical risks.
The most decisive near-term event remains the upcoming FOMC (Federal Open Market Committee) meeting scheduled for March 18, 2026. Pricing models currently assign over 92% probability to a rate hold within the 3.50%–3.75% range. Institutional investor attention is squarely focused on the dot plot and the semantics of Jerome Powell’s speech, against a backdrop of inflation exacerbated by the 15% global tariffs recently implemented by the US administration.
Fundamental Analysis: Sentiment and Institutional Absorption
The Fear & Greed Index
Market participant psychology has experienced extreme oscillations in recent weeks. The Fear & Greed Index currently sits at 28, firmly anchored in « Fear » territory — a meaningful improvement over the abysmal score of 8 (Extreme Fear) recorded during the capitulation to $62,400 around March 10.
Historically, this zone of persistent fear coupled with price stagnation represents an optimal accumulation window for smart money. It allows excess leverage from retail speculators to be purged, transferring assets to long-conviction portfolios. The absence of a massive return of speculative capital nevertheless keeps the market on unstable ground, prone to erratic moves triggered by isolated institutional flows.
The Paradoxical Dynamics of Spot Bitcoin ETFs
In sharp contrast to retail caution, institutional flows through Spot Bitcoin ETFs display aggressive accumulation dynamics. After a brief lull in February, Spot ETFs recorded $180.4 million in net inflows in a single session, marking the peak of five consecutive days of positive flows. On a weekly basis, these vehicles absorbed $767.3 million, bringing the March cumulative total to an impressive $1.34 billion.
BlackRock’s iShares Bitcoin Trust (IBIT) continues to dominate, capturing $46 million on March 12 following $115 million the day prior. This constant institutional buying pressure acts as an unshakeable fundamental floor, systematically absorbing available supply on centralized exchanges.
A fascinating analytical anomaly presents itself however: the MVRV ratio applied to ETF cohorts has recently dipped into negative territory, meaning the average recent ETF holder is currently sitting at an unrealized loss. Historically, the exhaustion of selling liquidity within this cohort invariably precedes the formation of a solid macroscopic bottom.
Liquidity Mapping: The Order Book Heatmap
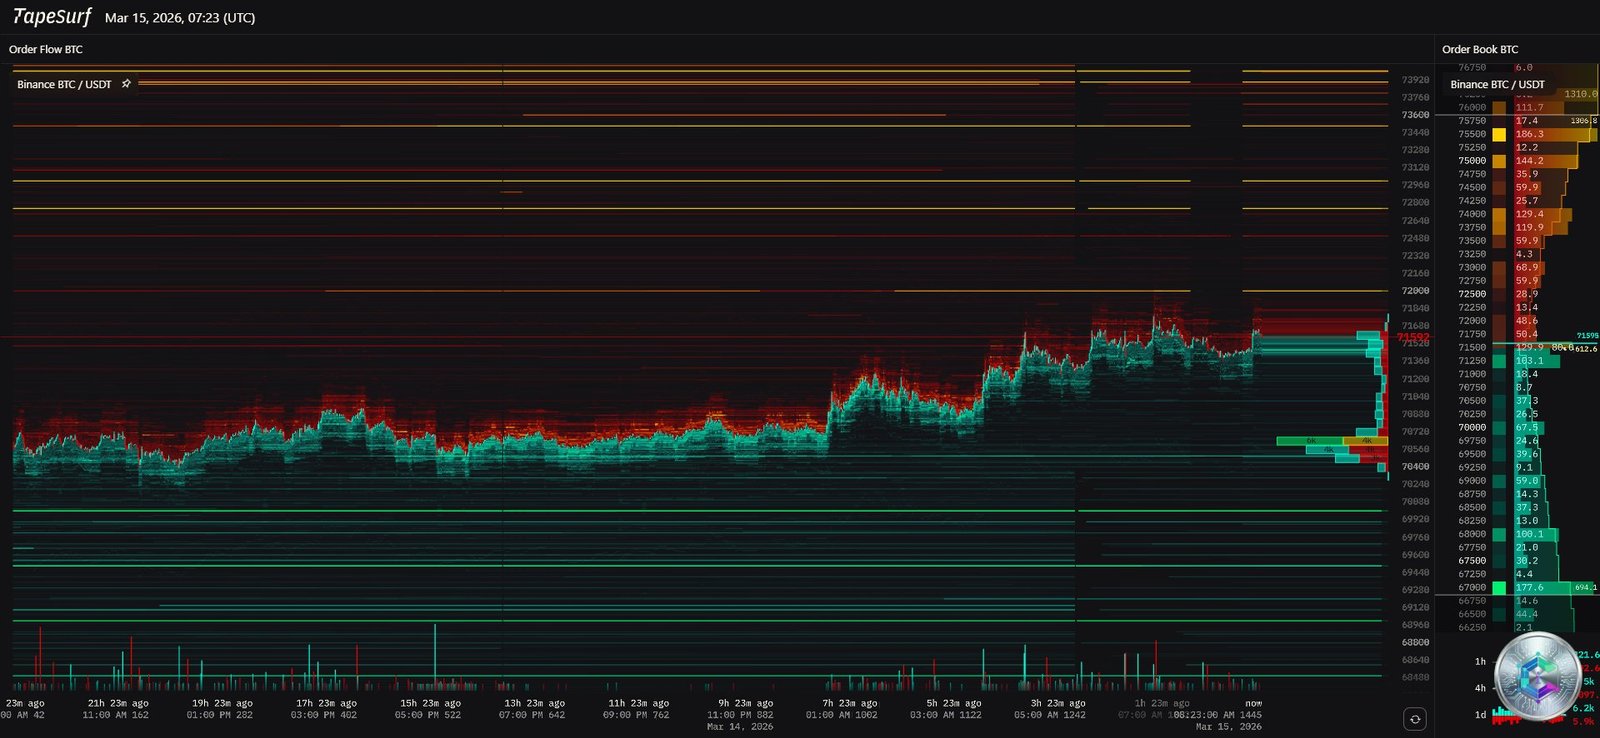
Analysis of the liquidity heatmap reveals a highly asymmetric order book microstructure. High-leverage crypto markets structurally act as liquidity-seeking engines, mechanically attracting price toward zones of concentrated limit orders and potential liquidations.
On the sell side (Ask): Extremely dense red bands begin aggressively at $72,000 and thicken exponentially between $73,000 and $74,000. These institutional sell walls require massive market-buy volume to be absorbed before any sustained breakout can occur.
On the buy side (Bid): Dense green clusters are stacked just below $70,000, with particularly thick support around $69,000 extending down to the critical $67,500 zone. These buy walls serve as algorithmic safety nets, absorbing downside volatility shocks.
Three Major Structural Zones
- The Liquidity Void ($70,000 – $72,000): The zone where Bitcoin currently trades. Thin order book depth explains rapid oscillations and high intraday volatility.
- The Upper Liquidity Magnet ($74,000 – $75,000): A major short liquidation cluster. Predatory algorithms will almost inevitably attempt to sweep this pocket before initiating any significant bearish reversal.
- The Lower Abyss ($64,000 – $68,000): In case of technical rejection or a hawkish FOMC, this zone represents the primary downside risk, housing long liquidation clusters estimated to be four times larger than those above current price.
Macro-Structural Chart Analysis: Daily Timeframe
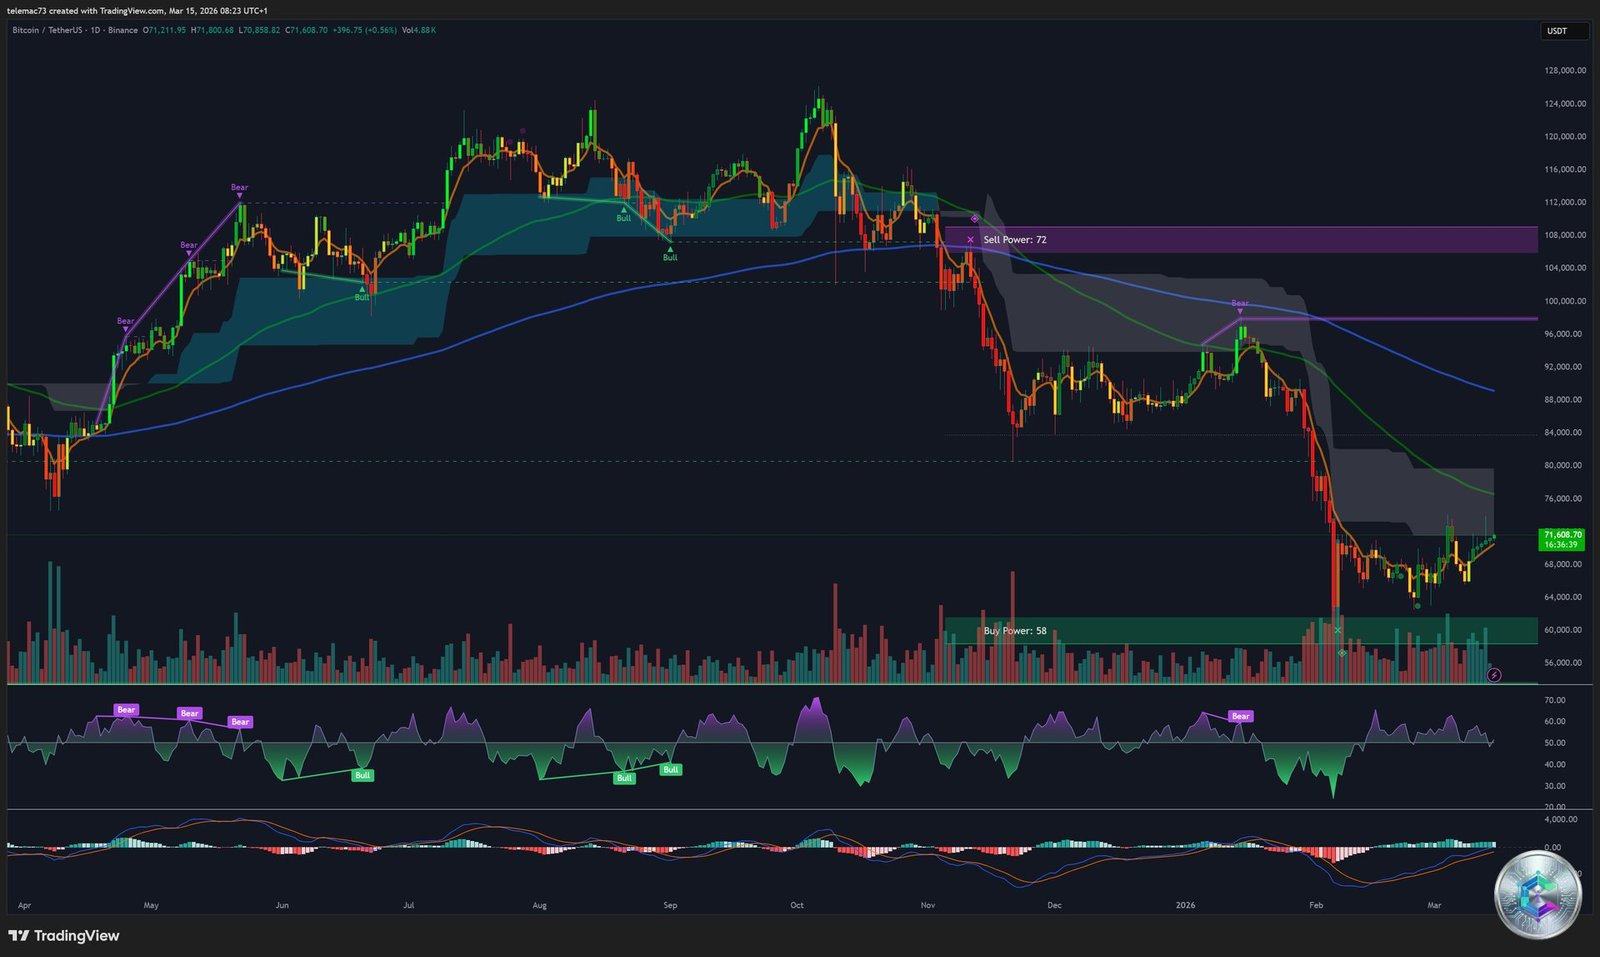
On the daily chart, Bitcoin is trading around $71,600 within a broad consolidation structure resembling a macroscopic Bull Flag. Unlike the devastating 2022 bear market where successive declines broke support levels and entrenched below major moving averages, the current 2025/2026 structure displays clear defensive resilience: successive lows are aggressively bought, forming long lower wicks that express the market’s categorical refusal to accept valuations below $60,000.
Two institutional blocks dominate the chart architecture:
- Green support block « Buy Power: 58 »: The $60,000–$64,000 zone that perfectly served as a springboard during the recent crash.
- Purple resistance block « Sell Power: 72 »: Above $100,000 — the macro-theoretical target for the current cycle.
Oscillators: RSI and MACD
The RSI displays a spectacular recovery trajectory. After plunging deep into oversold territory during the crash to $60,000, it has vigorously crossed above the 50 midline — the classic fingerprint of buyers regaining medium-term control.
The MACD corroborates this paradigm shift: histogram bars, previously deep pink reflecting strong bearish momentum, are progressively fading. This flagging bearish momentum foreshadows an imminent Golden Cross on the signal lines — a massive algorithmic buy signal for trend-following funds.
Tactical Analysis: 4-Hour Timeframe (H4)
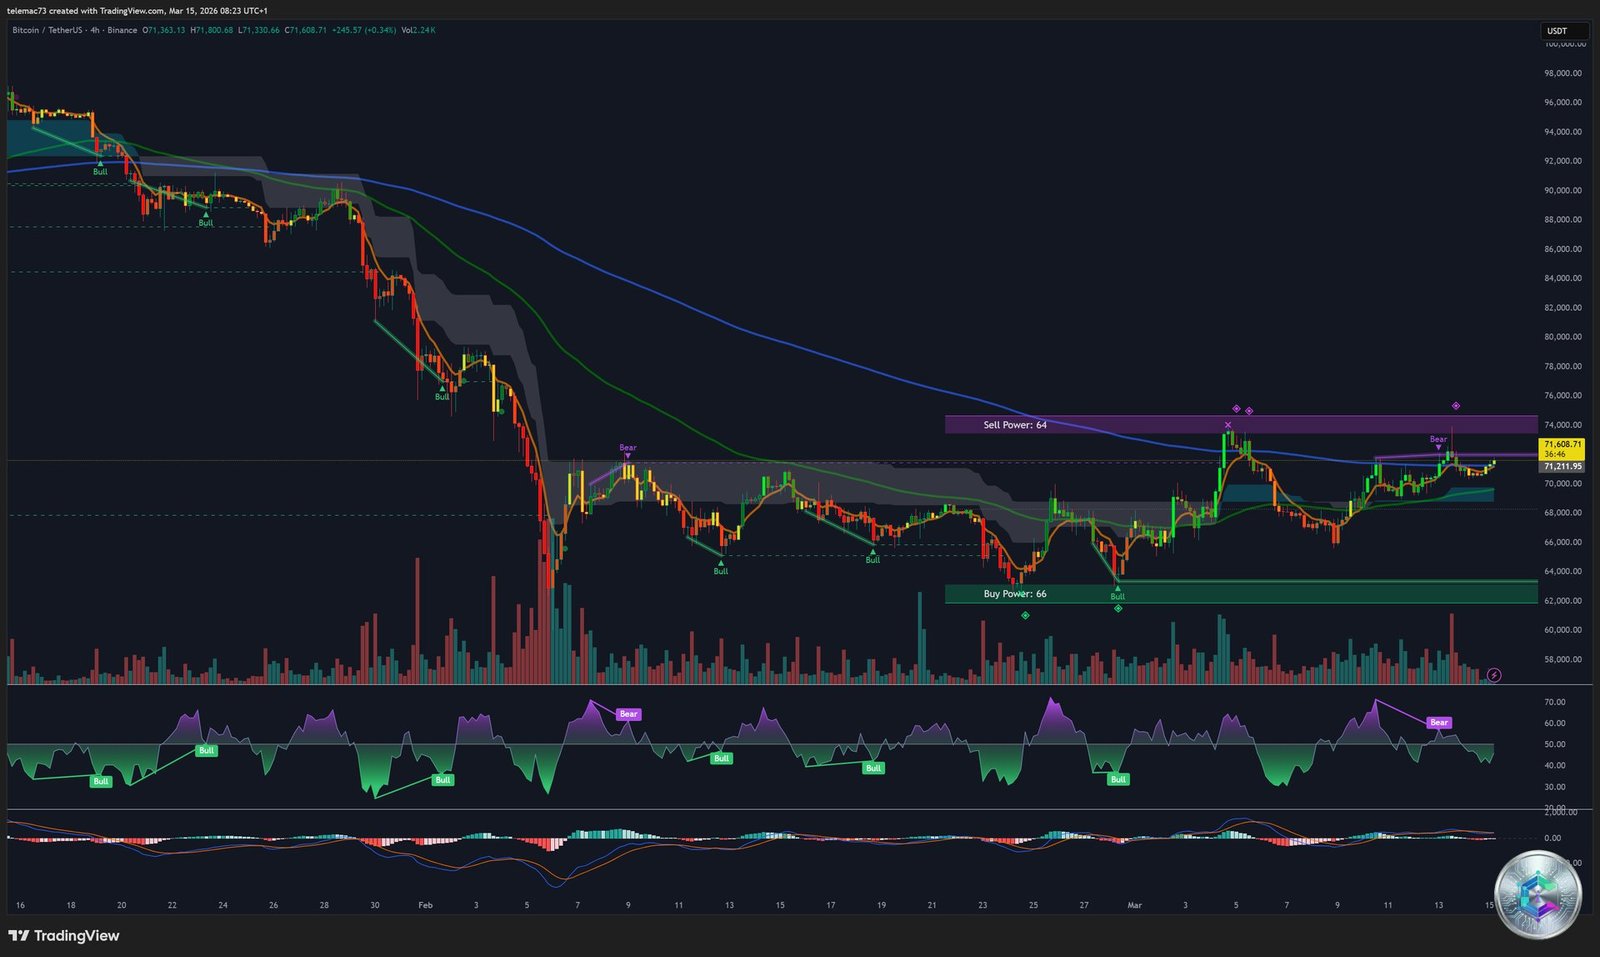
The 4-hour chart describes the completion of a rounding bottom or potentially the early formation of a Cup and Handle pattern. An impulsive breakout from a compressive bearish envelope has occurred, with price propelled from the green « Buy Power: 66 » zone ($62,000–$64,000) beyond intermediate resistances.
The most formidable immediate resistance is the purple « Sell Power: 64 » zone in the $74,000 region. Price is currently caught between the rising moving average acting as a launchpad and this institutional sell block, explaining the laborious consolidation underway.
On the H4 MACD, a bullish Golden Cross has already been confirmed well below the zero line — a configuration historically associated with very powerful bounces. The key challenge remains a validated close above $72,600 (EMA 50 + descending trendline convergence), which would definitively invalidate the medium-term bearish structure.
Intraday Microstructure: 15-Minute Timeframe (M15)
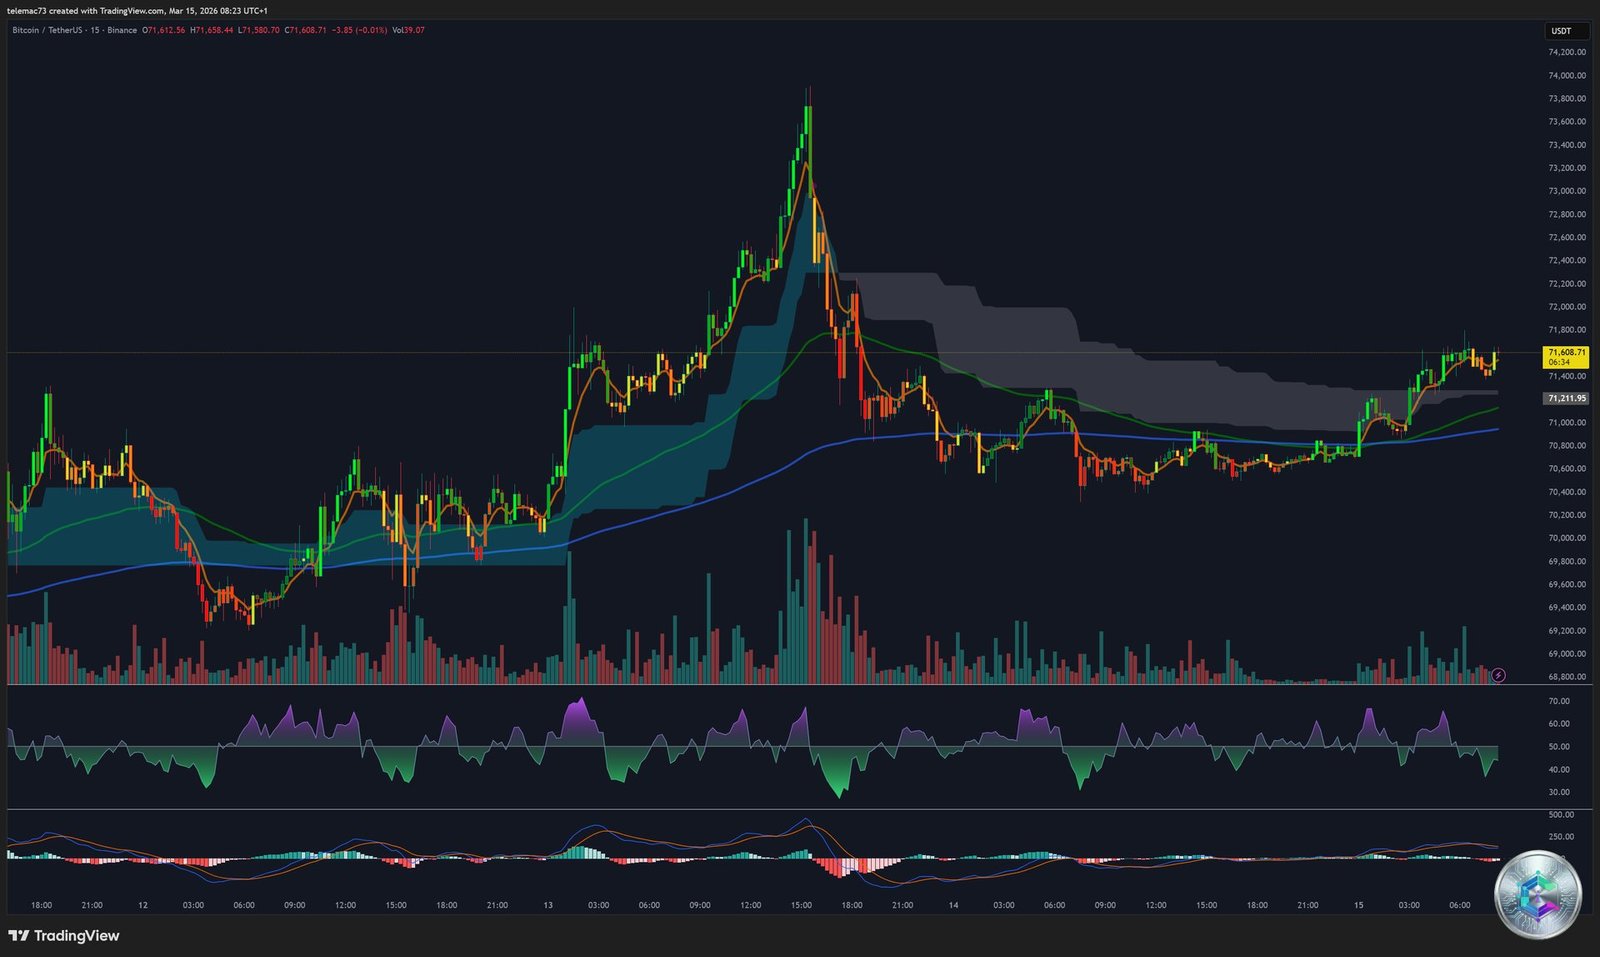
The M15 chart illustrates a phase of extreme compression following a violent short squeeze that had propelled price to a local peak around $73,800 before a brutal retracement back toward $70,000.
Since this shock, BTC has formed a symmetrical triangle (or Bull Pennant if the prior rally is considered the flagpole): lower highs and higher lows, with kinetic energy accumulating spectacularly. Oscillators confirm total indecision: RSI neutral at 50, MACD flatlined on the zero axis. This algorithmic calm is the invariable prelude to a directional volatility expansion.
Key Level Map
| Price Level (USD) | Category | Description |
|---|---|---|
| $100,000+ | Secular Resistance | Macro-theoretical cycle target. « Sell Power: 72 » block (Daily) |
| $79,000 | Macro Resistance | True Market Mean — Absolute fundamental ceiling before parabolic bull run |
| $74,000 – $75,000 | Resistance / Liquidity Magnet | Short liquidation cluster. « Sell Power: 64 » zone. Predatory algorithm primary target |
| $72,600 | Bullish Pivot (H4) | EMA 50 + descending channel convergence. Breakout triggers acceleration toward $74k |
| $71,211 | Local Resistance | Former support turned resistance — identified on H4 |
| $70,000 – $71,600 | Current Consolidation Zone | Relative liquidity void. M15 compression triangle in progress |
| $69,000 | Intraday Pivot / Support | Psychological level defended by growing buy walls |
| $65,600 | Secondary Support | Potential neckline of a Head & Shoulders structure (if reversal occurs) |
| $62,000 – $64,000 | Absolute Support / Local Floor | « Buy Power: 66/58 » block. Anchor of recent crash. Capitulation zone |
| $54,900 | Ultimate Valuation Floor | On-chain Realized Price — Final fundamental support in case of cataclysmic capitulation |
Three Post-FOMC Scenarios
The March 14–20, 2026 window is unilaterally identified by quantitative analysts as the most critical period of Q1 for digital assets. It bears noting that Bitcoin has sustained a bearish correction following 7 of the last 8 FOMC meetings in 2025.
🔵 Neutral / Base Scenario — Probability: 55-60%
Rates held in line with consensus + one cut anticipated for the year. Classic « Sell the News » mechanism. Moderate 3–5% purge, M15 triangle breaks downward, temporary loss of $69,000, retracement toward $67,000–$70,000. Healthy momentum reset before resumption of the underlying uptrend.
🟢 Dovish / Accommodative Scenario — Probability: 15-20%
Dot plot revised to two rate cuts in 2026. Bullish electroshock: immediate breach of EMA 50 ($72,600), short sweep at $74,000, Fibonacci extension toward $75,000–$80,000. Direct assault on the True Market Mean fortress at $79,000.
🔴 Hawkish / Restrictive Scenario — Probability: 20-25%
Rate cuts for 2026 removed entirely amid persistent sticky inflation exacerbated by oil shocks and the tariff trade war. Global risk-off shockwave. Collapse below $69,000 and the daily moving average. Inexorable plunge toward $63,000–$65,600, testing the neckline of the potential Head & Shoulders reversal structure.
Conclusion: A Powder Keg Awaiting a Spark
The holistic analysis of the Bitcoin market heading into the close of Q1 2026 reveals an asset in structural transition, trapped in a highly precarious equilibrium. The juxtaposition of flows highlights a fascinating paradox:
On one side, relentless institutional accumulation via ETFs absorbing circulating supply at hundreds of millions of dollars per week, erecting a robust long-term valuation floor. On the other, a macroeconomic landscape polluted by potential stagflation, systemic geopolitical conflicts, and retail investor apathy — all choking the velocity needed for an organic, explosive, self-sustaining bull run.
On the pure price mechanics front, the chartist diagnosis delineates a battlefield with precise frontiers. The emphatic rejection of selling pressure near $62,000 and the subsequent breakout of the bearish envelope on the 4-hour chart confirm that buying forces retain strategic initiative. RSI bullish divergences and the MACD Golden Cross formation validate the neutralization of intrinsic bearish dynamics.
Yet the algorithmic wall of the EMA 50 (at $72,600), compounded by the suffocating concentration of limit orders on the heatmap between $73,000 and $75,000, guarantees that every bullish increment will demand a colossal expenditure of fresh capital. The fundamentally asymmetric order book, with its gravitational abyss below (the liquidity void down to $64,000), permanently exposes the market to the risk of a purging correction.
The perfect compression triangle on the 15-minute chart is the ultimate visual metaphor for this market: a powder keg under extreme pressure, awaiting the directional spark that the Federal Reserve will inevitably provide on March 18. The resolution of this compression will define Bitcoin’s secular trajectory for the entire first half of the year ahead.
⚠️ Disclaimer: This article is written for exclusively educational and informational purposes. It does not constitute investment advice, nor a recommendation to buy or sell any financial or digital asset. Cryptocurrency markets are highly volatile and speculative. Any investment decision should be made after consulting a licensed financial advisor and in accordance with your own risk tolerance. Cryptoinfo.ch disclaims all responsibility for financial decisions made based on this content.