
Bitcoin is going through one of the most turbulent phases of its recent history this June 2026. After shedding nearly 30% of its value from its yearly highs and briefly diving below the $60,000 mark, the leading digital asset finds itself at a genuine inflection point. This correction is no simple technical accident: it stems from a rare convergence of forces — a massive leverage purge, an abrupt rotation of institutional capital, and a persistently restrictive US monetary policy stance.
To make sense of it, this report offers a complete multi-timeframe analysis (15-minute, 4-hour and daily charts), enriched by a study of the order-book heatmap and a macroeconomic, regulatory and cyclical perspective. The goal: to map out the price levels that will tip the trend one way or the other over the coming weeks.
A $1.6 Billion Purge: What the Order-Book Heatmap Reveals
The defining event of early June was the break of the institutional support at $70,000. The order-book heatmap revealed an abnormal concentration of conditional orders — mainly protective stops and liquidation thresholds for excessively leveraged long positions — stacked across the $70,000, $69,000, $68,000, $67,000 and $66,000 levels. As spot selling pressure pushed price below these levels, derivatives exchanges’ liquidation engines were forced into cascading market sell orders, creating a self-reinforcing negative feedback loop.
The scale of this event is remarkable: within just twenty-four hours, more than $1.624 billion in positions were liquidated, affecting over 263,000 traders. Including the 48-hour aftershocks and the broader DeFi and altcoin ecosystem, total leveraged position wipeouts ranged between $1.76 billion and $5.83 billion depending on the source. On Hyperliquid alone, a single liquidation order of $27.49 million was executed on the BTC-USD pair.
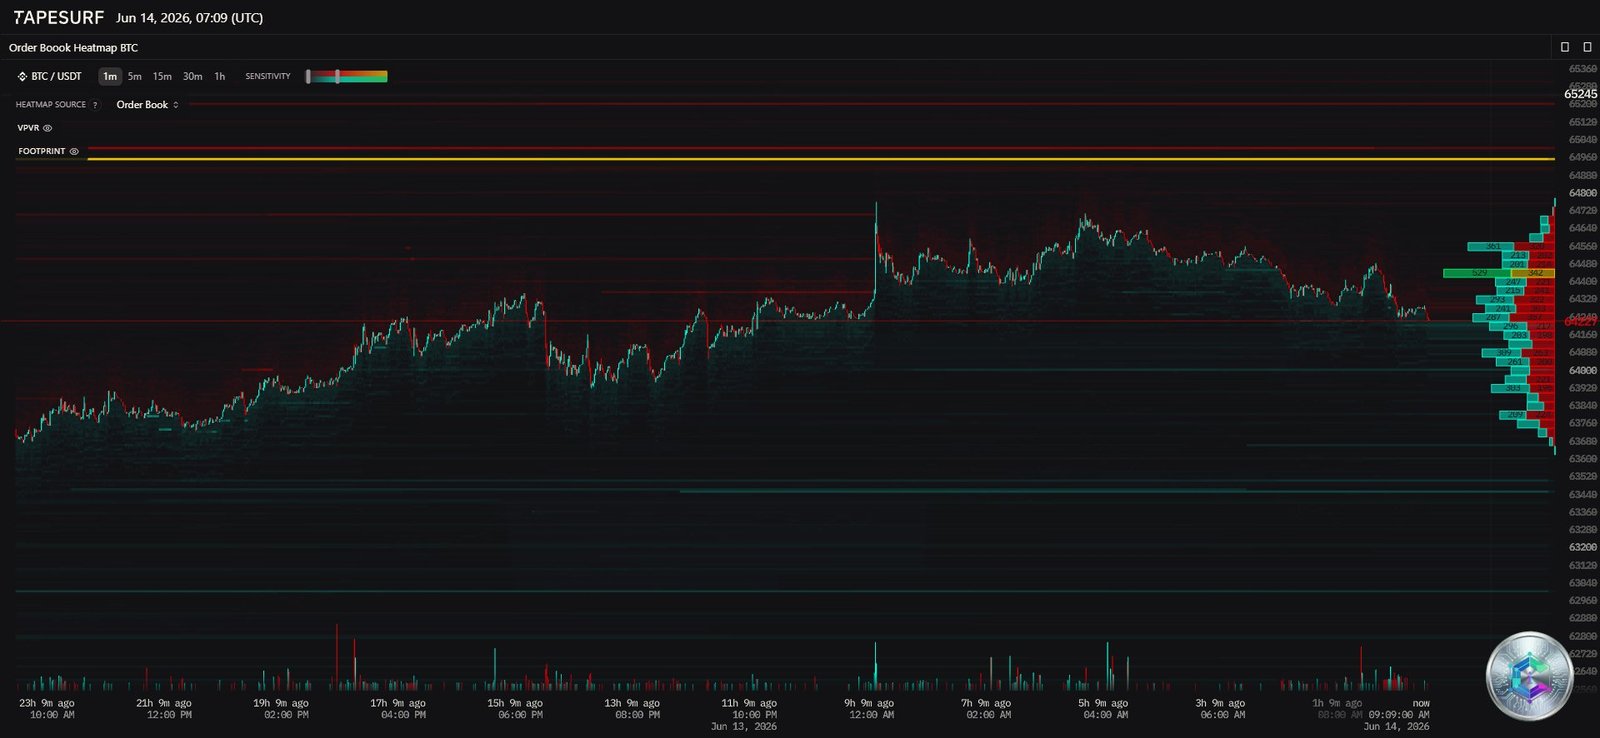
The order-book restructuring that followed this purge is highly instructive. Large buy walls have formed and consolidated in the $60,000–$60,500 zone, acting as an institutional shock absorber: a segment of high-capitalization investors clearly views this area as a fundamentally attractive entry point. Conversely, the asymmetry has flipped above current prices, with a build-up of short positions vulnerable to liquidation between $65,000 and $66,000 — a setup that acts as a magnet for market-making algorithms and could trigger a short squeeze if a favorable macro catalyst materializes.
A direct, and rather healthy, consequence of this purge is the reset of perpetual futures funding rates, now back in neutral or even slightly negative territory. This transfer of wealth from weak hands to strong hands is generally a prerequisite for establishing a durable market bottom.
Multi-Timeframe Reading: Three Scales, Three Market Psychologies
Each timeframe tells a distinct part of the current story, from the institutional macro-trend down to the intraday noise generated by high-frequency algorithms.
Daily Chart (1D): The Battle for the 200-Day Moving Average
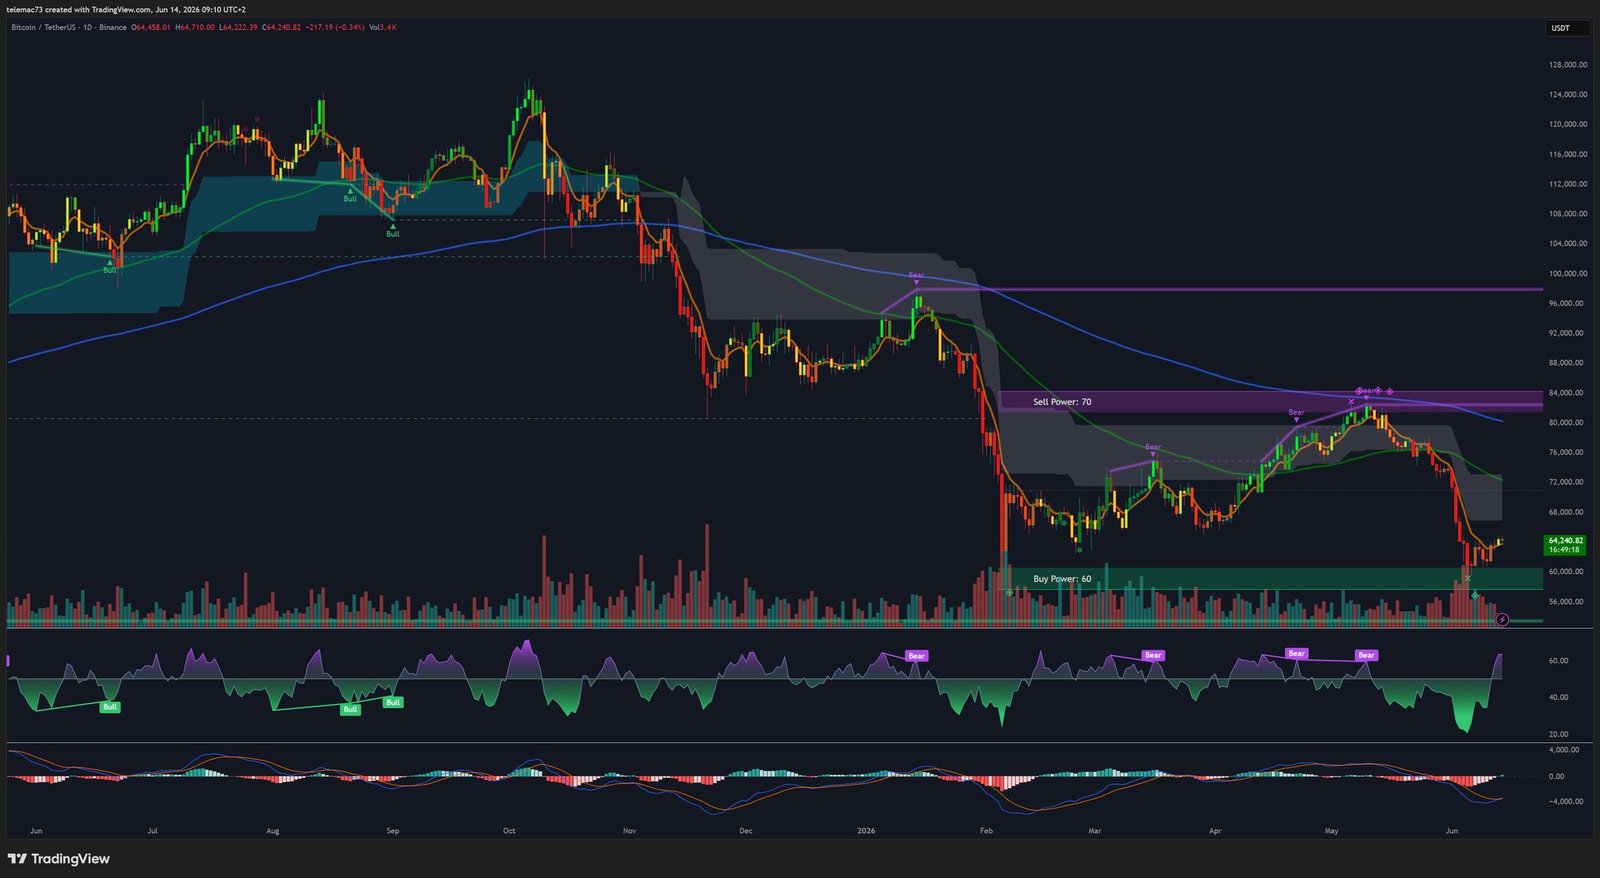
On the daily timeframe, the market is fighting to preserve its long-term bullish structure. An early warning sign came in mid-May, when Bitcoin sustained a break below its 50-day moving average, invalidating medium-term momentum and prompting trend-following algorithms to cut exposure.
The market’s attention is now firmly fixed on the 200-day moving average, sitting precisely around $61,968. In classic technical analysis doctrine, this average marks the symbolic border between a bull and a bear market: the fact that Bitcoin is testing this dynamic support and repeatedly attempting to close above it underscores its existential importance for the trend ahead. A decisive weekly close below it would trigger a major structural downgrade in quantitative funds’ risk models.
Momentum oscillators confirm the market’s stressed state. The MACD officially printed a « death cross » in early June, with its fast moving average diving below the slow one into negative territory — confirming seller dominance over the intermediate cycle. That said, the MACD histogram shows signs of flattening, suggesting selling pressure may be approaching exhaustion. The 14-day RSI, sitting around 35, has brushed against extreme oversold territory (below 30) — a level historically associated with local bottoms and attractive to contrarian investors.
From a structural standpoint, two competing readings are in play. The most bearish analysts identify a potential large head-and-shoulders formation, with the $60,000 zone acting as the neckline: a confirmed breakdown on strong volume would technically project a target around $36,000. Elliott Wave theory, on the other hand, offers a far more constructive interpretation, in which the current correction represents Wave (4) of an impulsive super-cycle, paving the way for a final Wave (5) targeting the $94,500 zone. This dichotomy illustrates the extreme uncertainty currently paralyzing directional players.
4-Hour Chart (4H): The Mechanics of Compression
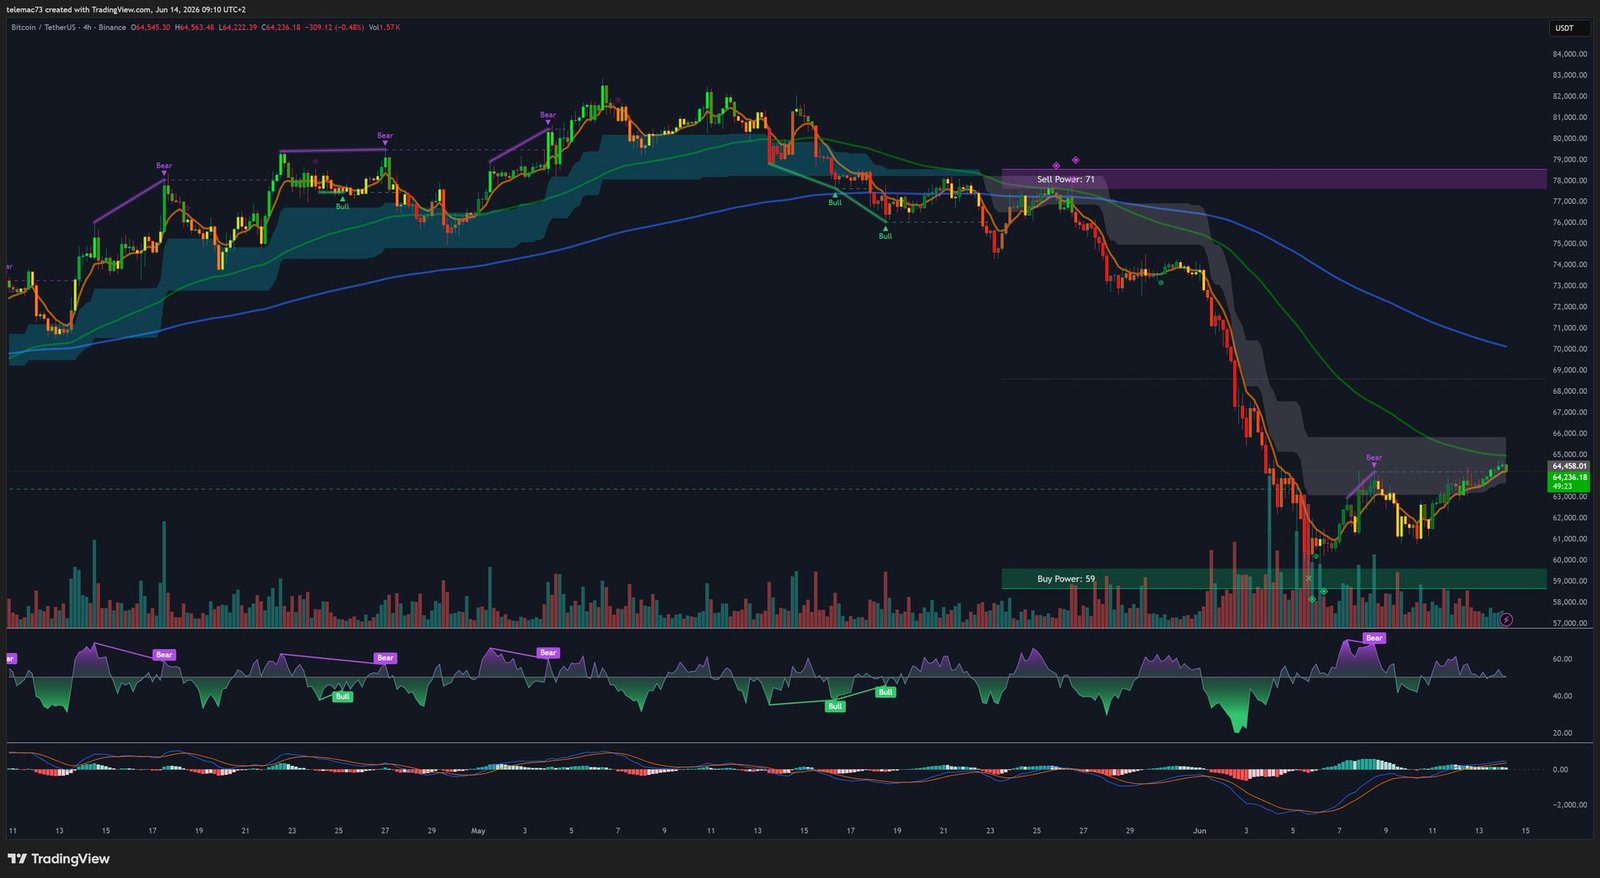
The 4-hour chart isolates the physiology of the consolidation that followed the initial crash. The dominant pattern here is bear flags: after each downward impulse, price stages weak corrective bounces on volume that systematically fades — a telling sign of institutional buyers’ lack of conviction. In the absence of volume, these rising channels have so far always resolved with breakdowns, resuming the primary trend.
More recently, volatility has contracted sharply, giving rise to a symmetrical compression triangle: progressively lower highs reflecting selling pressure against a firm horizontal floor defended by demand. Such compression typically precedes a violent expansion in volatility — and the direction of this triangle’s breakout will likely set the tone for the rest of the summer quarter.
15-Minute Chart: Microstructure Noise and Algorithmic Trading
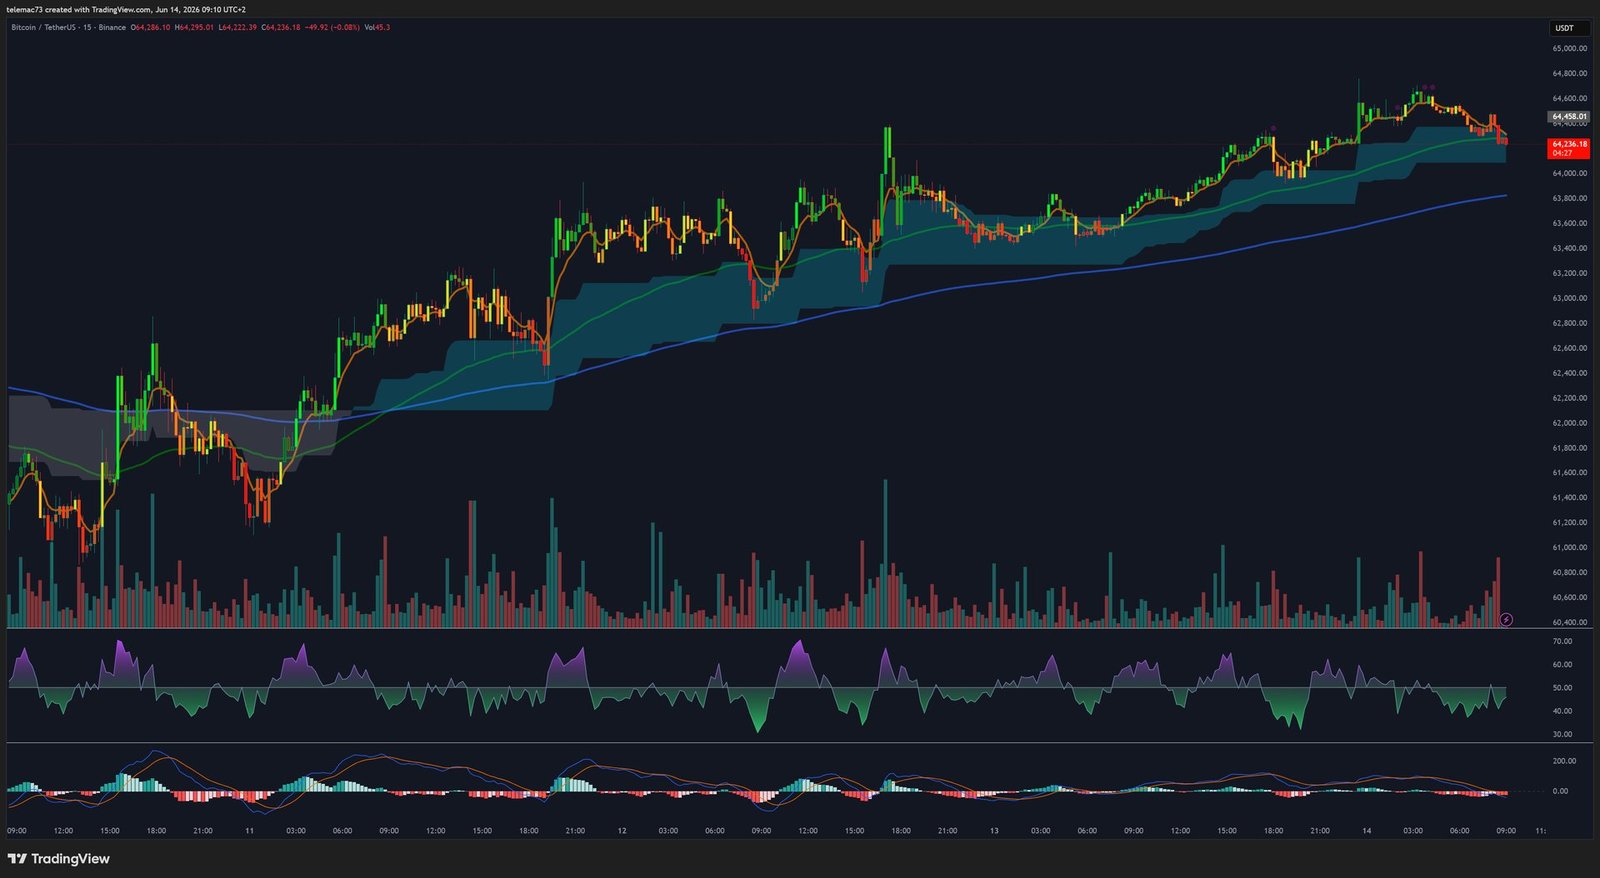
On the 15-minute scale, the analyst enters the realm of pure market noise, dominated by high-frequency trading and arbitrage bots. The footprint of macroeconomic headlines here is instantaneous, and often exaggerated: micro bull flags, for instance, formed spontaneously in reaction to diplomatic de-escalation headlines from the Middle East. Crossovers of very short-term moving averages (MA 9 / MA 21) generate constant buy and sell signals, exploiting pricing inefficiencies between CME futures, decentralized spot markets, and ETF net asset values.
The RSI on this timeframe is particularly unstable, printing multiple bullish and bearish divergences within a single session — a sign that top-of-book liquidity is extremely thin, which seriously complicates entry-point optimization for position traders.
Mapping the Critical Levels
These levels are not mere lines on a chart: they represent zones of intense psychological, technical and financial concentration.
| Level | Value (USD) | Significance |
|---|---|---|
| Major resistance (structural) | $74,880 | Ceiling of the former institutional distribution zone; a breakout would invalidate the current bear market. |
| Intermediate resistance (psychological) | $70,000 | Pivot of macro sentiment; rejection below this level keeps the short-term bearish bias intact. |
| Local resistance (liquidity) | $65,000 – $66,000 | Zone of concentrated short positions; a breakout could trigger a short squeeze. |
| Directional pivot point | $62,250 | Intra-weekly demarcation line; a necessary condition to validate a recovery scenario. |
| Dynamic support (200-day MA) | $61,968 | 200-day moving average; the reference line for institutional risk allocation. |
| Psychological and fundamental support | $60,000 – $60,500 | Major defensive bastion; order books show considerable buying appetite at this level. |
| Capitulation support | $55,000 – $57,590 | Theoretical target if $60,000 fails; cushion before a broader collapse. |
| Realized price (historical floor) | $40,000 – $46,000 | On-chain average acquisition cost; estimate of the ultimate cycle low. |
The Macroeconomic and Geopolitical Vise
The narrative of a Bitcoin decoupled from traditional finance now belongs to the past. The most structural headwind remains US Federal Reserve monetary policy. While markets started the year pricing in a series of rate cuts, May’s inflation data showed CPI rebounding to 4.2% year-over-year — sticky underlying inflation that refuses to converge toward the 2% target.
In response, the Fed has held rates on a restrictive plateau between 3.50% and 3.75%. Worse, prediction markets now assign a higher probability to a rate hike than to a cut by year-end. Prolonged elevated risk-free rates mechanically raise the opportunity cost of holding volatile assets like Bitcoin, pushing portfolio managers toward US Treasuries.
Geopolitically, escalating tensions between the US and Iran — including fears of a blockade of the Strait of Hormuz — triggered a broad flight to safety, with Bitcoin trading as a high-beta risk asset rather than a geopolitical safe haven. The subsequent relief, following the announcement of the cancellation of certain US strikes and talk of an imminent peace deal, allowed for a relief rally above $63,000, illustrating Bitcoin’s now-complete integration into the macro-geopolitical correlation matrix.
Capital Rotation: ETF Outflows Meet the SpaceX Pull
Spot Bitcoin ETFs endured a grueling 13 consecutive trading days of net redemptions, wiping out nearly $1.75 billion in institutional demand. The redemption mechanism requires authorized participants to sell underlying Bitcoin on the spot market to meet withdrawals, generating continuous algorithmic selling pressure. This losing streak was only broken on June 12, with a modest positive inflow of $85.85 million.
This capital flight is largely explained by sector competition: June 2026 saw a phenomenal rotation toward SpaceX’s historic Nasdaq IPO, as well as toward other major artificial intelligence players. When perceived superior tech-driven returns emerge, institutional commitment to cryptocurrencies evaporates quickly.
A Broken Dogma: Strategy Inc. and On-Chain Resilience
One of the month’s most symbolic events was the disclosure that Strategy Inc. (formerly MicroStrategy) sold 32 BTC, worth roughly $2.5 million at an average price of $77,135. Mathematically insignificant relative to a treasury holding more than 843,000 BTC, the transaction nonetheless carried considerable psychological weight: it dented the narrative of perpetual accumulation and absolute refusal to sell that Michael Saylor had cultivated for years. The sale, justified by accounting obligations tied to preferred stock dividends, was a reminder that even the most ideologically committed companies remain subject to the rules of treasury management — despite a swift compensatory buy-the-dip of over $500 million at lower prices.
Analysis of holder demographics reveals a clear split. On one side, long-term holders (wallets inactive for more than 155 days) show stoic accumulation, quietly absorbing the excess supply dumped by short-term, macro-spooked investors. On the other, the mining industry is suffering: two years after the 2024 halving, miner revenues have been cut in half while hash rate difficulty remains near all-time highs. To cover operating costs, many miners are forced to liquidate part of their production, creating a natural resistance ceiling that caps every rebound attempt.
A Tightening Global Regulatory Framework
In the United States, the introduction of the Digital Asset Market Clarity Act in the Senate has raised concerns over the strict KYC and on-chain traceability obligations it would impose, including on decentralized interfaces. The prospect of this vote is fueling fears of additional selling pressure. Adding to this, stablecoin issuer regulation is tightening via the GENIUS Act and new FDIC guidelines.
In Europe, the full implementation of the MiCA framework is generating colossal structural costs for exchanges and fragmenting liquidity, with some smaller players choosing to exit the continent altogether. This burden is compounded by the European Commission’s 21st sanctions package, which grants the EU the power to ban crypto services provided by entities in non-cooperative third countries — a powerful deterrent to international liquidity.
Four-Year Cycles and AI-Driven Modeling
Bitcoin’s macro-architecture has historically revolved around four-year cycles, paced by the halving mechanism. The bear markets of 2014, 2018 and 2022 retraced 86.9%, 84.2% and roughly 77% from their respective peaks. But the asset’s maturation — driven by deep institutional capital inflows and the launch of ETFs — has produced an amplitude compression: the peak reached in late 2025 turned out to be the « calmest » cycle top in modern Bitcoin history.
If this diminishing-returns logic holds, the bottom of the current cycle should be proportionally shallower than in previous cycles. Quantitative models therefore estimate the absolute floor of this bear market within a corridor of $40,000 to $46,000, potentially reached by Q4 2026 — far from the 80% collapses seen in the past.
On the algorithmic front, recent academic research on reinforcement learning applied to crypto trading shows that naive algorithms fail catastrophically during market regime transitions. By contrast, sophisticated adaptive risk-control approaches can generate positive returns while keeping drawdowns under control — a dynamic that partly explains the speed of rebounds observed at critical support tests, as quantitative funds are programmed to instantly exploit these oversold inefficiencies.
Conclusion: Two Scenarios for the Second Half of 2026
Bitcoin’s collapse below $65,000 reflects neither a technological failure nor an internal industry bubble bursting. Rather, it bears witness to Bitcoin’s complete and definitive integration into global high finance: by institutionalizing through ETFs and corporate treasuries, the asset has inherited the vulnerabilities of the global macroeconomic system. The confrontation between the 200-day moving average (around $61,968) and the inertia of the daily MACD death cross will define market direction for the months ahead.
- Bearish scenario: a decisive weekly close below $60,000, combined with a hawkish Fed stance, renewed ETF outflows, or an escalation in the Middle East, would trigger latent liquidation cascades and open the way toward $55,000–$57,000, with an extended risk of being pulled toward the $40,000–$46,000 zone.
- Bullish scenario: a sustained stabilization above $61,900, followed by a breakout of the $62,250 pivot supported by returning ETF inflows, would open the way toward the $65,000–$66,000 resistance, where the concentration of short positions could fuel a fast short-covering rally. A full bull market recovery, however, would require overcoming structural resistance beyond $70,000.
In such a highly volatile environment, a passive, purely directional approach appears risky. The resilience shown by long-term holders suggests rational accumulation remains relevant, provided it is paired with dynamic exposure management and constant monitoring of institutional flows and central bank decisions.
Disclaimer: This article is provided for informational and educational purposes only. It does not constitute investment advice, a recommendation to buy or sell, or a solicitation to trade any financial instrument. Cryptocurrencies are highly volatile and risky assets. Always conduct your own research (DYOR) and consult a licensed financial advisor before making any investment decision.