
The digital asset ecosystem is undergoing a period of structural transition of rare intensity in June 2026. Bitcoin (BTC), the undisputed barometer of global crypto market liquidity, finds itself at a crossroads: on one side, a prolonged deterioration of its technical structure in the short and medium term; on the other, a complex reconfiguration of its macroeconomic and institutional fundamentals. After reaching an all-time high of $126,000 in October 2025, the asset suffered a massive distribution phase followed by a brutal correction of approximately 50%, now trading in a compression zone between $60,000 and $67,000.
1. The Macroeconomic Environment: The Fed Maintains Its Restrictive Stance
Bitcoin’s valuation, as a non-yielding asset, is intimately linked to global liquidity conditions and the risk-free cost of capital. The Federal Reserve’s recent decisions have fundamentally altered the risk profile of digital assets for the second half of 2026.
1.1. The June 2026 FOMC Meeting: « Higher for Longer »
At its pivotal meeting on June 17, 2026, the Federal Open Market Committee (FOMC), under new chairman Kevin Warsh, voted unanimously (12-0) to maintain the federal funds rate target range between 3.50% and 3.75%. This marks the fourth consecutive hold meeting, anchoring the U.S. economy in a prolonged « higher-for-longer » monetary policy.
1.2. The Dot Plot Shock: Another Rate Hike on the Horizon
The true systemic shock does not lie in the rate hold itself, but in the drastic revision of economic projections (Dot Plot). Nine of eighteen FOMC officials now project at least one additional 25 basis point hike before end-2026, pushing the median projection from 3.4% (March) to a hawkish 3.8% (June). PCE inflation was revised sharply upward from 2.7% to 3.6%, with Core PCE now expected at 3.3%. Faced with this complex tableau, Kevin Warsh opted to abandon traditional « forward guidance » in favor of a reactive, data-dependent approach — generating a significant uncertainty premium that weighs heavily on risk assets.
| Target Period | Median Projection (March 2026) | Median Projection (June 2026) |
|---|---|---|
| End-2026 | 3.4% | 3.8% |
| End-2027 | 3.1% | 3.6% |
| Long Term | 2.9% – 3.5% | 3.0% – 3.5% |
1.3. Direct Impact on Bitcoin: The June 18th Rejection
Bitcoin has historically displayed a pronounced inverse correlation with U.S. dollar strength (DXY) and real bond yields. On June 18, 2026, in the immediate wake of the Fed’s statements, BTC dropped from its local high of $66,315 to test the critical support at $62,000, a severe intraday decline of 4%. The gravity of this macroeconomic pressure even overshadowed a geopolitically positive announcement — a U.S.-Iran interim agreement reopening the Strait of Hormuz and pushing crude oil prices toward $75.
2. Institutional Dynamics: Liquidity Tensions and Ecosystem Reconfiguration
2.1. The STRC/SATA Affair: The First « Stress Test » of Digital Credit
June 2026 will be remembered as the stage for an unprecedented event in the history of crypto-backed corporate finance. Perpetual preferred shares issued by Strategy (STRC) and Strive (SATA) — instruments designed to behave like stable high-yield bonds — suffered a massive dislocation on June 18th. STRC, theoretically anchored at $100 par value, plunged to an intraday low of $82.50, closing at $88.59. SATA fell into the low $90s.
Strive CEO Matt Cole called the episode the « hardest day in the history of digital credit. » The crash was diagnosed as a « leverage flush »: restricted liquidity in these niche markets, combined with Bitcoin’s underlying volatility, triggered a cascade of margin calls and forced liquidations. This event exposes the deep systemic risks hidden within the crypto credit infrastructure.
2.2. The Saylor Signal and ETF Exhaustion
The STRC dislocation was compounded by a psychologically devastating announcement: Michael Saylor sold 32 bitcoins (≈ $2.5M) in early June — the first time Strategy had parted with any reserves since the crypto winter of 2022. Though infinitesimal relative to Strategy’s total treasury, this signal triggered a loss of confidence, sending the company’s common stock down approximately 30% for the month.
Meanwhile, U.S. spot Bitcoin ETFs — which had catalyzed the rally to $126,000 in 2025 — are showing signs of severe exhaustion: $2.3 billion in net outflows in May 2026. Adding pressure, programmatic token unlocks exceeding $735 million in altcoin assets are scheduled for late June, mechanically draining available liquidity from the ecosystem.
2.3. A Structural Counterweight: Japan’s Sovereign Adoption
A long-term structural bright spot emerged from Asia: on June 21, 2026, Japan’s National Business Corporate Pension Fund announced an official allocation of 1% of its assets under management to cryptocurrencies. This sovereign-level signal provides crucial institutional legitimacy and could catalyze similar moves by pension funds worldwide.
3. The Quantum Threat: A Long-Term Existential Risk
Research by Google Quantum AI now estimates that a quantum attack sufficient to break Bitcoin’s ECDSA cryptography would require fewer than 500,000 qubits and could be executed in a matter of minutes — a spectacular downward revision from previous industry projections. The vulnerability is not uniform: it specifically targets addresses that have exposed their public key on-chain. More than one-third of Bitcoin’s total circulating supply has already done so, most notably Satoshi Nakamoto’s original trove of approximately 1.1 million BTC (valued at ~$70 billion).
Changpeng Zhao (CZ) has controversially proposed freezing dormant, vulnerable BTC via a hard fork (BIP-361) should those coins remain unmoved after a critical future software update. While this proposition directly violates Bitcoin’s foundational decentralization principles, the technological threat demands structural consideration — and weighs measurably on the long-term sentiment of the most risk-averse institutional actors.
4. Multi-Timeframe Technical Analysis
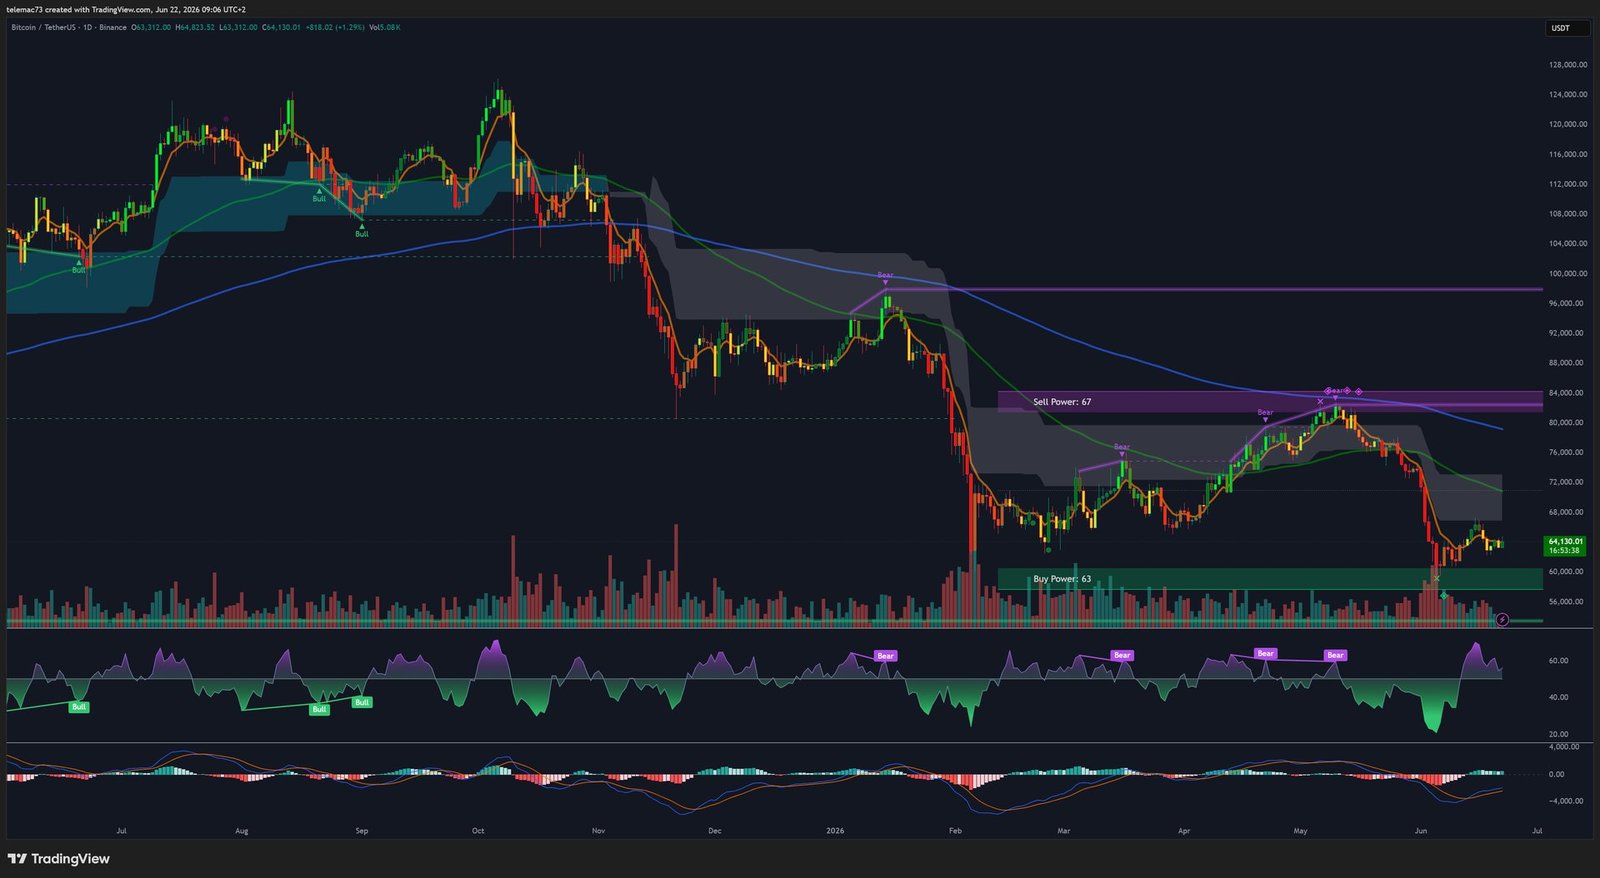
4.1. Daily Chart (1D): Massive Distribution and Primary Bearish Trend
The daily chart illustrates the formation of a monumental top at $126,000 in October 2025, a structure resembling a double top or an asymmetric head-and-shoulders pattern. The subsequent correction halved the asset’s market cap, pulling it toward the current $64,130 level. The Ichimoku system is unequivocal: price trades deeply below the Kumo (cloud), which itself thickens and tilts downward, confirming a primary bearish trend fully controlled by supply forces. A macro-scale daily « Death Cross » sealed the exodus of trend-following algorithmic capital.
A notable nuance: the daily MACD histogram shows a deceleration of bearish momentum (bars fading from bright red to pink), and the RSI at 43.28 is forming a bullish divergence — suggesting a gradual exhaustion of institutional sellers.
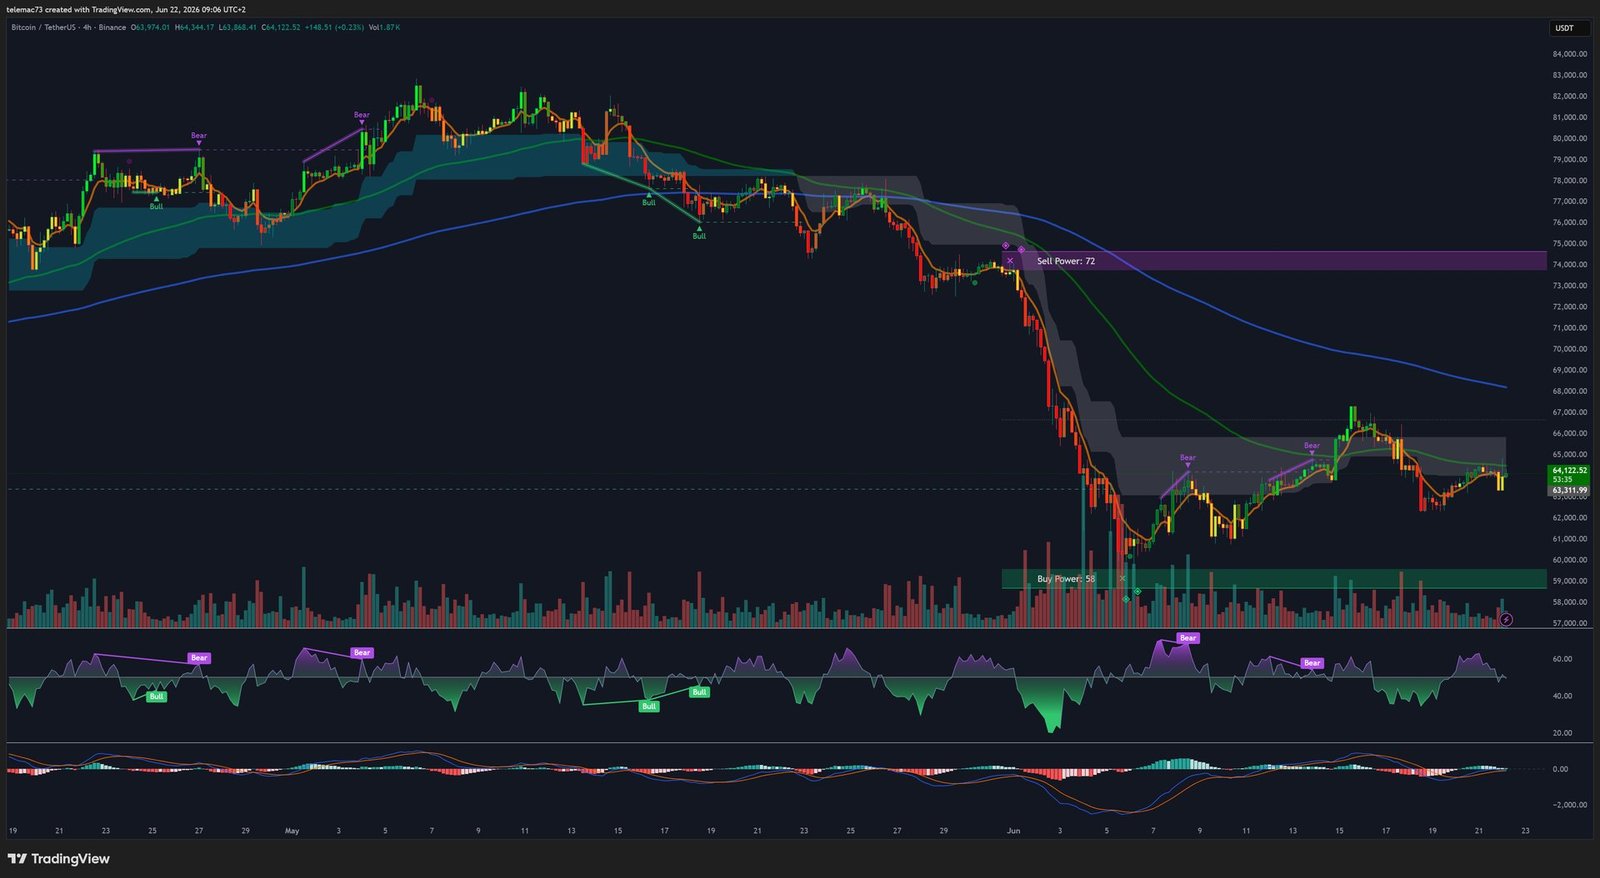
4.2. 4-Hour Chart (4H): Bear Flag and the EMA Glass Ceiling
The 4H chart reveals the anatomy of a bearish continuation flag (bear flag). Following a devastating impulse leg from the $73,000–$74,000 range down to the $59,000 abyss, price is laboriously consolidating in a narrow ascending channel. This recovery attempt is slamming into a dense EMA cluster between $64,050 and $64,970, acting as an implacable dynamic resistance.
The 4H RSI oscillates erratically around 50 — neutrality under resistance that is statistically a precursor to a resumption of the primary bearish trend. Polarity has flipped: the macro triangle’s former support has become the new ceiling.
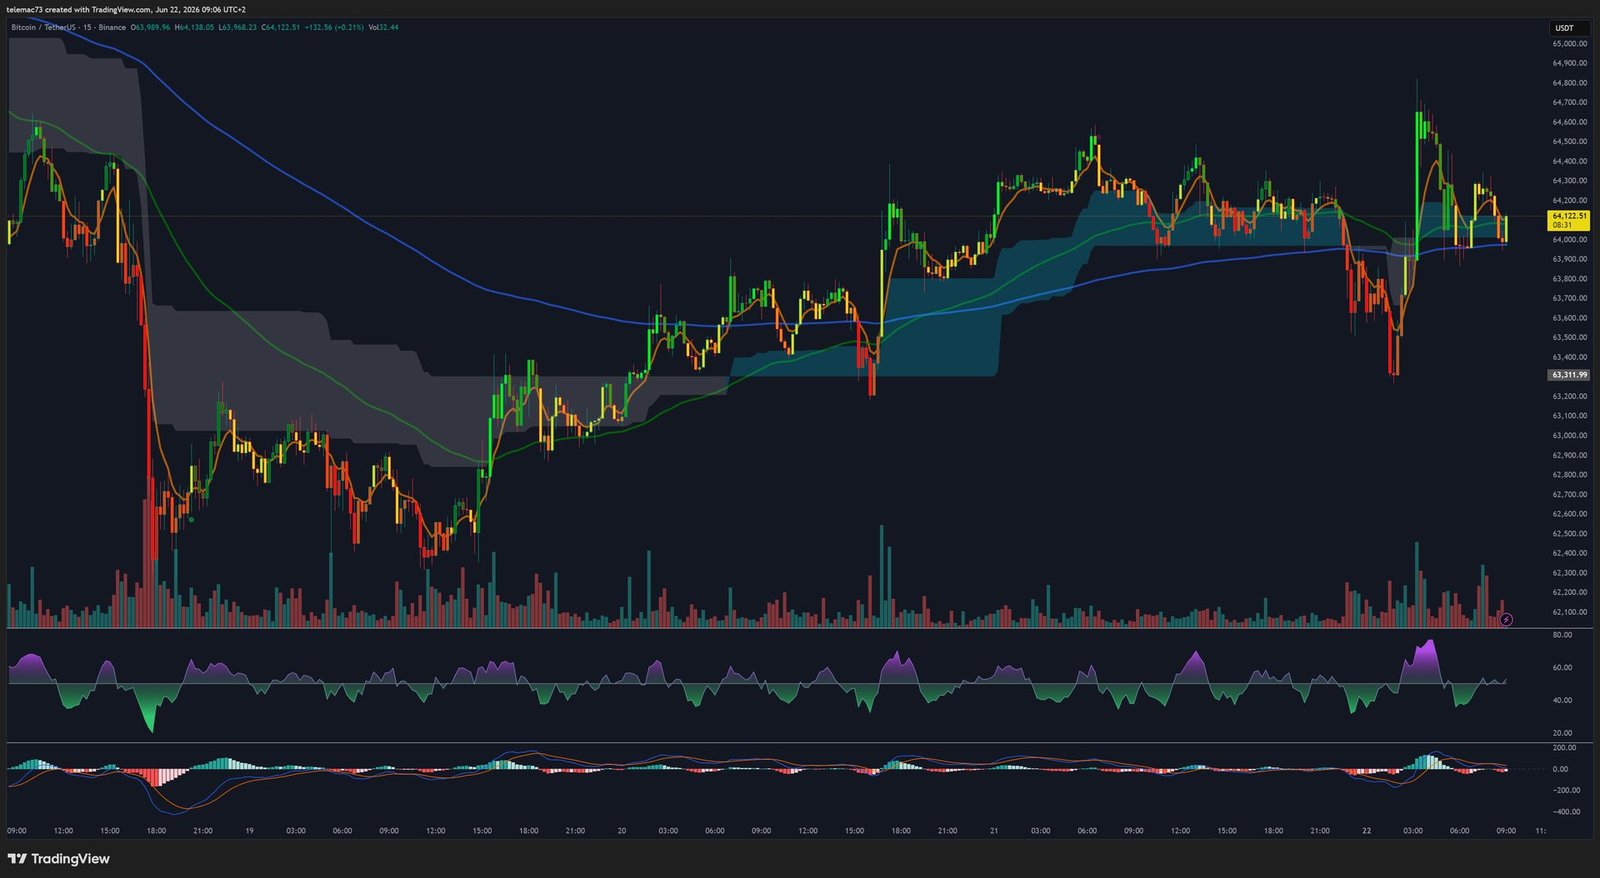
4.3. 15-Minute Chart (15m): Indecisive Microstructure
The 15-minute chart provides a visceral view of high-frequency algorithmic behavior. Price action is characterized by extreme choppiness, repeatedly slicing through the 15m Kumo — a hallmark of a range-bound, directionless environment. Symmetrical triangles form and break rapidly, while short-term EMAs generate ephemeral golden and death crosses in quick succession.
The 15m MACD oscillates around zero with a slightly red histogram, and the RSI is cooling down from overbought territory (>70) back toward neutrality — a failure to maintain bullish momentum in the face of overhead resistance.
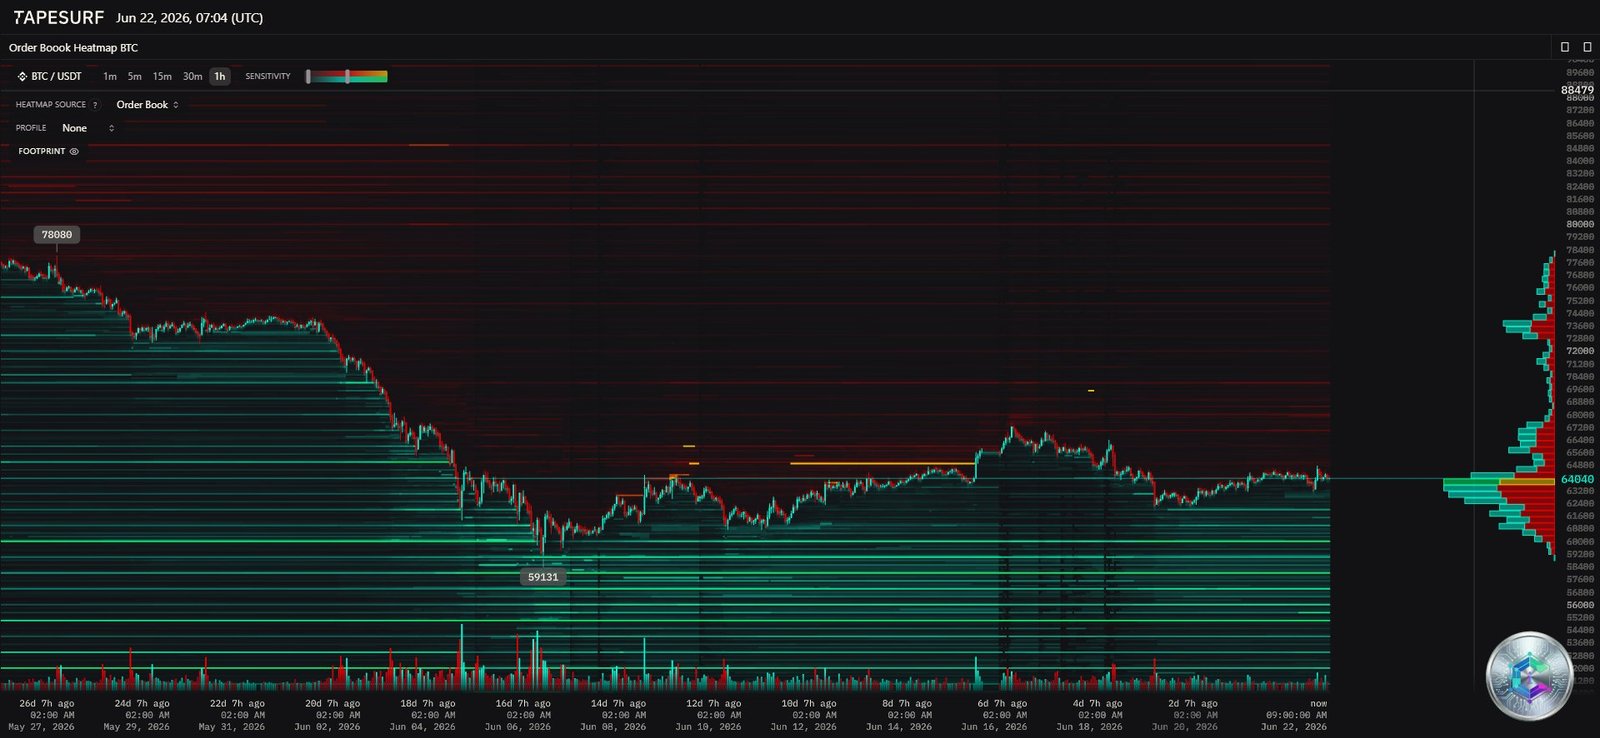
4.4. Liquidity Heatmap: The Order Book Topography
The order book Heatmap (source: Tapesurf) reveals the hidden intentionality of market makers and institutional whales. Colossal buy-side liquidity walls are stacked between $56,000 and $60,000, with a recent major bounce anchored at the precise level of $59,131. The Volume Profile’s Point of Control (POC) sits in the $64,000–$65,000 range, acting as a zone of intense price friction.
On the supply side, multiple layers of sell-side liquidity accumulate from $65,000 onward, densifying dramatically between $67,000 and $70,000, culminating in an insurmountable wall near $72,000. This asymmetric order book topography confirms that the path of least resistance remains statistically oriented to the downside.
5. Quantitative Mapping of Key Technical Levels
5.1. Major Resistance Levels
| Level (USD) | Type | Technical Confluence |
|---|---|---|
| $64,050 – $64,970 | Primary Pivot Resistance | 4H EMA cluster, distribution POC, upper bound of bearish channel |
| $64,745 | Volatility Resistance (2σ) | 2 standard deviations above short-term mean |
| $65,104 | Extreme Resistance (3σ) | Would mechanically trigger a short squeeze if breached |
| $67,000 | Macro-Structural Resistance | 44% Fibonacci retracement, bearish bias invalidation point |
| $73,200 – $74,000 | Institutional Rejection Zone | « Sell Power: 72 » block, former triangle support turned resistance |
5.2. Critical Support Levels
| Level (USD) | Type | Technical Confluence |
|---|---|---|
| $63,600 – $63,980 | Micro-Structure Support | Underside retest of broken 1H channel, algorithmic defense |
| $62,000 | Psychological Support | Post-FOMC intraday low, surface liquidity vulnerable to shocks |
| $61,556 | Volatility Support (2σ) | 2 standard deviations below mean, confluence with Stochastic ~20% |
| $59,000 – $60,000 | Definitive Systemic Floor | « Buy Power: 63/58 » blocks, Heatmap order wall at $59,131, unbreached since 2024 |
| $54,000 – $55,000 | Theoretical Bear Target | Geometric projection of the broken symmetrical triangle |
| $47,500 – $48,000 | Macro-Cyclical Floor | August 2024 low, historical institutional accumulation zone |
6. Market Scenario Synthesis for Q3–Q4 2026
🔴 Dominant Bearish Scenario: Capitulation and Liquidity Shock
The primary scenario, dictated by the path of least resistance identified through the Heatmap and Dow Theory, favors a continuation of bearish erosion. As long as Bitcoin remains trapped beneath the Daily and 4H Ichimoku clouds, any rally will be sold by mean-reversion algorithms. A sustained Fed hold through 2027 would make leveraged long positions untenable, triggering a cascade of liquidations below $62,000 and opening the trapdoor toward $59,000–$60,000. A breach of this systemic floor would trigger institutional panic, with mathematical targets at $55,000 and subsequently $48,000.
🟢 Bullish Invalidation Scenario: Brute Force Recovery
Invalidating the bearish thesis demands a colossal display of buying power: a clean breakout above the $64,000–$65,000 supply zone and robust consolidation above the golden Fibonacci level of $67,000. Such a move would force heavily short-positioned funds to cover, triggering an explosive short squeeze. Fundamentally, Halving cycle theory suggests the true macro bottom may form in Q3–Q4 2026, possibly after a final liquidity sweep toward $50,000, laying the groundwork for the next bull cycle.
Bottom Line: The weight of technical indicators, the hostility of the macroeconomic environment, and the scars of recent institutional dislocations all dictate a strict capital preservation approach. A defensive posture is warranted until the $67,000 fortress is decisively reclaimed and held on solid foundations.
⚠️ Disclaimer: This article is written for educational and informational purposes only. It does not constitute investment advice, a recommendation to buy or sell digital assets, or an inducement to take financial positions. Cryptocurrency markets are extremely volatile and carry significant risk of capital loss. Please consult a qualified financial advisor before making any investment decisions.