
📊 Market Overview: Sentiment & Price Dynamics
The digital asset market is undergoing an unprecedented phase of transformation in mid-February 2026. With Bitcoin trading around $68,827, the global financial ecosystem is witnessing a growing disconnect between retail investor sentiment — marked by extreme fear (Fear & Greed at 12) — and institutional capital flows showing historic resilience.
While Ethereum suffers declines of around 5.22% and assets like XRP and Dogecoin record massive weekly losses, Bitcoin maintains a 56.73% dominance over a total market cap of $2.43 trillion. This dynamic suggests a flight to quality, where Bitcoin reassumes its safe-haven role within the crypto ecosystem.
The technical rebound on February 15th — which briefly pushed the price above $70,000 following better-than-expected US inflation data — could not be sustained on Monday, February 16th (Presidents’ Day in the US), highlighting the absence of institutional liquidity relay and leaving the price drifting toward immediate supports.
| Indicator | Value / Status | Context |
|---|---|---|
| BTC/USD Price | $68,827 | -1.13% (24h) |
| Total Market Cap | $2.43T | Increased volatility |
| BTC Dominance | 56.73% | Upward trend |
| 24h Volume | $121.76B | Concentrated liquidity |
| Fear & Greed Index | 12 — Extreme Fear | Potential contrarian signal |
| Coinbase Premium | Negative (-$167.8) | Institutional stress peak |
📈 Multi-Timeframe Technical Analysis
A combined study of the 15-minute, 4-hour, and daily charts reveals a market structure where micro-liquidity dictates short-term movements, while institutional supply and demand zones frame the underlying trend.
⏱️ Daily Chart (1D): Post-Capitulation and Structural Base
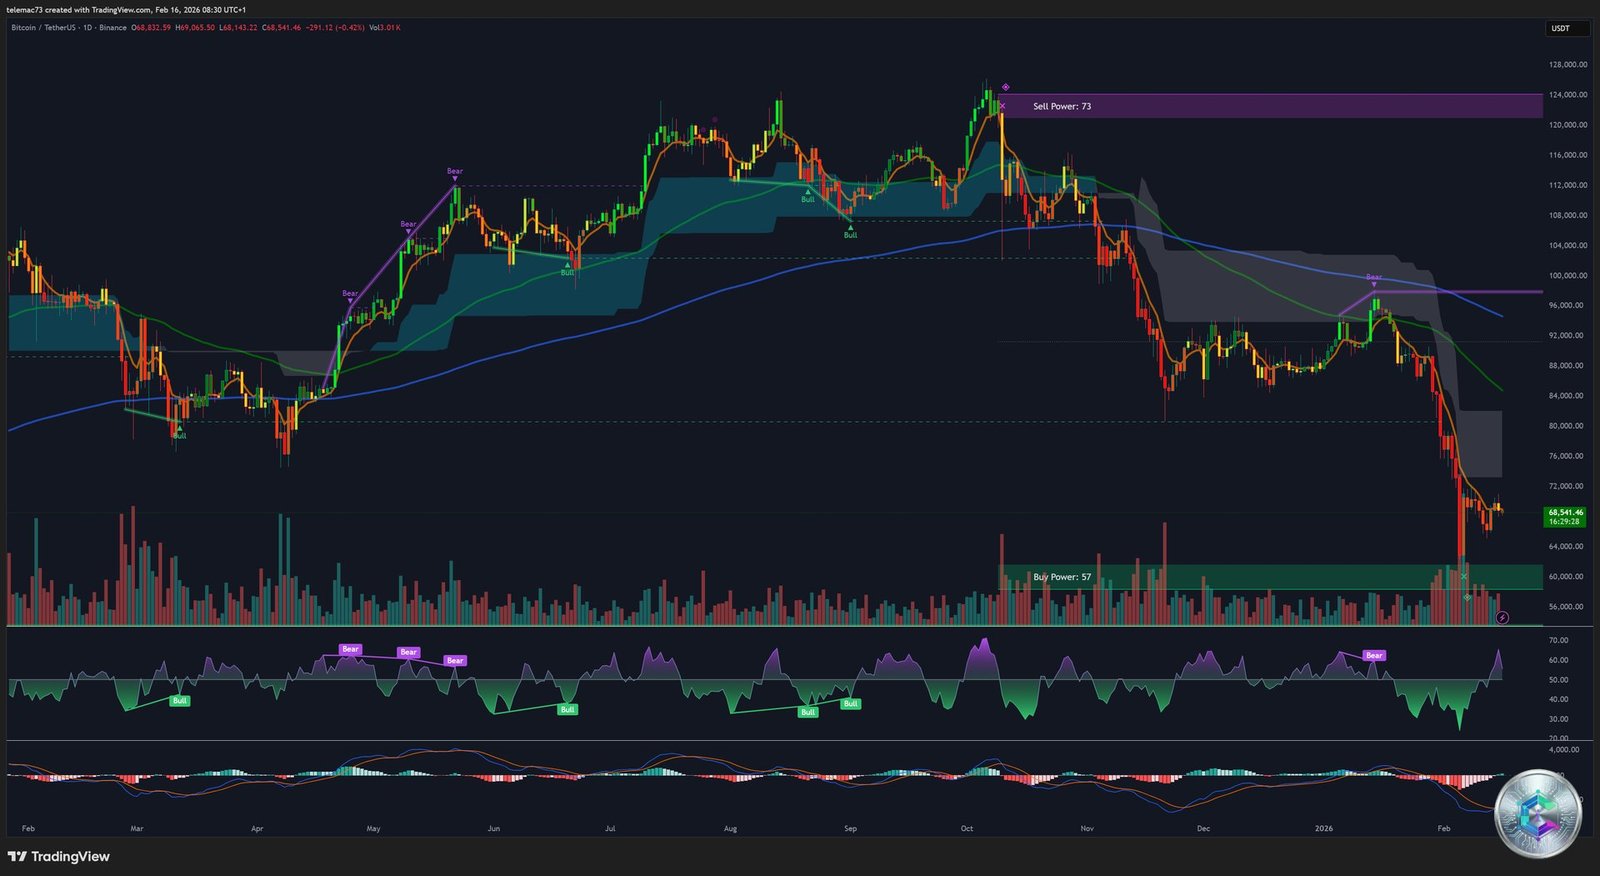
The daily chart illustrates the full extent of Bitcoin’s correction from its all-time high in October 2025, set above $120,000. The drop was severe, marked by a series of bullish structure breaks down to the critical test of the $60,000 zone in early February 2026. This area, identified by the Buy Power indicator (score of 57), acted as a major liquidity barrier.
The recent rebound toward $70,000 suggests the formation of a local bottom. However, the Sell Power indicator remains active in the $114,000 zone (score of 73), indicating the path to new highs remains congested with significant institutional distribution zones. The weekly close above $70,000 was a strong signal, but the return below that level on February 16th underscores the fragility of the current recovery.
🕓 4-Hour Chart (4H): Pivot and Equilibrium Zones
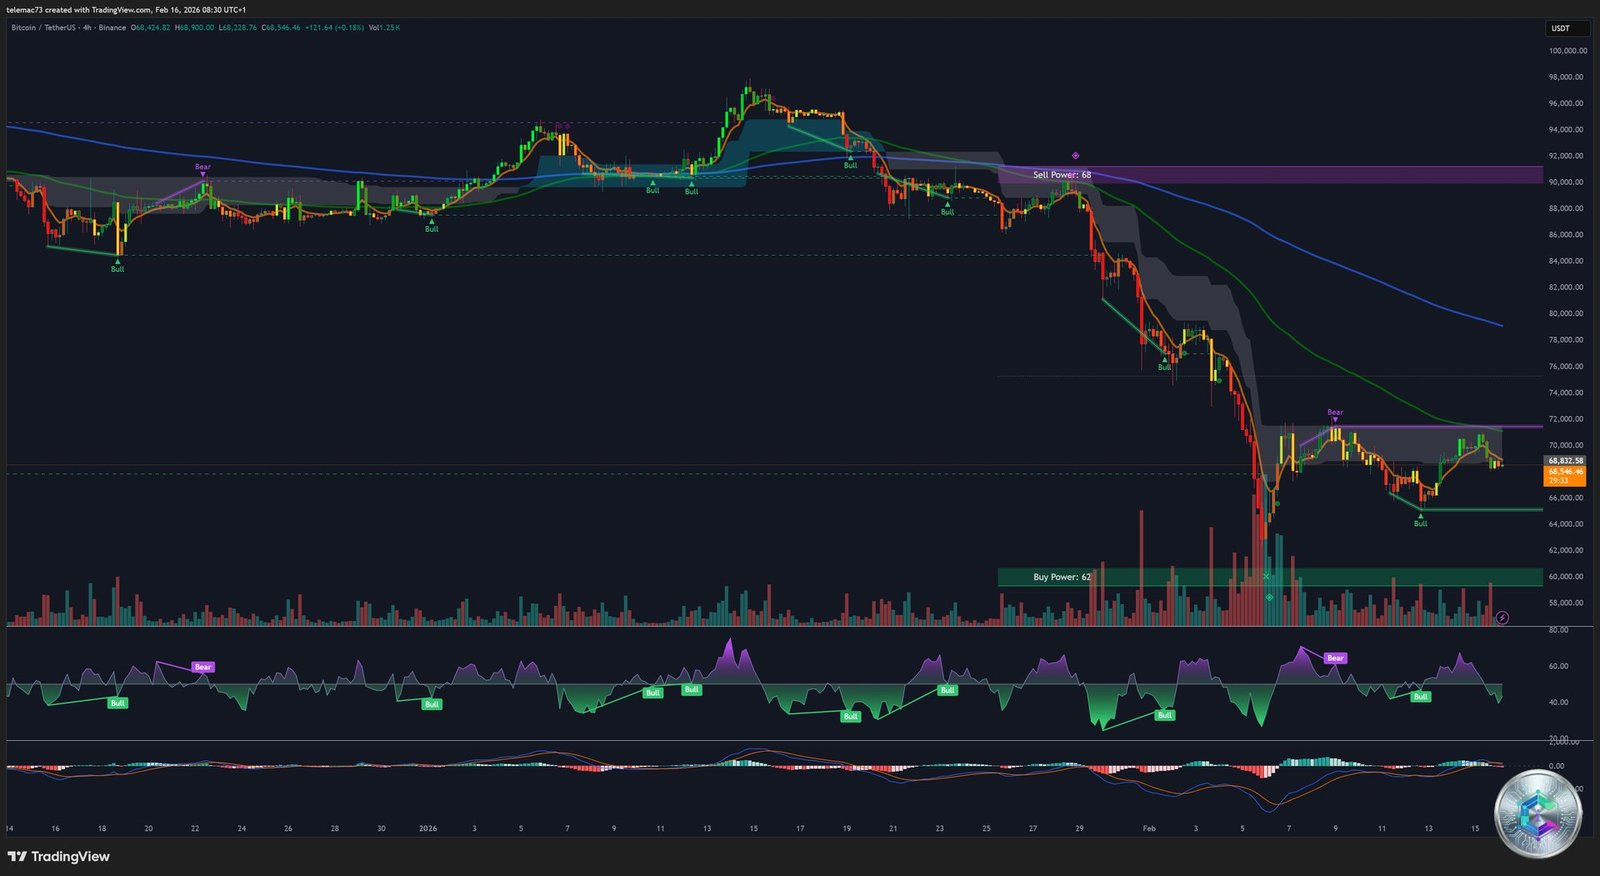
On the 4-hour timeframe, Bitcoin is oscillating within a consolidation channel after bouncing off the $64,000 technical support. The $68,000–$69,000 zone appears to be the central pivot for the week. The Sell Power indicator on 4H is positioned at 58 in the $91,000 region, while Buy Power at 52 supports the $60,000 area.
The 4H RSI shows tentative bullish divergences, suggesting the bearish momentum is fading. However, the absence of significant buying volume during the Asian session on February 16th prevents an impulsive breakout above the $70,000 resistance.
⚡ 15-Minute Chart (15M): Scalping Dynamics & Intraday Liquidity
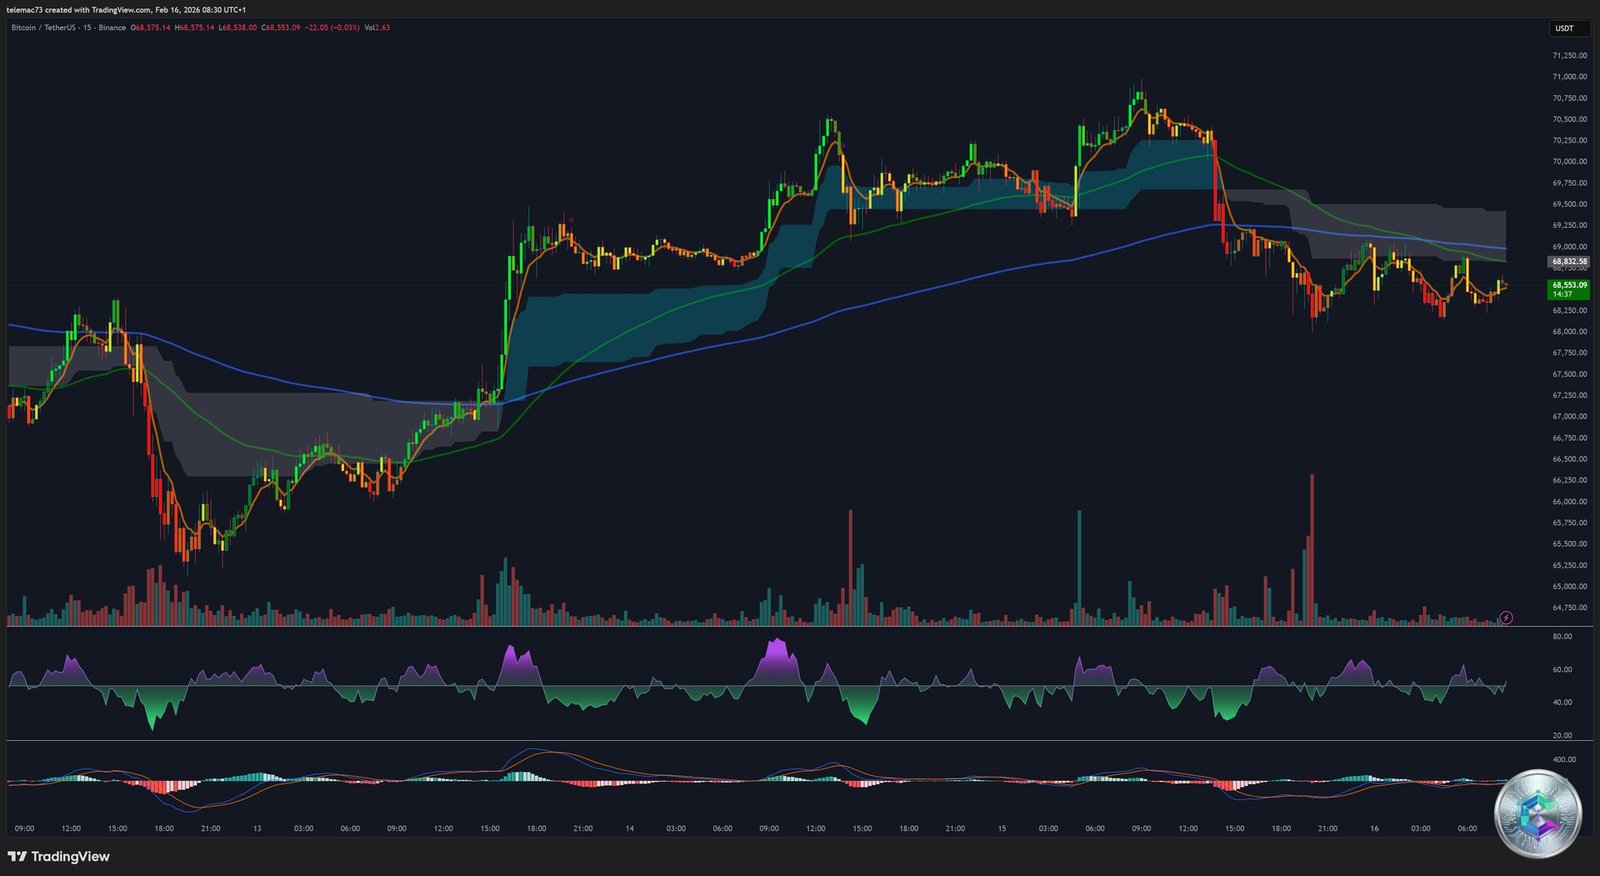
At the very short-term level, price action is erratic. Bitcoin shows signs of volatility compression, typical of periods when US markets are closed for a public holiday. Short-term clouds (EMA 9/20) serve as immediate dynamic resistance around $68,850.
A series of Buy Snorts (aggressive buying spikes) on the 15M chart fail to generate sustained upward continuation — a sign of passive absorption by limit sell orders positioned just above the current price. Liquidity is concentrated around $68,340, a level that must hold to prevent a liquidation cascade toward $67,000.
🔥 Heatmap Analysis & Order Flow
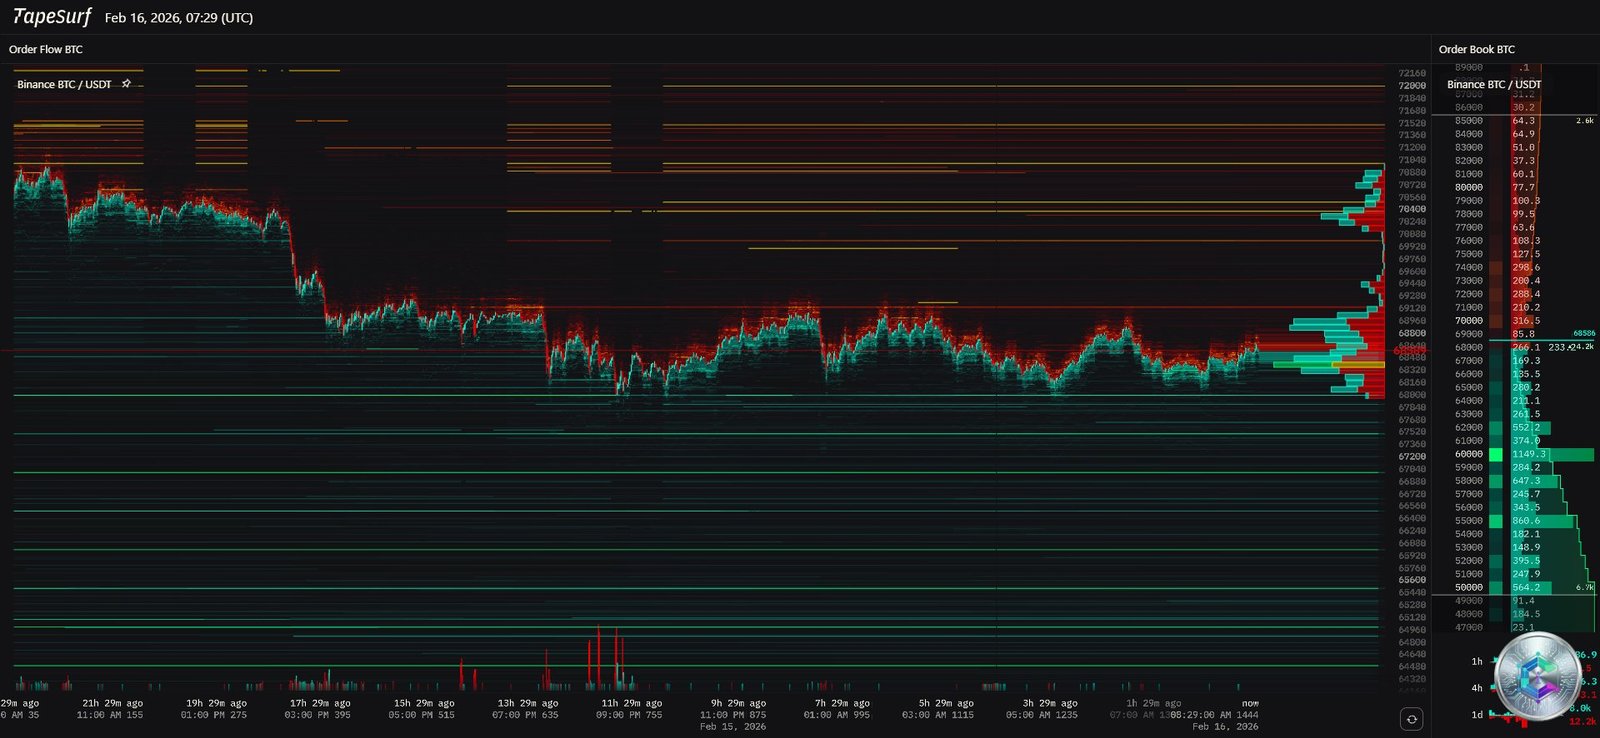
The heatmap and order flow tools (TapeSurf) provide a critical layer of information on Smart Money positioning. Unlike standard price charts, the heatmap reveals market participants’ intentions before transactions are executed.
🗺️ Liquidity Mapping & Order Walls
The heatmap shows a massive concentration of buy orders (bids) in the $64,000–$67,000 zone. These areas — represented as bright horizontal lines (neon green / turquoise on TapeSurf) — act as price magnets. The $67,200 level displays an unusual limit order density, suggesting market makers are actively defending this threshold.
On the sell side (asks), resistance is particularly dense between $70,000 and $72,000. Layers of sell-side liquidity thicken as prices approach $75,000. This imbalance places the market in a ping-pong phase between two major liquidity zones, with a slight edge for buyers who are patiently accumulating amid extreme fear.
💧 Volume Bubble Analysis & Absorption
Volume « bubbles » on TapeSurf visualize market orders. An accumulation of red bubbles near a green buy wall without further price decline is a classic absorption signal. This is precisely what is happening around $68,000: aggressive sellers are hitting the order book, but institutional limit orders are absorbing the supply, preventing a freefall.
| Price Level | Liquidity Type | Zone Strength | Technical Comment |
|---|---|---|---|
| $75,000 | Resistance / Asks | ⛔ Very Strong | Major psychological and technical threshold |
| $72,000 | Resistance / Asks | 🔴 Strong | Sell-side liquidity cluster (Heatmap) |
| $70,000 | Resistance / Pivot | ⚠️ Critical | Trend battleground zone |
| $68,340 | Support / Pivot | 🟡 Intermediate | Current price and intraday support |
| $67,200 | Support / Bids | 🟢 Strong | Institutional accumulation zone (Heatmap) |
| $64,000 | Support / Bids | 🟢 Major | Rebound structure base |
| $60,000 | Support / Bids | 🟢 Critical | Cycle low and capitulation threshold |
🏦 Institutionalization & ETF Flows: The 2026 Turning Point
The year 2026 marks a structural shift in Bitcoin demand. Spot Bitcoin ETFs are no longer mere speculative instruments — they have become genuine mass adoption vehicles for traditional institutional portfolios.
📥 Record Performance & Supply Absorption
In just two trading days at the start of 2026, US ETFs attracted over $1.2 billion in net inflows. BlackRock’s iShares Bitcoin Trust (IBIT) remains the sector leader, with daily inflows sometimes exceeding $600 million. This buying power is even more remarkable given that 2025 ended with only $21.4 billion in total inflows.
The 2026 projection, according to analyst Eric Balchunas, could reach between $20–$70 billion in net inflows, or even $150 billion if the current pace holds. This demand creates a supply shock: ETFs absorb far more Bitcoin than daily mining production, mechanically reducing available exchange liquidity.
🏛️ Wall Street Giants Enter the Arena
A major signal was sent in February 2026 when Morgan Stanley filed to launch Bitcoin and Solana ETFs. With $8 trillion in assets under management, opening its distribution channels to Bitcoin fundamentally changes the landscape. Meanwhile, Bank of America now allows its 15,000 financial advisors to recommend Bitcoin allocations between 1% and 4% of total assets.
| 2026 ETF Scenario | Estimated Net Flows | Price Impact (USD) | Probability |
|---|---|---|---|
| 🚀 Current Pace (Optimistic) | $150B | > $140,000 | Low |
| 📊 Analyst Consensus | $20–$70B | $100,000–$120,000 | High |
| 🐻 Bear Scenario (Net Outflows) | < $10B | < $60,000 | Moderate |
🌐 Macroeconomic & Monetary Context
📉 Inflation & Rate Expectations
The February 13, 2026 CPI report showed inflation at 2.4% year-on-year, down from 2.7% in December. This faster-than-expected decline rekindled hopes of monetary easing. Prediction markets now place a 23% chance of a rate cut as early as April 2026.
However, Fed discourse remains divided. Members like Michelle Bowman and Raphael Bostic maintain a hawkish stance, fearing an inflation rebound from tariff-related pressures, while others advocate for cuts of up to 100 basis points in 2026. This uncertainty creates saw-tooth volatility in Bitcoin, which increasingly behaves like a high-beta asset correlated to tech stocks.
📅 Key Macroeconomic Events — Week of February 16th
- Monday, Feb 16: Presidents’ Day — US markets closed. Increased risk of price manipulation on offshore platforms and reduced institutional liquidity.
- Wednesday, Feb 18: Release of January FOMC Minutes. Investors will look for clues about the Fed’s real willingness to cut rates before summer.
- Friday, Feb 20: Release of Q4 2025 GDP and the Core PCE index (the Fed’s preferred inflation gauge). A reading below the expected 2.8% could push Bitcoin toward the $75,000 resistance.
🌍 Geopolitical Factors & Digital Sovereignty
🧱 The BRICS Bloc & De-Dollarization
The BRICS bloc is intensifying efforts to build a multipolar financial system. In February 2026, these nations are exploring cryptocurrency use to bypass US dollar dominance in international trade. Bitcoin, through its political neutrality and mathematical scarcity, is emerging as a serious candidate to serve as a neutral settlement asset.
Brazil’s announcement of a National Bitcoin Reserve project — targeting the acquisition of 1 million BTC over five years — is a historic milestone. If adopted, this would create permanent sovereign demand disconnected from US economic cycles, potentially triggering a domino effect among emerging nations (sovereign FOMO).
⚖️ The S&P 500 Correlation: The Digital Gold Paradox
Paradoxically, while the « digital gold » thesis is championed by BRICS, market behavior in 2026 shows a 0.5 correlation with the S&P 500. The early-February crash — where Bitcoin plunged below $70,000 despite geopolitical uncertainties that should have benefited it — proves the asset is still largely perceived by Wall Street as a tech proxy. Bitcoin will only break this correlation if a major confidence crisis hits the traditional banking system.
🔧 Market Mechanics: Why Did the February Crash Happen?
📐 The Basis Trade Unwind
Since 2024, many hedge funds employed an arbitrage strategy known as the basis trade: buying spot Bitcoin (via ETFs) while simultaneously shorting CME futures to capture the price spread (the premium). By January 2026, this spread had collapsed below 5%, making the strategy less profitable than standard bond yields.
As a result, funds began unwinding positions. This deleveraging triggered massive ETF sell-offs, forcing BlackRock and Fidelity to sell Bitcoin on the spot market. The cycle was amplified by a capital flight from stablecoins (Tether/USDC), reducing global liquidity by $14 billion over three months. The drop below $70,000 was the breaking point where institutional stop-loss algorithms took over.
⚙️ The CME’s Dominant Role
The Chicago Mercantile Exchange now controls 20–25% of global Bitcoin derivatives volume. This means Bitcoin’s price is no longer determined solely on the blockchain, but in Chicago’s trading rooms. Strict regulations and 50% margin requirements on the CME paradoxically stabilized the market during the crash, but also limit the capacity for an explosive recovery without a clear Fed signal.
🎯 Strategic Synthesis: Supports, Resistances & Scenarios
| Level Type | Price (USD) | Technical / Fundamental Justification |
|---|---|---|
| ⛔ Resistance 3 | $120,000 | All-Time High (ATH) — October 2025 |
| 🔴 Resistance 2 | $90,000 | Sell Power zone 4H — January 2026 high |
| 🟠 Resistance 1 | $75,000 | Major liquidity zone (Heatmap) |
| ⚡ Psychological Pivot | $70,000 | Market sentiment tipping point |
| 🟡 Support 1 | $67,200 | Buy wall identified on TapeSurf (Heatmap) |
| 🟢 Support 2 | $64,000 | Top of daily Buy Power zone |
| 🟢 Support 3 | $60,000 | Rebound structure base — capitulation threshold |
🚀 Bullish Scenario
To validate a recovery toward $90,000, Bitcoin must convincingly close above the $70,000 pivot with a return of US ETF volume. The PCE data on Friday, February 20th is the potential catalyst. If inflation is confirmed lower, expect rapid absorption of sell-side liquidity between $72,000 and $75,000, opening the path to a test of the upper Sell Power zones.
🐻 Bearish / Consolidation Scenario
If Bitcoin fails to reclaim $70,000 before Wednesday evening (FOMC Minutes), the risk of a return to $64,000 or $60,000 supports increases. A break of $67,200 (the current buy wall on the heatmap) would be the first alarm signal. In this case, the market would enter a lateral lethargy phase, awaiting a new catalyst.
💡 Technical Recommendations
Close monitoring of the heatmap (TapeSurf) is paramount. Traders should watch for:
- Bearish signal: Any sudden withdrawal of buy orders at $67,200 could signal institutions are willing to let prices fall to accumulate at better levels.
- Bullish signal: A multiplication of green bubbles (market buys) above $70,500 would confirm buyer commitment for an immediate resistance breakout.
Bitcoin in early 2026 has become a hybrid asset — simultaneously a dollar liquidity barometer and a beacon of international financial sovereignty. Its current structure, though fragile, rests on institutional (ETFs, banks) and sovereign (BRICS) foundations that did not exist in previous cycles. The $60,000–$68,000 zone remains particularly attractive for a long-term outlook, despite the short-term volatility driven by the US macroeconomic environment.
⚠️ Disclaimer
This article is written for educational and informational purposes only. It does not constitute investment advice, nor a recommendation to buy or sell digital assets or any other financial instrument. Cryptocurrency markets are extremely volatile and carry a high risk of capital loss. Any investment should be made after consulting a licensed financial advisor and in accordance with your own risk tolerance. CryptoInfo.ch disclaims all responsibility for financial decisions made based on this content.