


In mid-June 2026, Bitcoin (BTC) is going through one of its most complex phases of the year. While the asset oscillates with marked volatility around the $65,870 zone, three major forces are colliding in real time: a historic geopolitical shock in the Middle East, a massive institutional purge of Spot ETFs, and an unprecedented rotation of capital toward artificial intelligence. This analysis offers a cross-cutting view of the situation, combining the macroeconomic backdrop, institutional capital flows, and a multi-timeframe chart study (daily, 4-hour and 15-minute) of the BTC/USDT pair.
A geopolitical earthquake with immediate monetary repercussions
The most defining event of June is undoubtedly the announcement of a comprehensive peace agreement between the United States and Iran, brokered by a regional diplomatic coalition involving Pakistan, Qatar, Saudi Arabia and Turkey. The official signing is scheduled for June 19, 2026 in Switzerland, following several months of intense military operations across the Middle East.
One of the clauses with the most direct market impact concerns the reopening of the Strait of Hormuz, through which nearly 20% of the world’s oil supply transits. The reaction was immediate: Brent crude tumbled more than 4% at the Asian open, falling below $84, its lowest level since the conflict began. Against this backdrop, gold rose roughly 2% as a residual hedge, while Bitcoin staged a vigorous rebound, fueled by hopes of imported energy deflation and some relief on the global inflation front. BTC climbed out of its lows to reclaim the $65,600 zone.
Kevin Warsh’s Fed, caught between inflation and political pressure
Bitcoin’s nominal trajectory remains tightly linked to US monetary policy. Ahead of the FOMC meeting on June 16-17, 2026, the Federal Reserve — now led by Kevin Warsh — faces a genuine dilemma. Despite pressure from the White House for a swift rate cut, the Consumer Price Index (CPI) has climbed to 4% year-over-year, its highest level in three years, against a still-resilient labor market (unemployment at 4.3%).
The federal funds rate therefore remains in an elevated range of 3.50%-3.75%, with overnight repo operations at 3.75% and reverse repo capped at 3.50%. Goldman Sachs has even revised its projections, now pushing the first rate cuts back to 2027. For Bitcoin, this persistently attractive risk-free yield on US Treasuries represents a major headwind, largely explaining the asset’s inability to durably break away from its highs and its vulnerability to recent pullbacks toward the $60,000 zone.
Institutional flows: the great capital rotation
The historic Spot Bitcoin ETF bleed
Spot Bitcoin ETFs, the main engine of last year’s bull market, have turned into a source of selling pressure. During the first week of June, the US ecosystem suffered net outflows of around $3.4 billion — the worst weekly figure since these instruments launched in January 2024. BlackRock’s IBIT fund was at the epicenter of this move, with nearly $980 million in redemptions over a single week, including a single day of $448 million and a massive dark-pool transaction worth roughly $1.29 billion.
According to Matt Hougan, Chief Investment Officer at Bitwise, this institutional capitulation reflects mechanical risk management amid regulatory and monetary uncertainty rather than a fundamental rejection of Bitcoin. On a more encouraging note, Friday June 12 marked a turning point, with net inflows returning to positive territory at $85.9 million — a sign that the bulk of the institutional purge may be behind us, and that the $60,000 zone is increasingly being viewed by large allocators as an accumulation opportunity.
The rush toward AI and aerospace
A significant portion of the capital that left Bitcoin was absorbed by SpaceX’s spectacular IPO, whose valuation surpassed $2 trillion on its very first trading session. Many funds liquidated highly profitable BTC positions to participate in the offering — even as the IPO filing revealed that SpaceX itself already held 18,712 BTC on its balance sheet, validating the thesis of Bitcoin as a corporate treasury reserve asset.
More broadly, the massive rotation of capital toward AI infrastructure (nearly $400 billion raised over six months, according to Michael Saylor) partly explains the crypto market’s lethargy, with MicroStrategy symbolically selling 32 BTC for the first time since 2022. More than $1.8 billion in derivatives positions were liquidated within 24 hours amid this sector rotation.
The quiet transformation of Bitcoin miners
One of the most structurally significant developments of this period is the strategic pivot of publicly listed mining companies. While BTC declined since the start of the year, the basket of major mining stocks surged more than 56% over the same period, as players such as IREN, TeraWulf, Cipher, Core Scientific and Applied Digital redirected a large share of their contracted power capacity toward high-performance computing for AI — IREN notably signing a multi-billion-dollar deal with Microsoft and a partnership with Nvidia.
This diversification structurally reduces miners’ dependence on the BTC price and, consequently, their need to continuously sell newly mined coins. A significant portion of the network’s historical selling pressure is thus neutralized, potentially forming a genuine liquidity floor should institutional demand return.
Multi-timeframe technical analysis of BTC/USDT
Fundamental analysis takes on its full meaning when confronted with price action. Below is a detailed chart reading across three timeframes — daily, 4-hour and 15-minute — with price hovering around $65,870.
Daily view (1D): a descending consolidation wedge nearing its conclusion
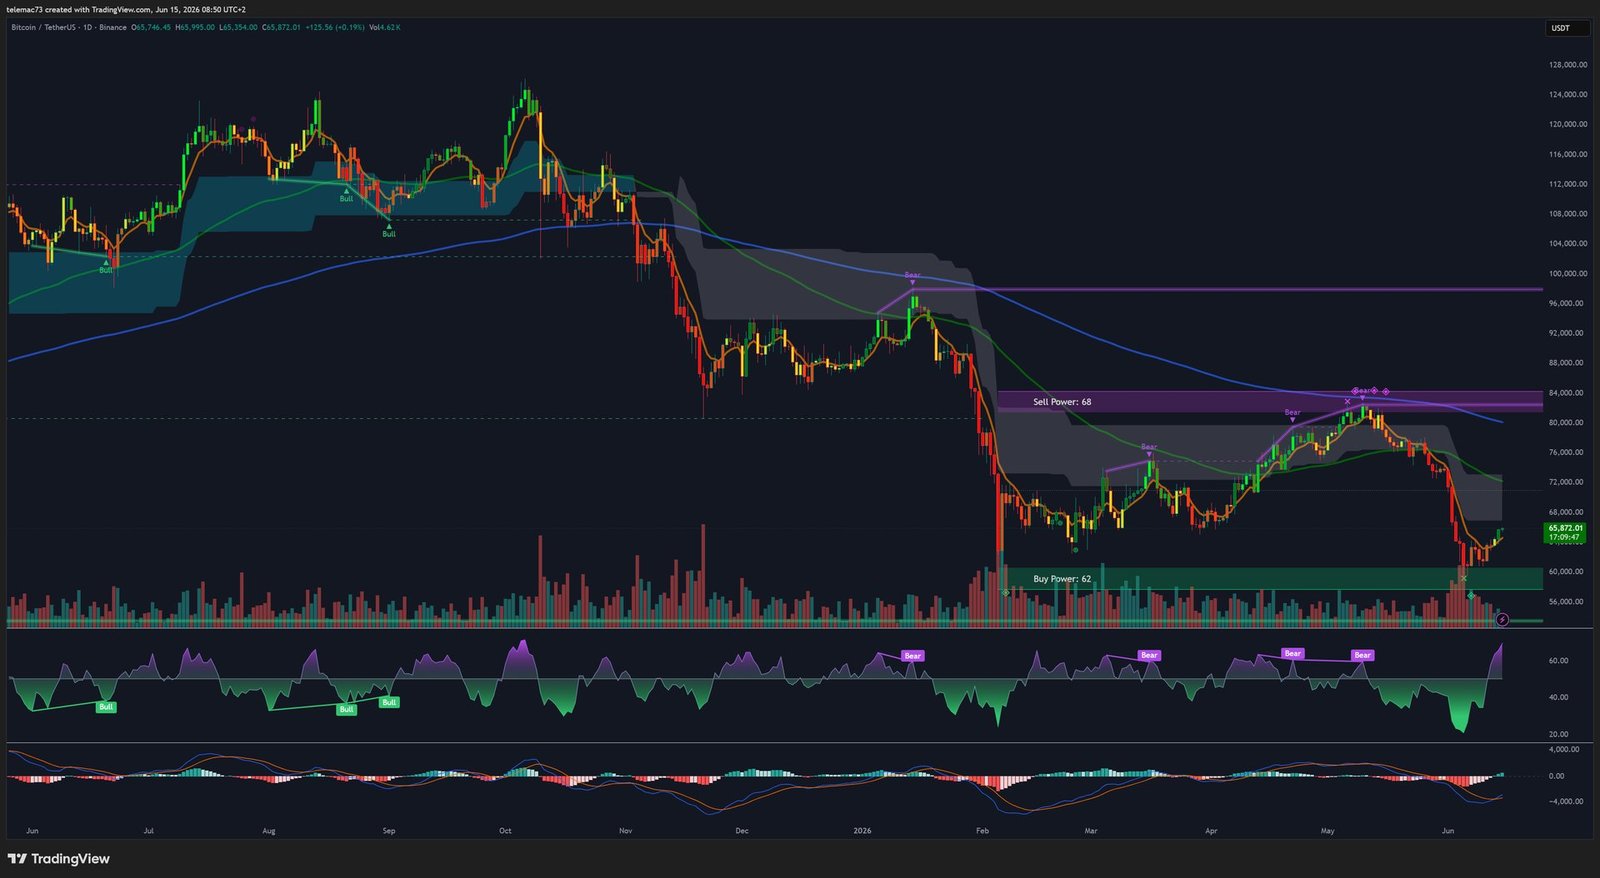
On the daily chart, the market structure remains dominated by a broad descending consolidation wedge inherited from the cycle’s all-time highs. Institutional flow indicators show a massive « Buy Power » green zone around $60,000, confirming this level as a genuine institutional demand zone, while a « Sell Power » zone looms above $84,000, the ceiling of the current cycle.
The 200-day moving average has been trending lower since mid-May and acts as a major psychological resistance. However, the daily RSI has climbed back to around 69, and the MACD histogram’s red bars are clearly shrinking — suggesting a marked deceleration of selling pressure and a possible imminent crossover into positive territory, which would invalidate the bearish bias accumulated over the past month.
4-hour view (4H): the surgical anatomy of a rebound
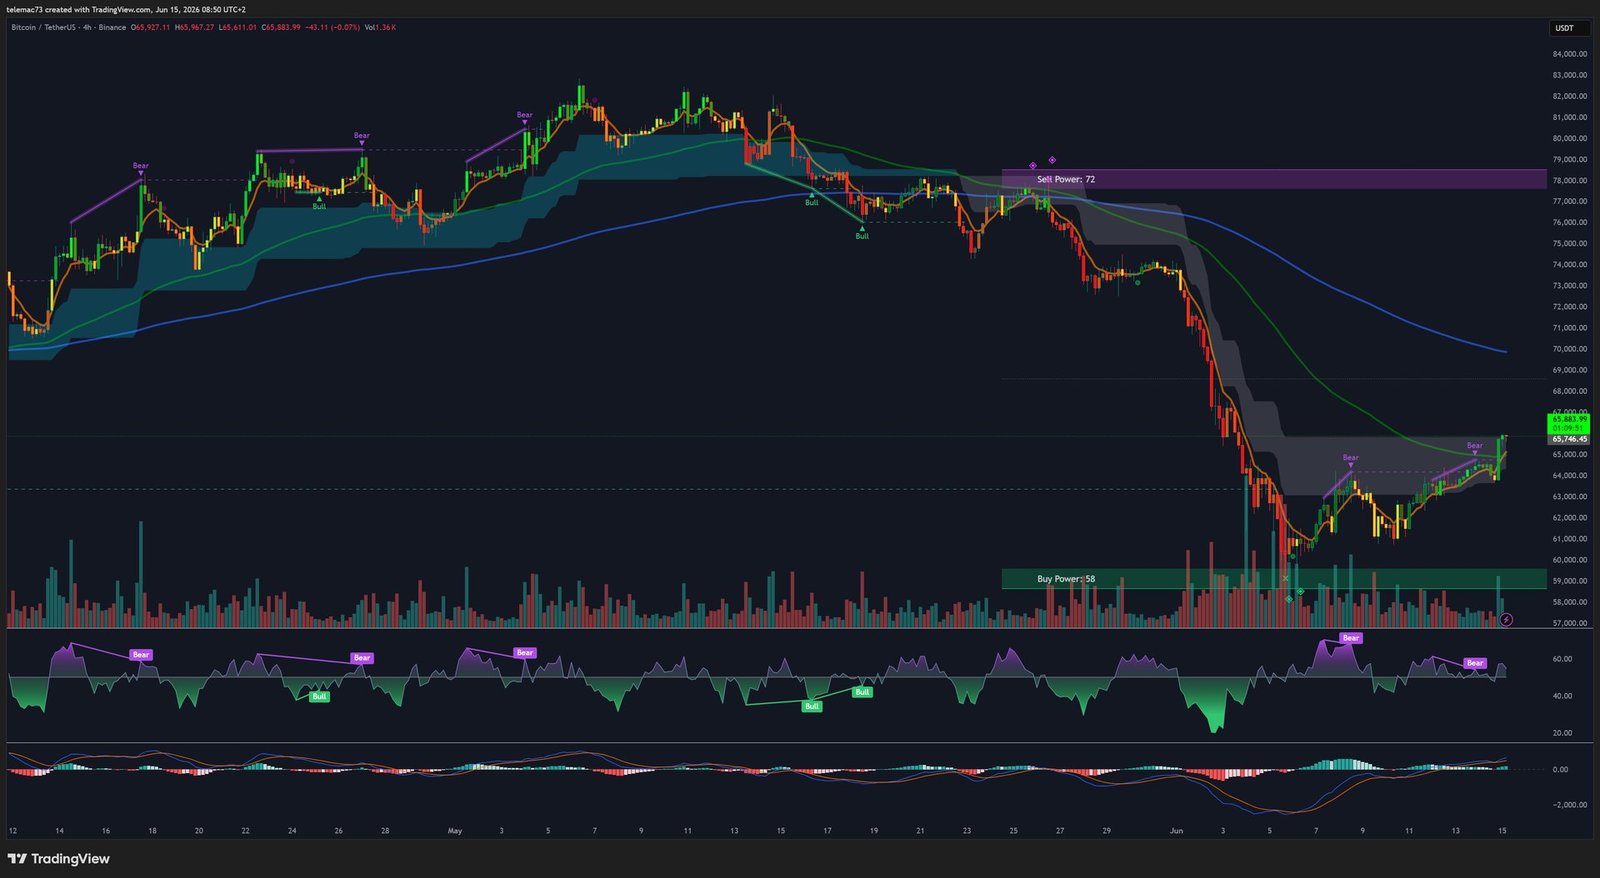
At $65,746, the 4-hour chart reveals the precise anatomy of the recent rebound. A large red capitulation candle plunged into the « Buy Power » zone between $58,500 and $59,000, immediately followed by long lower wicks reflecting aggressive absorption of sell orders by institutional limit orders. The resulting structure resembles an asymmetric double bottom, validating the resilience of this support.
The most instructive element remains the marked bullish divergence on the RSI during the retest of the lows, confirmed by a Golden Cross on the MACD: the fast moving averages crossed above the slow ones, with an expanding green histogram. To the upside, a « Sell Power » zone sits around $78,000 — the next major battleground should the current setup, which resembles a compression triangle (pennant), resolve favorably.
15-minute view (15M): algorithmic overheating after the announcement
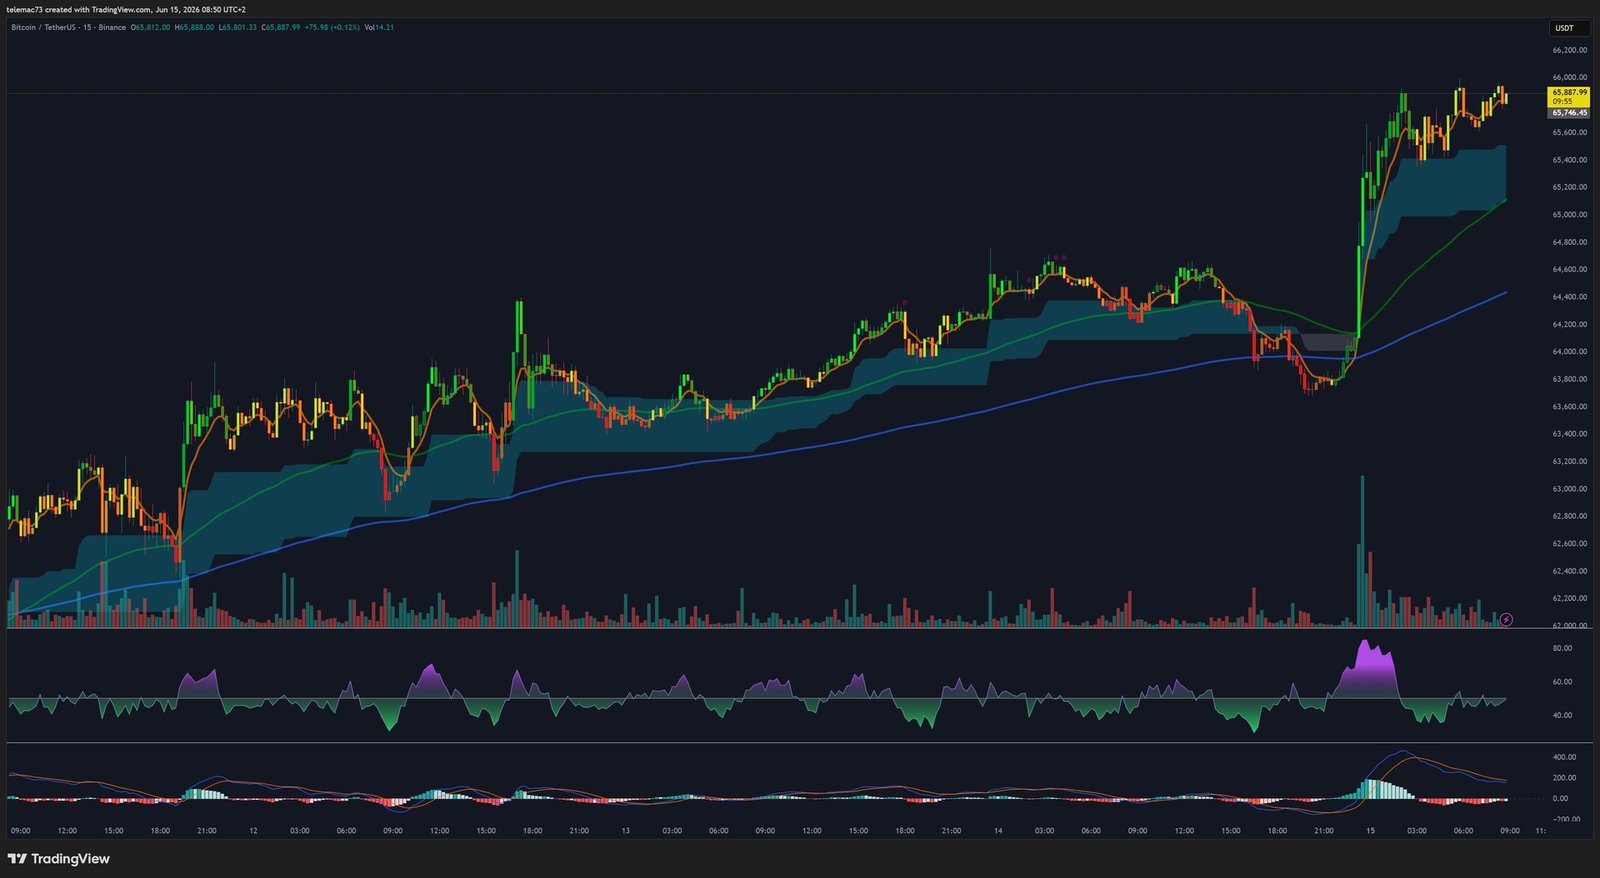
The 15-minute chart, at $65,888, captures the immediate algorithmic reaction to the peace deal announcement. A sequence of near-vertical green candles drove the price from the $63,800 consolidation zone toward $66,000, accompanied by a monumental volume spike — the signature of an institutional capital injection rather than a simple retail-driven move.
This acceleration, however, pushed the oscillators into extreme overbought territory: the RSI (14) is above 80, the Stochastic peaks above 99, and the Williams %R confirms the tension. The ADX, below 25, is a reminder that no strong trend currently dominates the market — we remain in a ranging regime. A digestion phase, potentially in the form of a bull flag, now appears necessary before any new attempt at a breakout to the upside.
Mapping the key levels
Combining chart-based data with quantitative pivot models produces a precise map of the levels to watch for the June 15, 2026 session.
| Type | Level | Description |
|---|---|---|
| Major support | $60,000 – $60,700 | « Buy Power » zone / absolute foundation of the current cycle |
| Dynamic support | $61,892 – $61,968 | Projection of the 200-day moving average |
| Intraday support | $62,653 | First tactical safety net (pivot points) |
| Indecision resistance | $64,800 – $65,000 | Former support turned stubborn resistance |
| Current range resistance | $65,868 – $66,000 | Local high generated by the post-deal rebound |
| Major cycle resistance | $68,000 – $71,800 | Level to break to invalidate the bearish wedge |
On the algorithmic pivot point side, the Fibonacci, Camarilla and Woodie’s methods all converge on a very tight congestion band between $65,094 and $65,598. The current breakout above this zone, with price trading around $65,872, shows that buying pressure has — for now — won out over this cluster of quantitative models.
| Method | S3 | S2 | S1 | Pivot | R1 | R2 | R3 |
|---|---|---|---|---|---|---|---|
| Classic | $61,045 | $61,892 | $62,653 | ~$63,864 | $64,260 | $65,107 | $65,868 |
| Fibonacci | $65,116 | $65,249 | – | – | $65,598 | – | – |
| Camarilla | $65,282 | $65,314 | – | – | $65,410 | – | – |
| Woodie’s | $64,854 | $65,094 | – | – | $65,552 | – | – |
Is Bitcoin undervalued? The verdict from long-term models
To rise above intraday noise, institutional players rely on cyclical valuation models. The « Bitcoin Rainbow Chart, » based on logarithmic regressions applied to the asset’s historical growth, delivers an unambiguous verdict for July 2026: at the current price, Bitcoin sits roughly 53.5% below the model’s lowest band (« Fire Sale, » around $99,143). A return to the « HODL » band (theoretical fair value, around $337,147) would imply an appreciation of more than 422%.
The four-year cycle analysis points in the same direction: the magnitude of past corrections (-85%, -84%, -77% in previous cycles) has tended to decrease as Bitcoin’s market capitalization grows. About eight months (242 days) after the previous October 2025 peak, the current drawdown stands around -48% — more severe than at the same stage of the 2013-2015 cycle, but far less destructive than the 2017-2018 and 2021-2022 purges (close to -68% at this stage). This relative resilience supports the hypothesis of a structural cushioning effect from institutional adoption, although it does not guarantee a definitive bottom before the last quarter of 2026.
Conclusion: an unstable equilibrium on the eve of a possible pivot
At $65,870, Bitcoin embodies the clash between persistent monetary headwinds and structural fundamentals of unprecedented robustness. The downward slope of the 200-day moving average and the repeated failure to durably break above $71,800 point to an unfinished consolidation, while overheated oscillators on the 15-minute chart call for a tactical pause, potentially toward the $62,600 support zone.
At the same time, the surgical absorption of panic selling in the $60,000 zone, the confirmed bullish divergences on the 4H chart together with its Golden Cross, and the prospect of monetary easing should energy-driven disinflation be confirmed, all sketch out a bullish breakout scenario of rare asymmetry. A confirmed break above the $65,500 congestion zone, followed by a decisive move beyond $71,800, would mark the transition toward a new expansion phase of the Bitcoin cycle.
⚠️ Disclaimer: This article is provided for informational and educational purposes only. It does not constitute investment advice, a recommendation to buy or sell, or an incitement to make any financial decision. Cryptocurrency markets are highly volatile and carry significant risk of capital loss. Always do your own research (DYOR) and consult a qualified financial advisor before making any investment decision.

