
As of February 26, 2026, Bitcoin (BTC) is navigating a critical structural transition. After reaching a spectacular All-Time High near $126,000 in October 2025, a severe correction dragged prices into the $60,000–$64,000 range, before a remarkable rebound reclaimed the key $68,000 threshold. This exhaustive analysis decodes the macroeconomic, institutional, and technical forces currently dictating Bitcoin’s trajectory.
🌍 The Macroeconomic Matrix: Tariffs, Monetary Policy & Market Shocks
The Impact of New U.S. Trade Tariffs
One of the primary catalysts behind the recent selling pressure is the announcement of sweeping 15% global tariffs by the U.S. administration. These trade barriers act mechanically as a regressive tax on consumption, dramatically increasing import costs and reigniting inflation fears — effectively forcing the Federal Reserve to maintain a restrictive monetary stance.
For Bitcoin, this macroeconomic dynamic creates a dual-effect paradox: on one hand, imported inflation reinforces the BTC narrative as a non-sovereign store of value; on the other, elevated rates drain liquidity from risk assets and strengthen the Dollar Index (DXY), creating a structurally hostile environment for crypto appreciation.
The State of the Union Address: Immediate Market Reaction
The State of the Union address injected a powerful — if potentially ephemeral — wave of optimism. The administration highlighted an economy described as « roaring, » with 53 consecutive stock market records since the election and nearly $18 trillion flowing into the U.S. economy. The crypto market’s response was immediate: $52 billion in speculative capital flooded into digital assets within hours, pushing Bitcoin up 3% past $66,000, then toward $68,000. This episode perfectly illustrates the market’s extreme sensitivity to political signals.
The Fed’s Dilemma and the Labor Market
The late-January 2026 FOMC minutes reveal a deeply divided institution. The benchmark rate holds at approximately 3.6%, with a pro-cut faction (Waller, Miran) arguing inflation is nearing the 2% target versus a conservative bloc (Collins, Barkin) citing sufficient labor market stability. Contradictory data compounds the uncertainty: 100,000 layoffs in January (the worst since 2009) versus 250,000 NFP jobs created. Upcoming ADP and jobless claims reports will serve as critical volatility arbiters for BTC in the near term.
🏦 Institutional Dynamics: Accumulation & New Paradigms
ETF Outflows and Orderly Deleveraging
January 2026 saw U.S. spot Bitcoin ETFs record net outflows of $1.6 billion, reflecting fund managers’ wait-and-see posture amid the new rate paradigm. However, deeper analysis indicates this is an orderly deleveraging, not a disorderly capitulation. Open Interest on futures has fallen 45% since the October peak (from $90B to ~$49B), cleansing the market structure of fragile speculative positions without triggering systemic failure. On-chain indicators increasingly point to mean reversion, suggesting imminent stabilization.
Emirates NBD: Banking Sector Integration of Bitcoin
One of the quarter’s most seismic fundamental developments comes from the Middle East: Emirates NBD, a banking giant managing colossal portfolios in the UAE, has confirmed it is evaluating a 1% Bitcoin allocation across its investment portfolios. The group’s CIO described BTC explicitly as « digital gold » and a long-term store of value. Internal valuation models point to a fair value of approximately $100,000 on a twelve-month horizon. This rhetorical and operational transition validates the thesis of sovereign adoption and institutional diversification.
The Stifel Model: Secular Floor at $38,000
Investment bank Stifel Financial has modeled Bitcoin’s four historical bear markets (93%, 84%, 83%, and 76% drawdowns) to trace an unbroken 15-year logarithmic ascending channel. Each cyclical crash found a floor significantly higher than the previous one. Projecting this trendline onto 2026, Stifel identifies an absolute worst-case correction floor at $38,000 — representing a 70% decline from the $126,000 ATH. While extreme in isolation, this would be mathematically consistent with Bitcoin’s historical cycle resets.
📊 Multi-Timeframe Technical Analysis
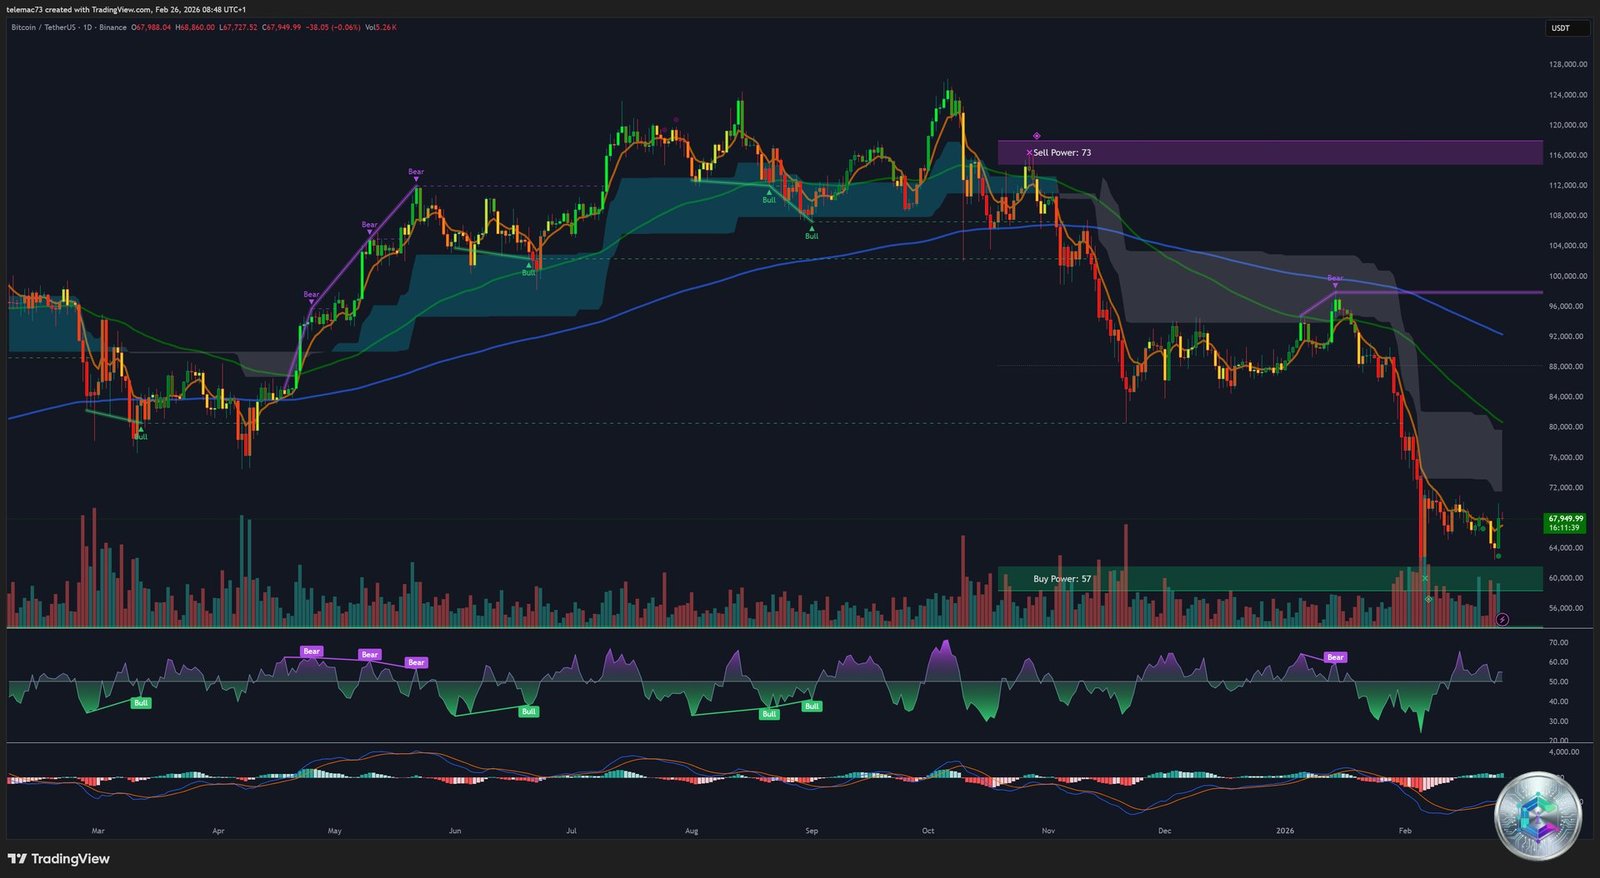
Daily Chart: The Macro Perspective
The daily chart reveals a sustained correction from highs above $120,000 toward a trough near $60,000. The most promising signal of the past 48 hours is the confirmed formation of a Higher Low (HL) at $64,758, followed by a violent rebound above $68,000. The Awesome Oscillator prints +1,042, signaling an embryonic momentum breakout. However, Bitcoin remains trapped below its 30-day MA at $71,095 — the critical demarcation line between a corrective bounce and a genuine bull market resumption.
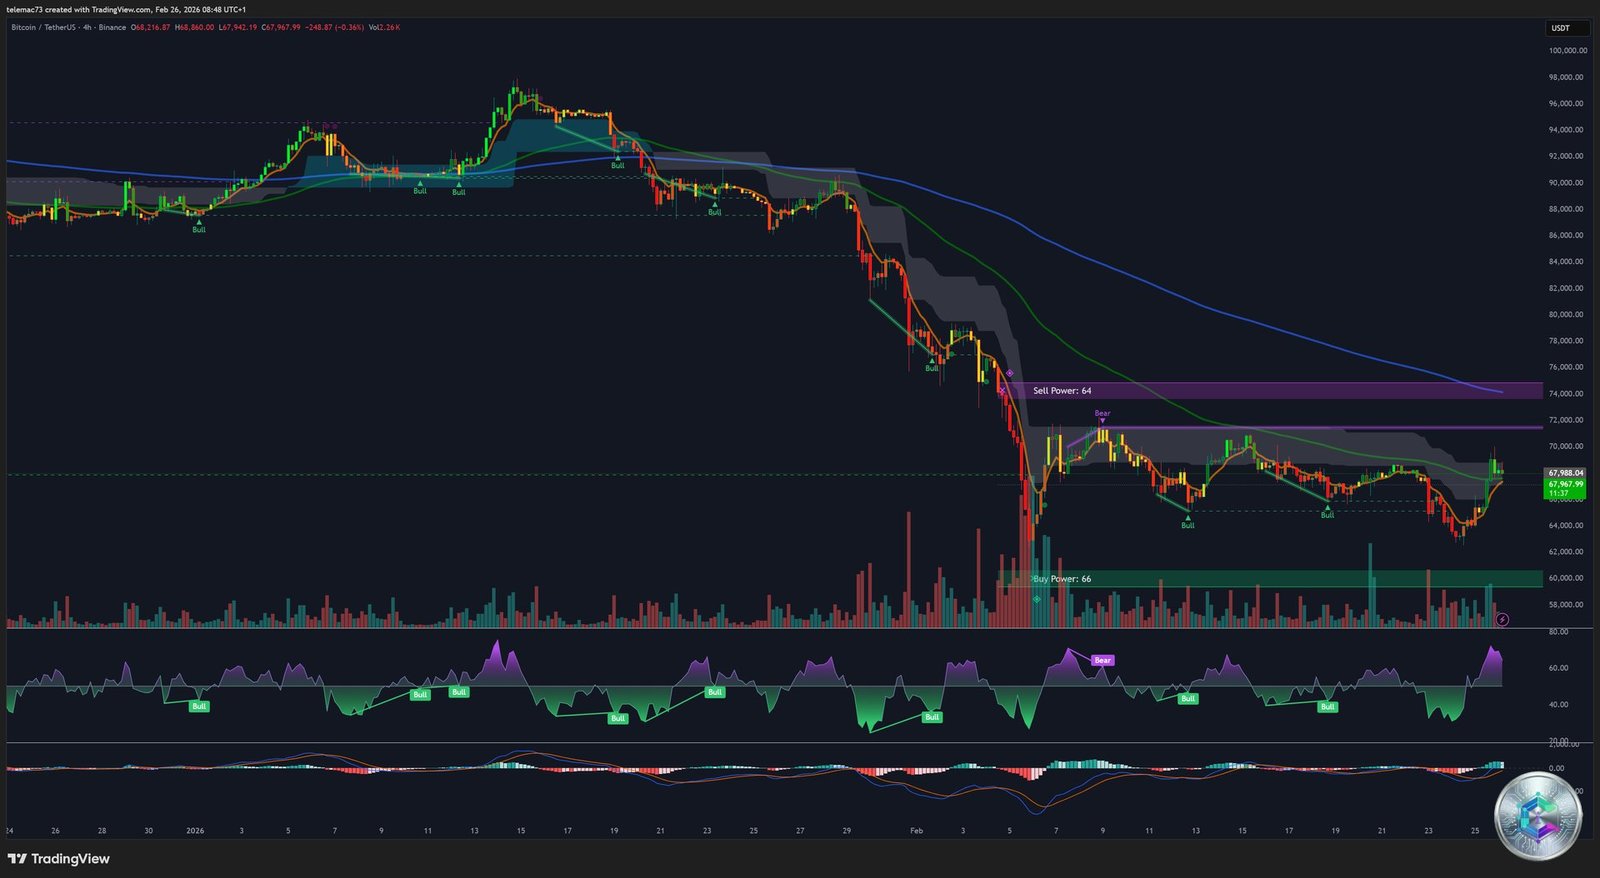
4-Hour Chart: The Precarious Equilibrium
On the 4H timeframe, Bitcoin trades in the lower half of a persistent descending channel around $67,988. Candles feature narrow bodies and extended wicks — symptoms of an attrition battle where neither side can impose its will. Sell Power at 64 (anchored to $74,000) and Buy Power at 66 (anchored to $60,000) confirm the absence of clear directional dominance. The internal 4H support at $63,000 is the tactical lifeline that must hold to prevent a return to annual lows.
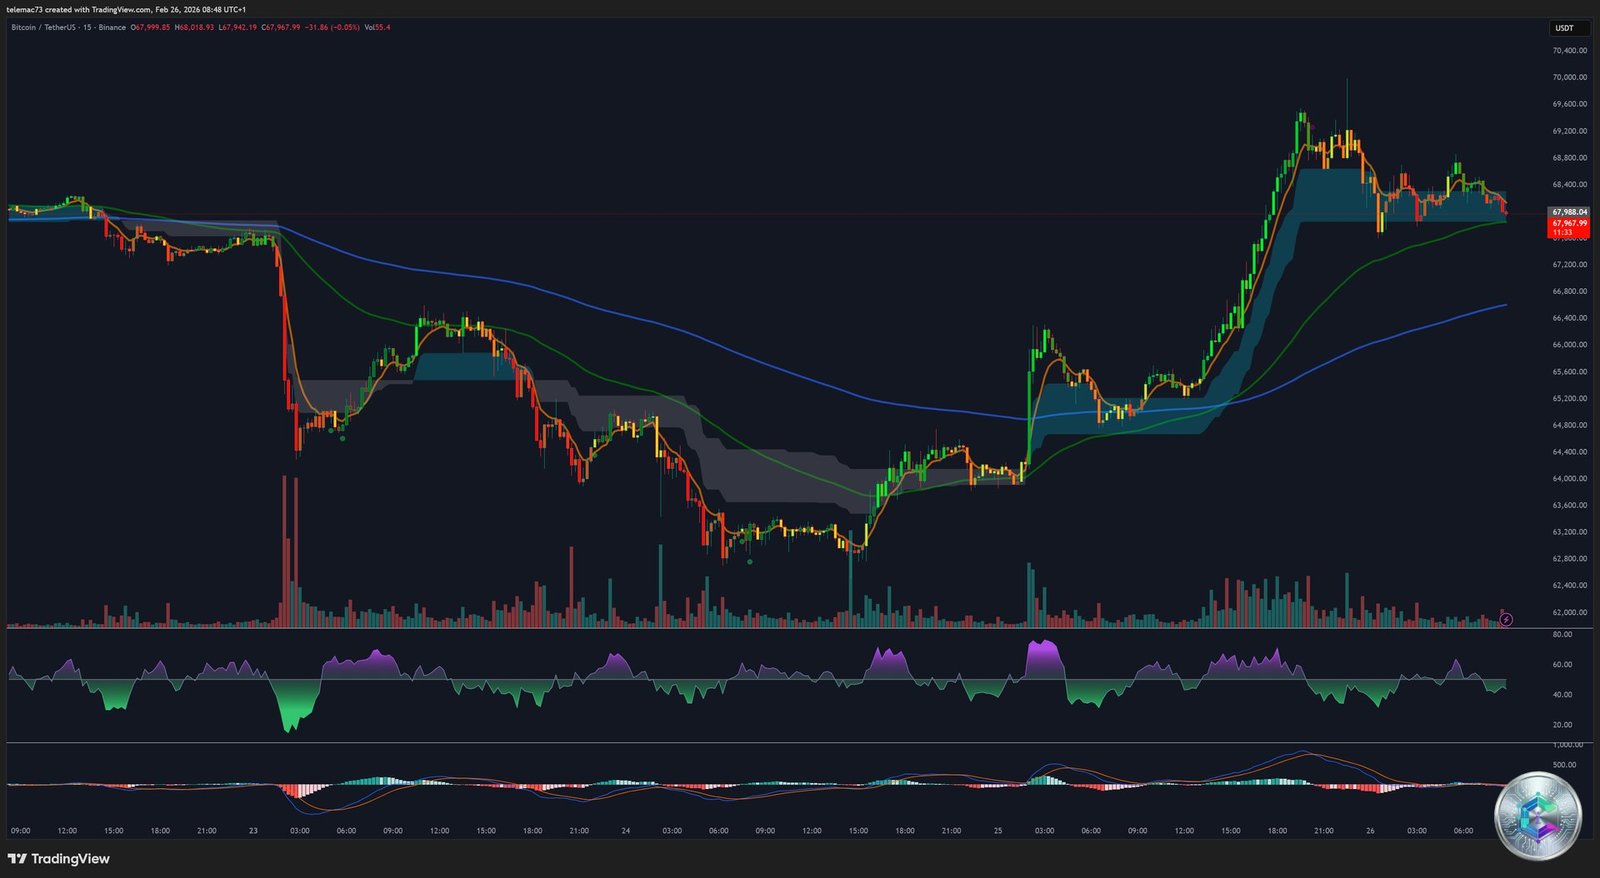
15-Minute Chart: The Algorithmic Microstructure
The 15-minute chart captures the essence of intraday whipsaw volatility: a near-vertical drop to the $64,700 zone, followed by an equally spectacular V-shaped recovery to $67,988. This deliberate stop-hunt behavior is characteristic of a liquidity-seeking market targeting retail traders’ protective orders. A solid buy wall at $68,058 acts as an elastic trampoline, absorbing residual selling pressure and keeping price afloat in the very short term.
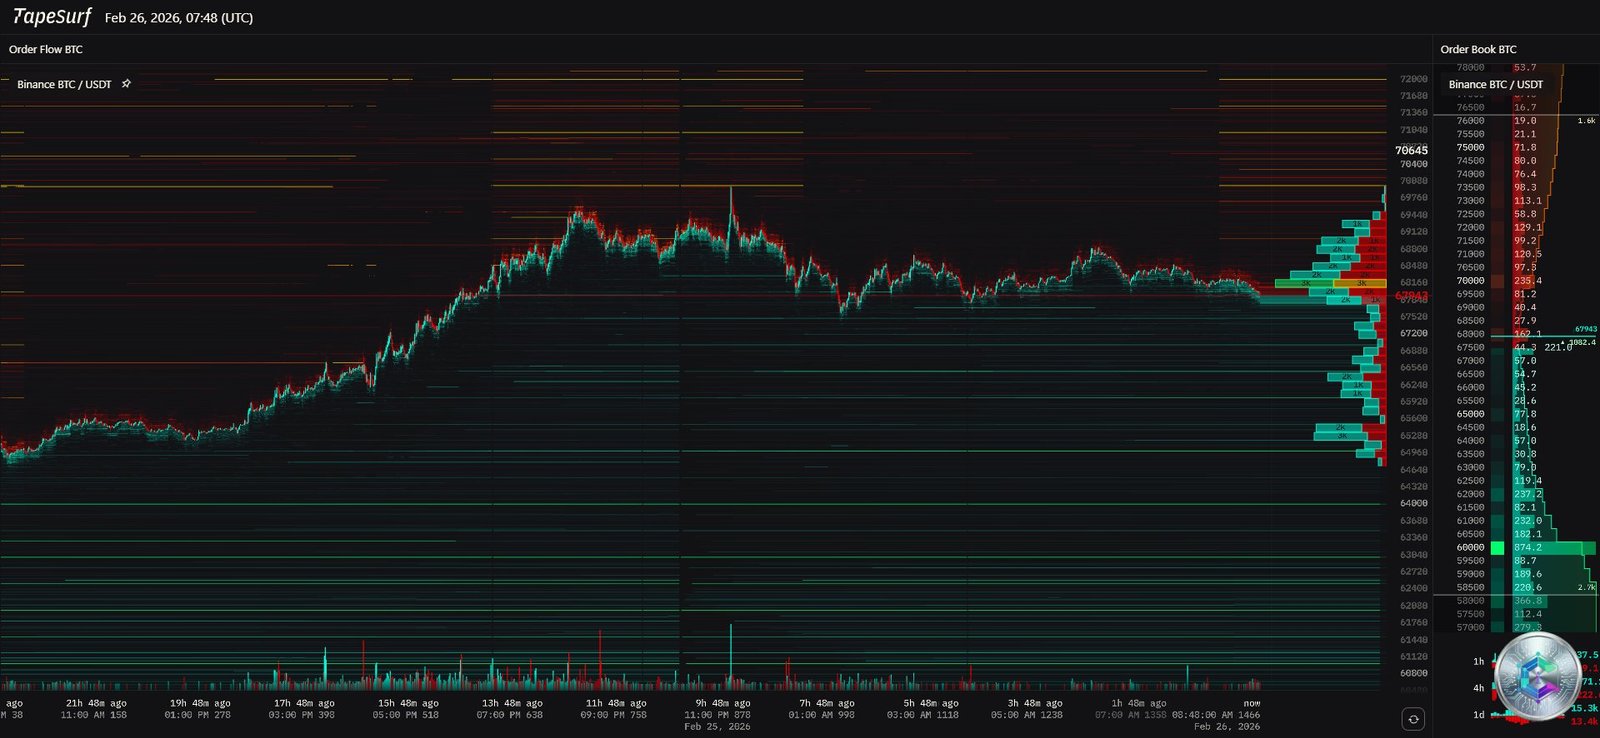
🔥 Liquidity Heatmap & Derivatives Market Analysis
The TapeSurf heatmap reveals a deeply asymmetric order book architecture:
- Massive sell wall: $70,645 – $72,000 (dense red blocks, glass ceiling)
- Short squeeze trigger zone: $78,000 – $82,000 (concentrated short liquidations)
- Primary liquidity floor: $60,000 – $62,000 (green bid blocks, major support)
- 24h global liquidations: $397 million (asymmetric ratio: $293M longs vs $66M shorts)
The market currently operates in a Negative Gamma regime: market makers are mechanically forced to sell when prices fall and buy when they rise, amplifying volatility instead of dampening it. This dynamic explains the erratic +3.45% intraday spike followed by an abrupt reversal — a hallmark of algorithm-driven, gamma-hedging behavior.
🎯 Key Strategic Price Levels — Summary
| Strategic Zone | Price Level (USD) | Significance |
|---|---|---|
| Macro Resistance (Bearish Invalidation) | $76,159 | Break = end of correction structure from Oct. 2025 |
| Liquidity Ceiling (Sell Wall) | $70,645 – $72,000 | Systemic barrier (TapeSurf), must break for short squeeze |
| Dynamic Resistance (MA 30) | $71,095 | Bull/bear market demarcation line |
| Current Center of Gravity | ~$67,988 – $68,117 | Critical intraday pivot post-rebound |
| Dynamic Support (MA 7) | $66,923 | Loss = short-term bullish alarm signal |
| Higher Low Pivot | $64,758 | Fortified ascending low, local floor |
| 4H Channel Support | $62,795 – $63,000 | Last stop before capitulation toward annual lows |
| Primary Liquidation Floor | $60,000 – $62,000 | Last psychological and technical rampart |
| Structural Abyss (Stifel worst-case) | $38,000 | 15-year log trendline floor, -70% from ATH |
🔭 Conclusion: A Gordian Knot Awaiting Its Catalyst
Bitcoin stands at a decisive crossroads. The stubborn reclaim of $68,000 above the $64,758 Higher Low demonstrates genuine resilience that contradicts the capitulation narrative, while institutional accumulation — led by Emirates NBD targeting $100,000 — provides the fundamental backbone preventing deeper collapse.
Yet, near-term price action remains hostage to derivatives microstructure: trapped in a Negative Gamma options regime and geometrically capped by the $70,645 sell wall identified on the TapeSurf heatmap. The market requires an exogenous macro catalyst:
- Bullish scenario: Weak employment data forcing the Fed toward rate cuts → massive short squeeze above $72,000
- Bearish scenario: Sustained high rates exhausting spot demand → punitive return toward the $60,000 floor
The institutional and informed investor must maintain dynamic neutrality, structuring risk management strictly around the $68,117 pivot and the fateful $72,000 absorption wall. Upcoming macro releases — ADP, NFP, and FOMC decisions — will be the true arbiters of Bitcoin’s directional fate heading into March 2026.
⚠️ Disclaimer: This article is written for educational and informational purposes only. It does not constitute investment advice, nor a recommendation to buy or sell cryptocurrencies or any other financial asset. Cryptocurrency markets are highly volatile, and past performance is not indicative of future results. Please consult a qualified financial advisor before making any investment decision.