
On this January 20, 2026, Bitcoin finds itself at a decisive moment in its evolution. Oscillating between $91,000 and $93,000, the world’s first cryptocurrency faces contradictory pressures: geopolitical tensions on one side, massive liquidity injection by the Federal Reserve on the other. This in-depth technical analysis reveals the strategic levels that will determine BTC’s trajectory in the coming weeks.
A High-Tension Macroeconomic Context
Bitcoin does not evolve in a vacuum. The current correction, which saw BTC slide from nearly $98,000 to $91,000, originates from transatlantic trade tensions. President Trump’s threat to impose punitive tariffs on several European countries if Denmark refused to negotiate the sale of Greenland triggered a classic flight to traditional safe-haven assets.
Gold thus broke new historical records, exceeding $4,670 per ounce, while the US Dollar strengthened mechanically. In this risk-averse climate, Bitcoin, considered a « risk-on » asset, suffered immediate selling pressure.
However, a fundamental element counterbalances this bearish dynamic: the Federal Reserve launched on January 20 an operation to purchase $8.3 billion in Treasury bills, the first tranche of a program estimated at $55 billion. This liquidity injection, although presented as a technical measure to stabilize bank reserves, acts in effect as targeted quantitative easing.
Historically, the expansion of the Fed’s balance sheet is strongly correlated with the appreciation of finite-supply assets like Bitcoin. The current decline could therefore be perceived by institutional investors as an accumulation opportunity before this liquidity’s effect propagates into prices.
Multi-Timeframe Technical Analysis: Where Does Bitcoin Stand?
Daily View: Consolidation and Indecision

The daily chart reveals a clear consolidation structure. Since early 2026, BTC has been trading in a wide range between $80,000 (structural support) and $98,000 (resistance before the psychological threshold of $100,000).
Bitcoin is currently testing its 50-day Exponential Moving Average (EMA), located around $92,200. A clear daily close below this level would be a negative technical signal, opening the door to a test of the annual opening zone around $87,000. The daily RSI is navigating in a neutral-bearish zone (43-45), indicating the market still has room for correction without being technically oversold.
4-Hour View: Potential Reversal Signals
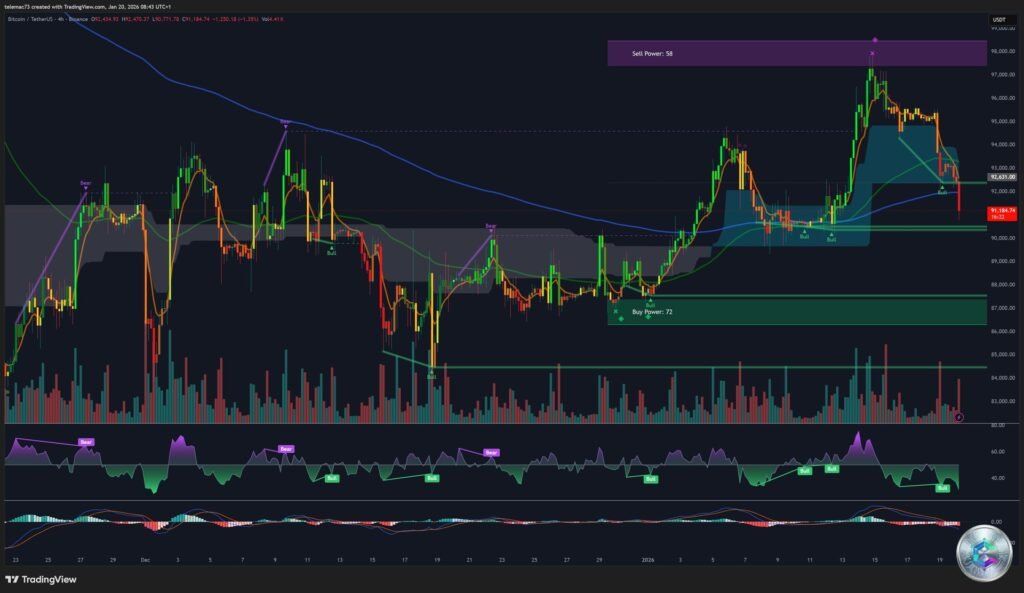
The 4-hour timeframe reveals a crucial technical element: a potential bullish divergence on the RSI. While the price has printed marginal lower lows (testing liquidity below $91,500), the RSI oscillator is beginning to form higher lows or stabilize. This behavior indicates exhaustion of selling pressure.
Bollinger Bands on this timeframe also show signs of compression, a phenomenon that historically precedes explosive volatility expansion. In the context of the Fed’s liquidity injection, the probability that this expansion will be upward (after a potential false bearish breakout) is statistically significant.
15-Minute View: Microstructure and News Reactivity
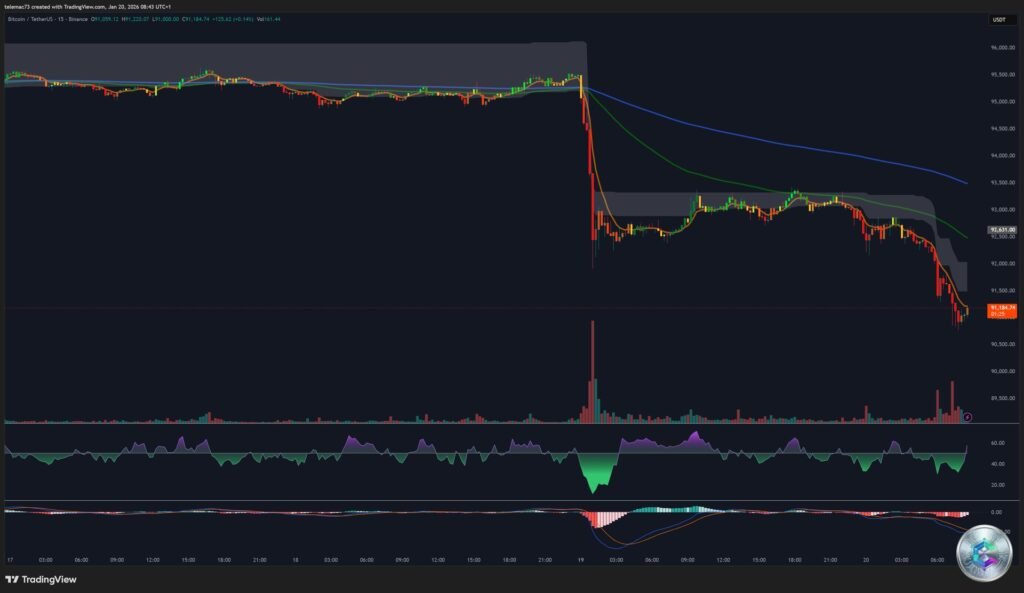
The 15-minute chart captures the market’s raw nervousness. The impulsive vertical red candles correspond to moments when press headlines about tariffs hit trading terminals. These movements are characteristic of sentiment-based algorithmic trading.
However, the long wicks observed around $91,000 – $91,500 testify to passive absorption: institutional buyers or algorithms are quietly accumulating in this zone, preventing a free fall. The price is currently struggling to reclaim the session’s VWAP (Volume Weighted Average Price), whose recapture would be the first sign of buyers regaining control.
Liquidity Heatmap: Decoding Strategic Zones
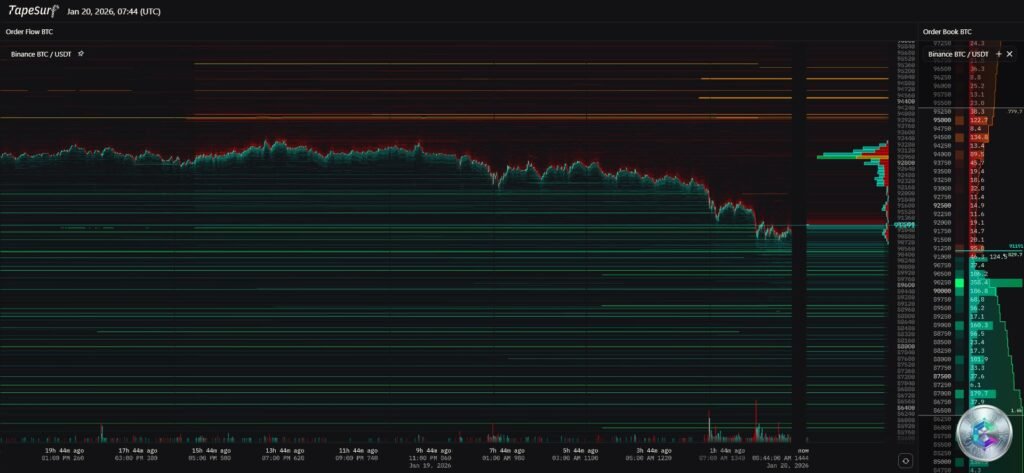
Analysis of the heatmap reveals the real intentions of market participants, beyond executed prices. This liquidity map is essential for anticipating future movements.
Resistance Walls (Sell Liquidity)
- Zone $94,500 – $95,000: First tactical barrier with notable density of limit sell orders. Scalpers and short-term traders use this level to protect their short positions.
- Zone $98,000 – $100,000: The real « Berlin Wall » of current Bitcoin. A massive concentration of sell-side liquidity accumulates just before 100k. This represents institutional profit-taking and hedging orders defending the psychological level. Crossing this zone will require exceptional buying volume.
- Zone $110,000: Another liquidity cluster waits higher, acting as a magnet for a potential violent « Short Squeeze » if 100k is broken.
Support Walls (Buy Liquidity)
- Zone $90,000 – $91,000: Immediate support is clearly defined by an accumulation of buy orders. This is the level that bulls must defend at all costs.
- Level $88,900: Robust secondary liquidity support.
- Zone $80,000: « Capitulation » level where massive liquidity waits to buy the market in case of systemic crash. Whales position their buy orders very low to profit from retail panic.
Key Levels and Professional Pivot Points
Here are the strategic levels to watch closely in the coming days:
| Level | Type | Price | Analysis |
|---|---|---|---|
| R3 | Major Resistance | $104,200 | « Blue Sky » target if 100k breaks |
| R2 | Structural Resistance | $98,500 – $100,000 | Critical zone. Range high. Massive sell wall |
| R1 | Local Resistance | $95,600 – $96,000 | 4H EMA. First sell-side liquidity wall |
| PIVOT | Central Point | $93,166 | Intraday barometer. Key level to reclaim |
| S1 | Immediate Support | $90,400 – $91,500 | Current defense zone. High buy density |
| S2 | Major Support | $87,000 – $87,600 | 2026 annual opening. Crucial technical level |
| S3 | Capitulation Support | $84,200 – $80,000 | Final capitulation zone. 200D SMA |
Level Interpretation
The Pivot Battle ($93,166): This is the key level for the next 24 hours. As long as BTC remains below, sellers keep control. Reclaiming this level with volume would signal that the Fed’s liquidity injection is starting to take effect.
The 90k Floor (S1): The 90k-91k zone is not just a round number, it’s a psychological and technical threshold. Its break would likely trigger automatic selling algorithms, accelerating the fall towards $87,000.
The Glass Ceiling (R2): The 98k-100k zone has been tested multiple times without success. To break it will require a strong exogenous catalyst like a truce in the trade war or a major dovish surprise from the Fed.
Market Sentiment: The Fear & Greed Index
The « Fear & Greed » index has suffered a drastic fall, moving from a neutral/greed sentiment (61) to a Fear zone (32), even Extreme Fear (21) according to some metrics. A level of 32 is historically a relevant buying zone according to the adage « buy when there’s blood in the streets ».
The fact that sentiment is so depressed while the price remains above $90,000 (less than 10% from its all-time high) reveals a major positive divergence. The market is nervous but the price isn’t collapsing, suggesting that long-term holders (HODLers) refuse to sell in panic.
Forecast Scenarios for Late January 2026
Scenario A: The « Liquidity Rebound » (Probability: 55%)
The $8.3 billion injection by the Fed acts as a catalyst. The market digests the Greenland news. BTC successfully defends the $91,000 – $91,500 zone, then bounces to reclaim the Pivot ($93,166) and accelerates towards $95,600. Target: return towards $98,000 by end of January.
Validation sign: 4H close above $93,200 with increasing buy volume.
Scenario B: Extended « Risk-Off » Correction (Probability: 30%)
Transatlantic tensions worsen. Stock markets correct severely, dragging Bitcoin in their fall. The $91,000 support gives way, triggering a cascade of liquidations. Target: test of the $87,000 – $88,000 zone (S2). In an extreme case, a capitulation wick could touch $84,000 before being bought back.
Opportunity: For long-term investors, this scenario would offer a major buying opportunity.
Scenario C: Stagnation and Compression (Probability: 15%)
Forces cancel each other out. Fed liquidity exactly compensates geopolitical selling pressure. Bitcoin enters a phase of decreasing volatility, painfully oscillating between $91,500 and $94,000. Altcoins could suffer more in this scenario.
Conclusion: Caution and Opportunity
The complete analysis of Bitcoin on January 20, 2026 depicts a resilient asset, temporarily caught between short-term geopolitical fear and extremely supportive medium-term monetary fundamentals. The « 100k thesis » is not invalidated, but delayed by political noise.
Defense of the $90,000 – $91,500 zone is the crucial issue of the coming hours. Technical indicators (4H RSI, Bollinger Bands) and liquidity analysis suggest that the immediate downside potential is limited by strong latent demand.
Recommendation: The optimal strategy consists of monitoring price reaction around the $93,166 Pivot. Reclaiming this level would be the signal that the market has priced in the Greenland risk and is turning towards Fed liquidity. Conversely, any incursion below $90,000 should be considered a strategic accumulation opportunity towards $87,000.
Important Disclaimer: This article is provided for purely educational and informational purposes. It in no way constitutes investment, financial, or trading advice. Cryptocurrency markets are extremely volatile and carry significant risks of capital loss. Always do your own research (DYOR – Do Your Own Research) and consult a qualified financial advisor before making any investment decision. Past performance does not guarantee future results. Only invest amounts you can afford to lose.