


Bitcoin is trading in mid-July 2026 inside a compression range that is as narrow as it is strategically important, caught between macroeconomic headwinds and institutional foundations that have arguably never looked stronger. Between ETF outflows, geopolitical tension and a sweeping Swiss regulatory overhaul, our team dug through the multi-timeframe charts and order book depth to map out the levels that will decide the next major directional move.
A macro backdrop under heavy pressure
Chart reading alone cannot explain current market behavior. Three major exogenous forces are currently weighing on crypto investors’ risk appetite.
Geopolitical escalation and the flight to safety
The formal entry of the United States into a state of conflict with Iran, triggering a statutory 60-day war clock, instantly reinjected a risk premium across global financial markets. High-beta assets such as cryptocurrencies faced immediate selling pressure as portfolio managers sought safety in dollars and stablecoins rather than directional exposure. The rising dominance of stablecoins reflects a wait-and-see posture from « smart money, » starving Bitcoin of the speculative fuel it needs to clear its upper resistance levels.
An infrastructure outage at the worst possible time
At the same time, a major outage of the Telegram domain (t.me) — a backbone of communication and information flow across the crypto ecosystem — paralyzed community channels. The resulting slowdown in onboarding and project announcements has caused a sharp loss of short-term momentum, depriving the market of the retail buying support that traditionally absorbs intraday dips.
A quiet ETF bleed
On July 9, 2026, US spot Bitcoin ETFs recorded net outflows of $95.3 million in a single session, alongside similar withdrawals of $52.2 million from Ethereum vehicles. Despite this, the asset has shown notable resilience by holding above the $64,000 threshold. Still, these outflows reduce market depth, amplifying potential volatility and making the support zones on the charts more fragile than they appear on the surface.
Switzerland 2026: a regulatory foundation that changes the game
While the immediate landscape looks hostile, Bitcoin’s medium-term structural fundamentals have arguably never been stronger, driven by a major Swiss regulatory overhaul.
- FINMA Guidance 01/2026: mandates strict segregation of assets under collective custody, with a requirement to attribute funds to individual clients at all times — a key protection against FTX-style counterparty risk.
- New « Crypto Institution » licenses: the Federal Council introduced a tailor-made legal framework, aligning capital, liquidity and recordkeeping requirements with those of traditional securities firms.
- OECD’s CARF and the AMLA reform: effective January 2026, an automatic tax information exchange framework with 74 partner states, paired with tighter transparency on beneficial owners.
This regulatory architecture is the catalyst that lets pension funds and corporate treasuries consider a Bitcoin allocation without fearing a custodian-style collapse. It also explains why institutional buy orders placed under $60,000 reflect long-term conviction rather than a purely speculative bet.
A multi-timeframe technical read
Our approach cross-references three timeframes — daily, 4-hour and 15-minute — to isolate the underlying trend while pinpointing short-term inflection points.
The macro view: the daily chart (1D)
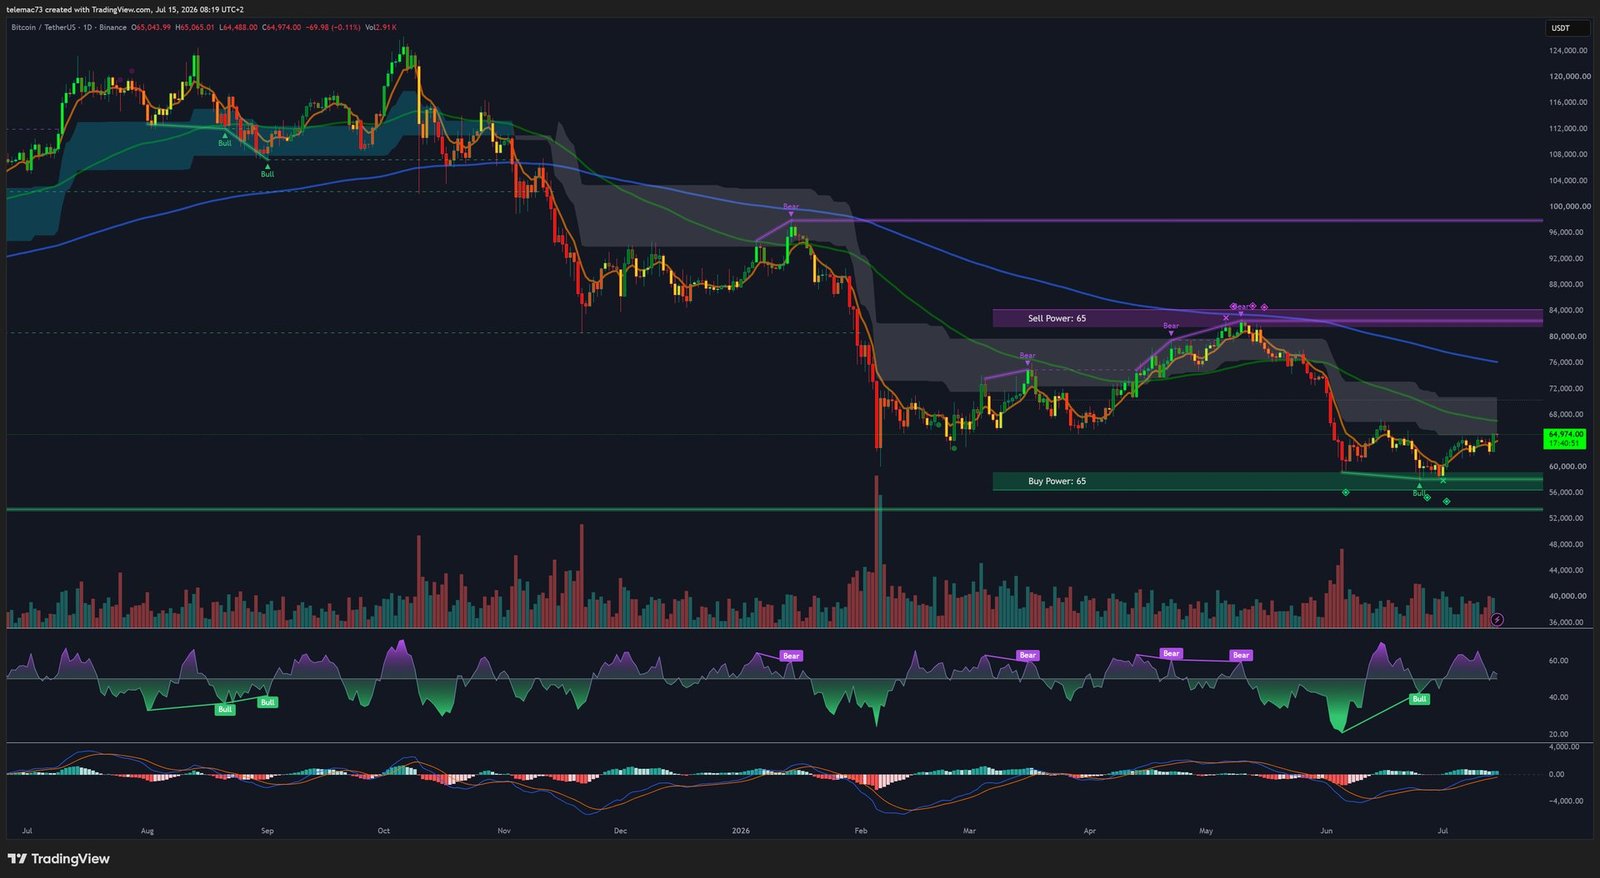
Since the highs above $70,000 seen in prior months, price has formed a sequence of lower highs and lower lows, piercing the $60,000 psychological level in June before capitulating into the $53,000–$54,000 region. The short moving average has crossed below the longer one — a setup resembling a classic Death Cross that seals a structurally bearish sentiment. The daily 50 EMA, sitting around $65,142, is acting as a heavy overhead resistance.
Order flow highlights two tectonic zones: an institutional sell wall around $65,000 and a defensive buy bastion near $58,000. Encouragingly, though, the daily RSI — which had plunged into extreme oversold territory during the capitulation — is showing early signs of a recovery divergence, while the MACD hints at a possible bullish crossover below the zero line.
The intermediate structure: the 4-hour chart and the squeeze
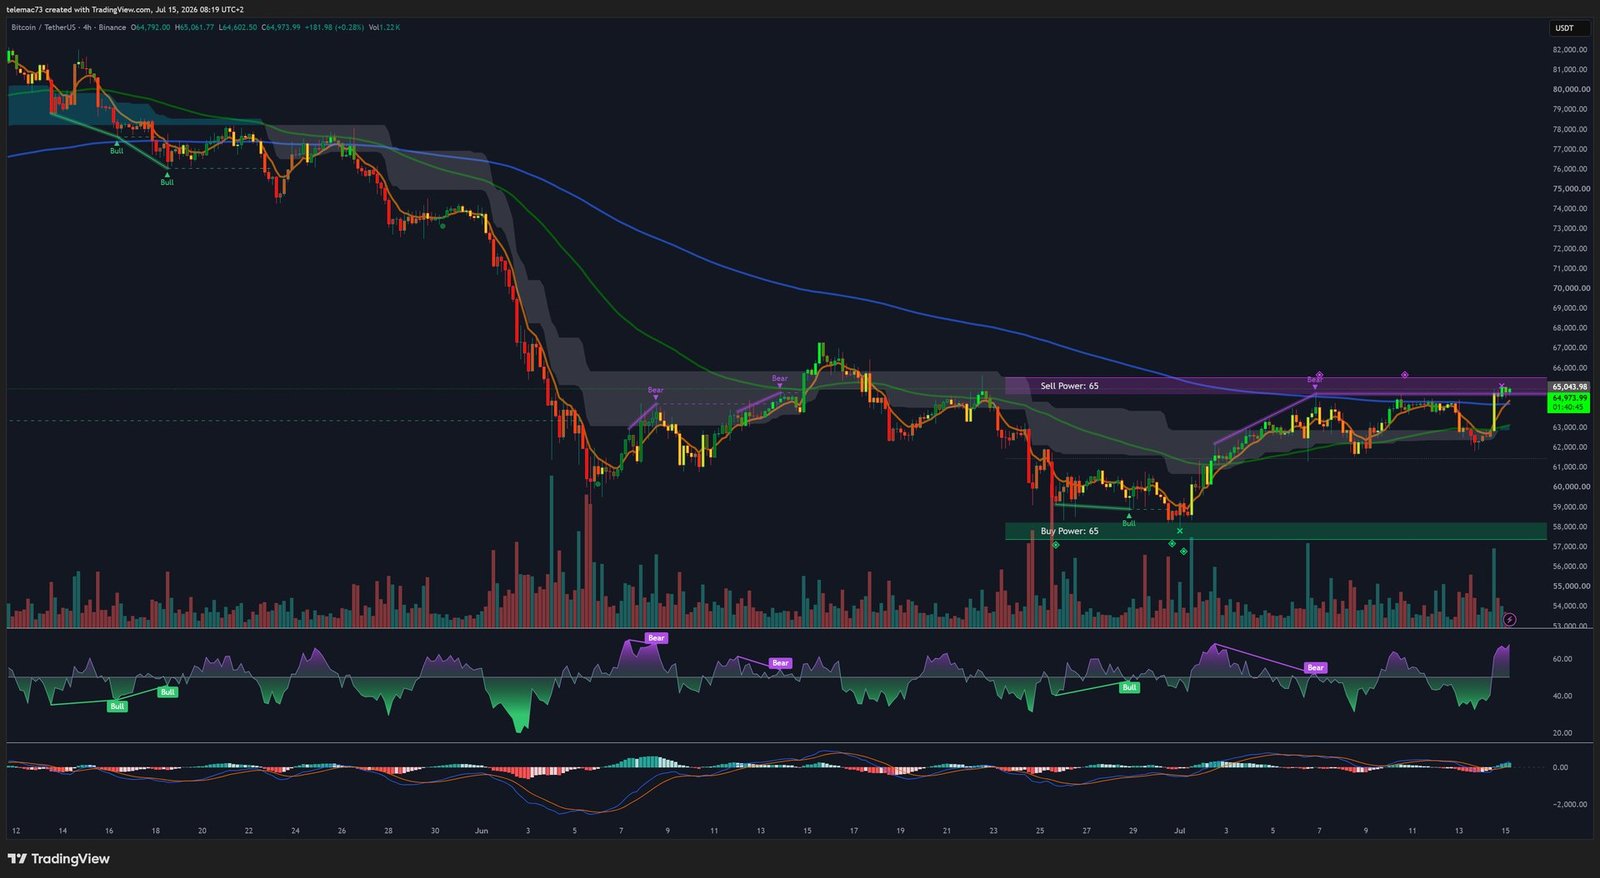
Price is oscillating around $64,973 inside a compression triangle, a pattern marked by progressively shrinking swings following a series of bear flags. Moving averages are converging, hinting at a possible Golden Cross on this timeframe. The RSI sits in neutral territory between 40 and 60, while the MACD remains nearly flat — the textbook signature of compression before a directional break. The $63,000 pivot level is the referee of this tug-of-war between buyers and sellers.
Intraday microstructure: the 15-minute chart
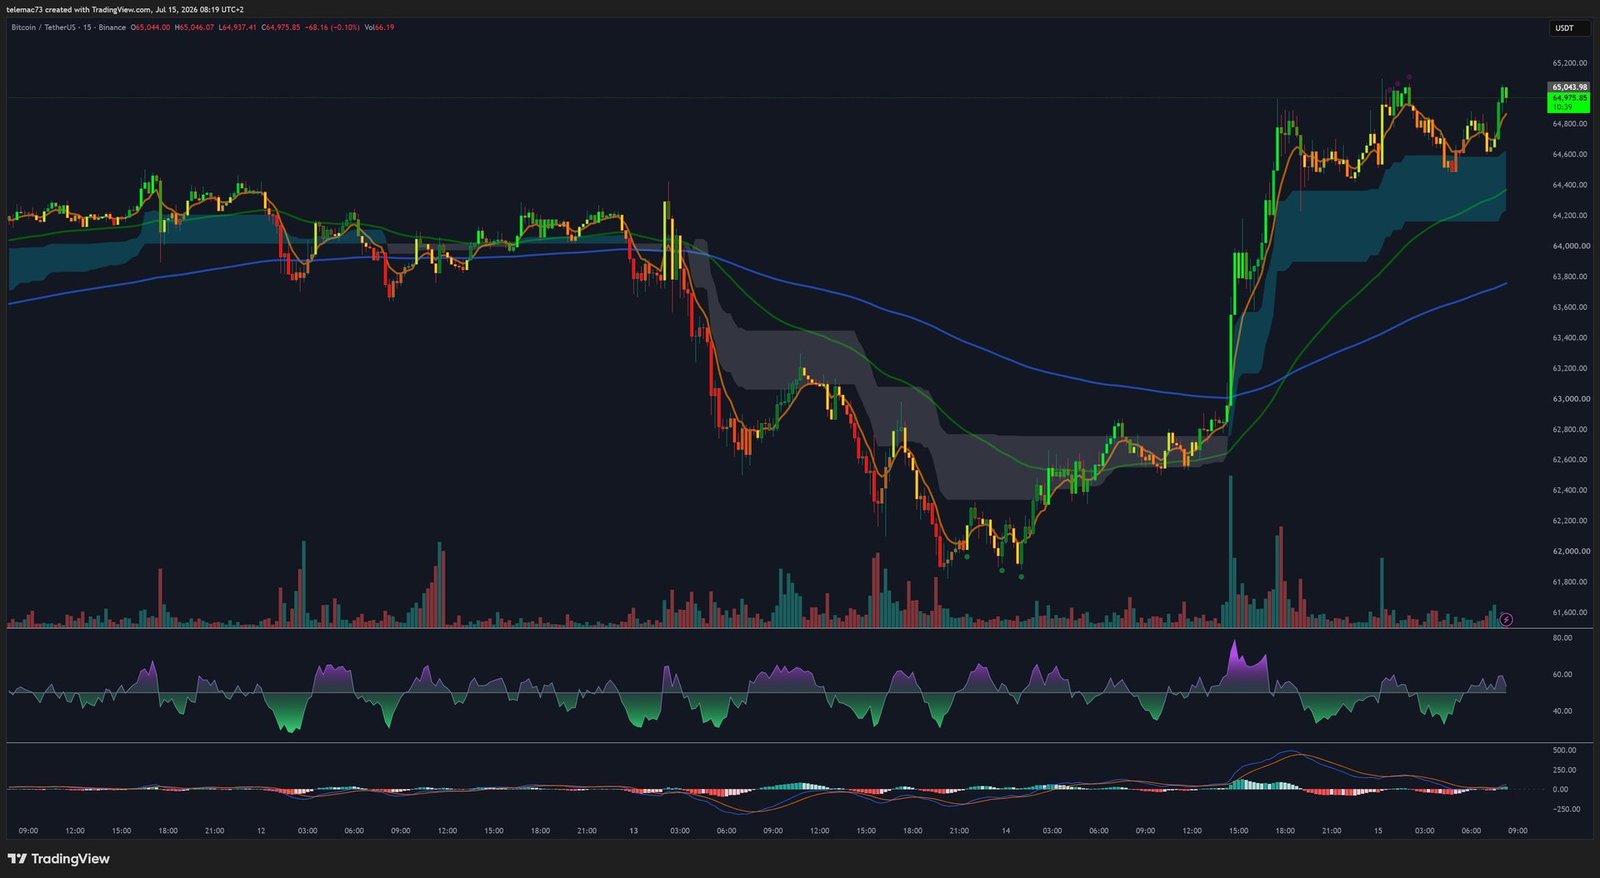
At $65,045, the 15-minute chart shows an aggressive uptrend, with a clear sequence of higher lows and higher highs. The Golden Cross here is already a done deal, and the resistance cloud has been fully cleared. The flip side: the RSI has reached extreme overbought readings, warning that a short-term pullback is likely before this momentum runs into the daily 50 EMA.
The liquidity heatmap: where the real levels hide
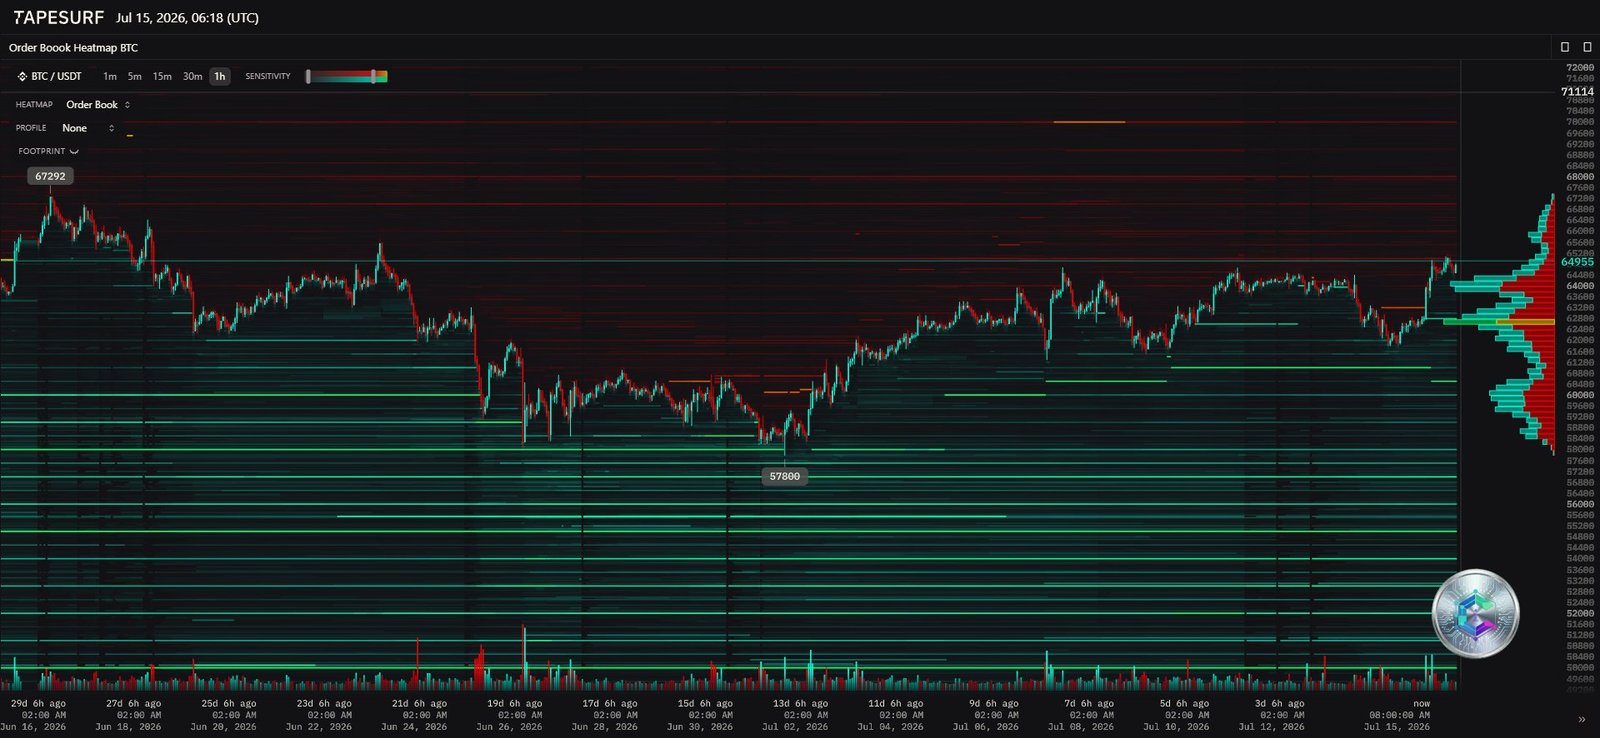
While charts reveal the traces left by past prices, order book depth sheds light on where capital flows are headed next. The TapeSurf heatmap, dated July 15, 2026, confirms a Point of Control (POC) sitting between $64,800 and $65,000 — a sign of a temporary equilibrium hemmed in by massive liquidity cliffs.
On the sell side, a dense stratification thickens from $66,000 up to $71,114, with a particularly intense level identified at $67,292 — likely an institutional profit-taking point. On the buy side, the most striking signal remains a sizeable buy-order block positioned at $57,800, far thicker than any other visible structure, confirming the existence of a deep liquidity pocket between $54,000 and $57,000.
This setup fuels a risk well known to experienced traders: a long squeeze. The prolonged consolidation has encouraged many leveraged players to build up long positions, with stop-losses clustered below $63,000 and $60,000. A break under these levels would trigger a mechanical liquidation cascade, pulling price down toward the $57,800 buy wall.
Two scenarios going forward
Bullish scenario: trend restoration
The aggressive momentum seen on the 15-minute chart spreads to the higher timeframes: price absorbs the sell orders, turns the $63,000 pivot into a fortress, and closes a daily candle above the 50 EMA ($65,142). The daily MACD confirms its bullish crossover below zero while the 4-hour chart breaks its triangle to the upside, triggering a short squeeze that eats through the $67,292 resistance and opens the door to a retest of $70,000.
Bearish scenario: a liquidity purge
The extreme overbought RSI on the 15-minute chart undergoes a sharp mean reversion; the attack on the 50 EMA fails against the $67,292 sell wall. The 4-hour bear flags play out, price breaks below $60,000 and mechanically triggers the long squeeze. The market is then pulled toward the $57,800 buy wall, possibly extending into the $54,000 zone, before any eventual institutional accumulation closes out the cycle.
The current $64,000–$65,000 zone therefore offers a particularly asymmetric risk/reward ratio for any leveraged directional position. The confluence of a daily Death Cross, depleted ETF flows, and the existence of deep liquidity walls calls for constant vigilance: every move within the 4-hour compression triangle is merely a preparatory maneuver ahead of the final resolution of this high-tension market structure.
Disclaimer: this article is intended for educational and informational purposes only. It does not constitute investment advice, a recommendation to buy or sell, or a solicitation to act on financial markets. Cryptocurrencies are highly volatile assets, and any investment decision should be based on personal research and, where appropriate, the advice of a qualified professional.

