
An Extraordinary Correction in a Hostile Macroeconomic Environment
Bitcoin’s ecosystem is navigating, in June 2026, a structural recalibration of a magnitude rarely seen since February 2026. The recent BTC collapse — from $72,840 down to an abyssal low of $60,215 — represents a depreciation of nearly 15% in just a few trading days. This move cannot be dismissed as a simple technical retracement: it is a profound alteration of market structure, resulting from a toxic confluence of systemic factors, unprecedented institutional capital withdrawals, and a macroeconomic environment that turned suddenly hostile to high-beta speculative assets.
1. Fundamental Triggers: Macro, Rates & Geopolitics
1.1 NFP Pressure and the Fed’s « Higher for Longer » Stance
The release of U.S. employment data (Non-Farm Payrolls) significantly above expectations instantly reignited fears of a prolonged restrictive monetary policy. Elevated risk-free rates mechanically increase the opportunity cost of holding assets without endogenous cash flows — like Bitcoin. Faced with attractive bond yields, institutional capital orchestrated a defensive rotation (risk-off reset), abandoning BTC in favor of perceived safer assets: sovereign bonds, AI equities, and semiconductors.
1.2 Geopolitical Instability and Correlation with the Nasdaq
Contrary to the « digital gold » narrative, June 2026 flows empirically confirm that in the early stages of a liquidity shock, Bitcoin exhibits a near-perfect positive correlation with the Nasdaq. The escalation of U.S.-Iran tensions suppressed rate-cut expectations, pushing market operators to liquidate their most volatile positions ahead of anticipated inflationary supply shocks.
2. The Institutional Exodus: ETFs & Strategy
2.1 Record Hemorrhage from Spot Bitcoin ETFs
For 13 consecutive trading days, U.S.-listed Bitcoin ETFs recorded net redemptions totaling over $3.4 billion — the longest and most severe outflow streak since their inception. The Coinbase Premium Index, collapsing to -0.15%, confirms that selling pressure emanated directly from American institutional whales, marking the complete drying up of domestic demand.
2.2 The Psychological Shockwave from Strategy’s Sale
Strategy’s (formerly MicroStrategy) decision to liquidate 32 BTC (~$2.5M) — the first sale in four years of uninterrupted accumulation — triggered a shockwave far beyond its nominal value. Sentiment algorithms (NLP) and retail investors interpreted this act as a peak capitulation signal, instilling doubt about the viability of corporate BTC treasury strategies. The result: ~$160 billion in market capitalization evaporated in a matter of sessions.
3. The Leverage Flush Mechanics: $1.77 Billion Liquidated
The vertical speed of the decline from $70,000 to $60,000 cannot be explained by spot selling alone. It is the very architecture of the derivatives market — active 24/7, with no regulatory circuit breakers and enabling leverage up to 100x — that transformed a correction into a cataclysmic purge.
Within 24 hours, 330,344 traders suffered forced liquidations totaling $1.77 billion. The mechanism is self-fulfilling: each liquidation generates a market sell order that pushes the price toward the next liquidation threshold, triggering a cascade. This chain reaction explains the large capitulation wicks visible on price charts.
4. Microstructure & Order Flow: What the Heatmap Reveals
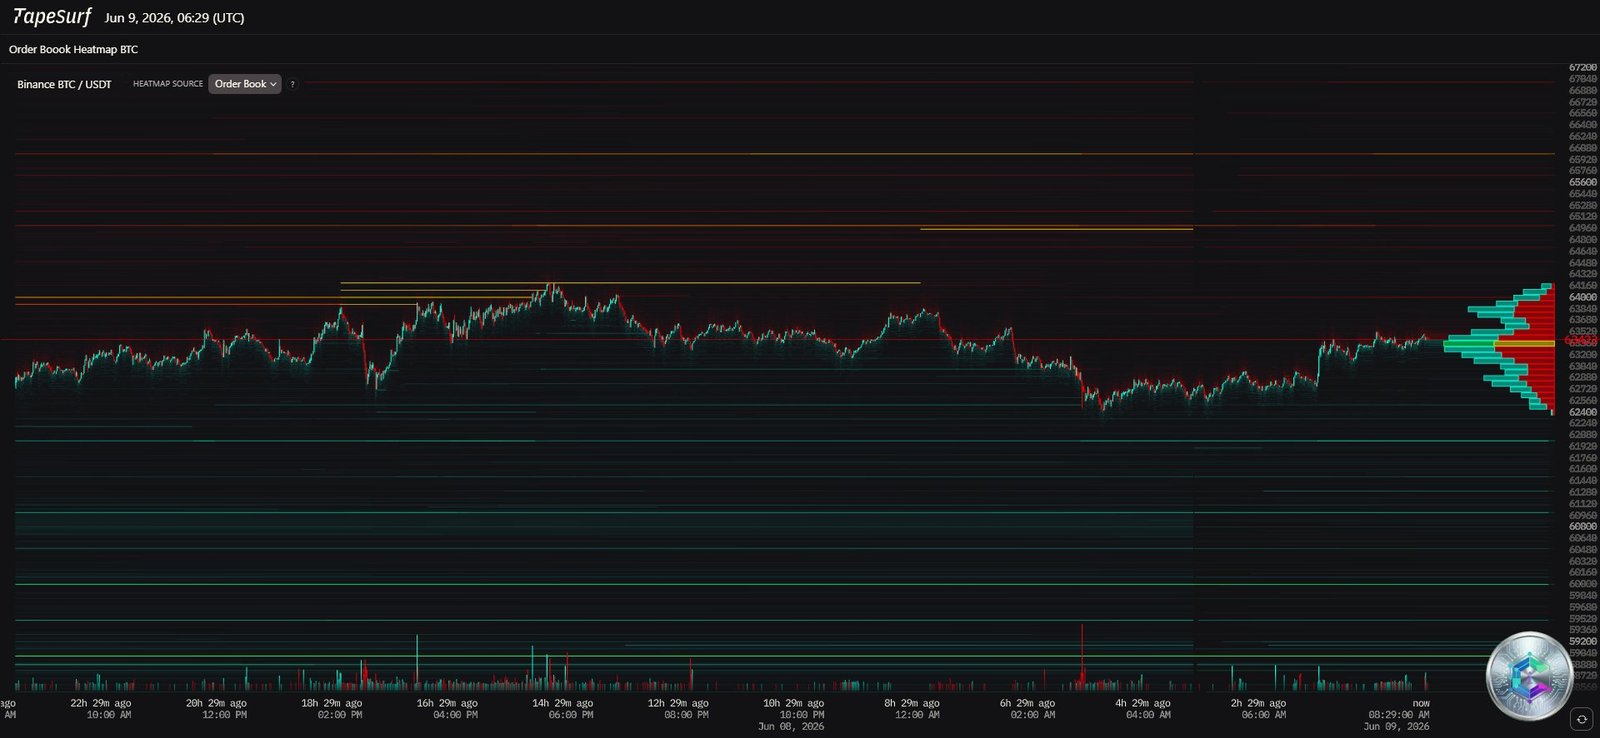
The BTC/USDT order book heatmap on Binance (TapeSurf, June 9, 2026) reveals a striking topography. With price trading around $63,524, two zones stand out clearly:
- Above ($64,000 – $68,000): Horizontal bands of intense brightness (yellow/red) — a resistance fortress made up of aggressive short sellers, trapped operators seeking break-even, and short liquidation clusters. This wall acts as a magnet for a potential short squeeze.
- Below (under $63,000): A concerning scarcity of dense liquidity down to the $60,000 area, the only level where significant defensive strata reappear.
The law of liquidity hunting postulates that price will inevitably be drawn toward the $64,000–$68,000 zone to orchestrate a short squeeze — provided the $60,000 bastion holds.
5. Daily Chart Analysis (1D): The Wall and the Fortress
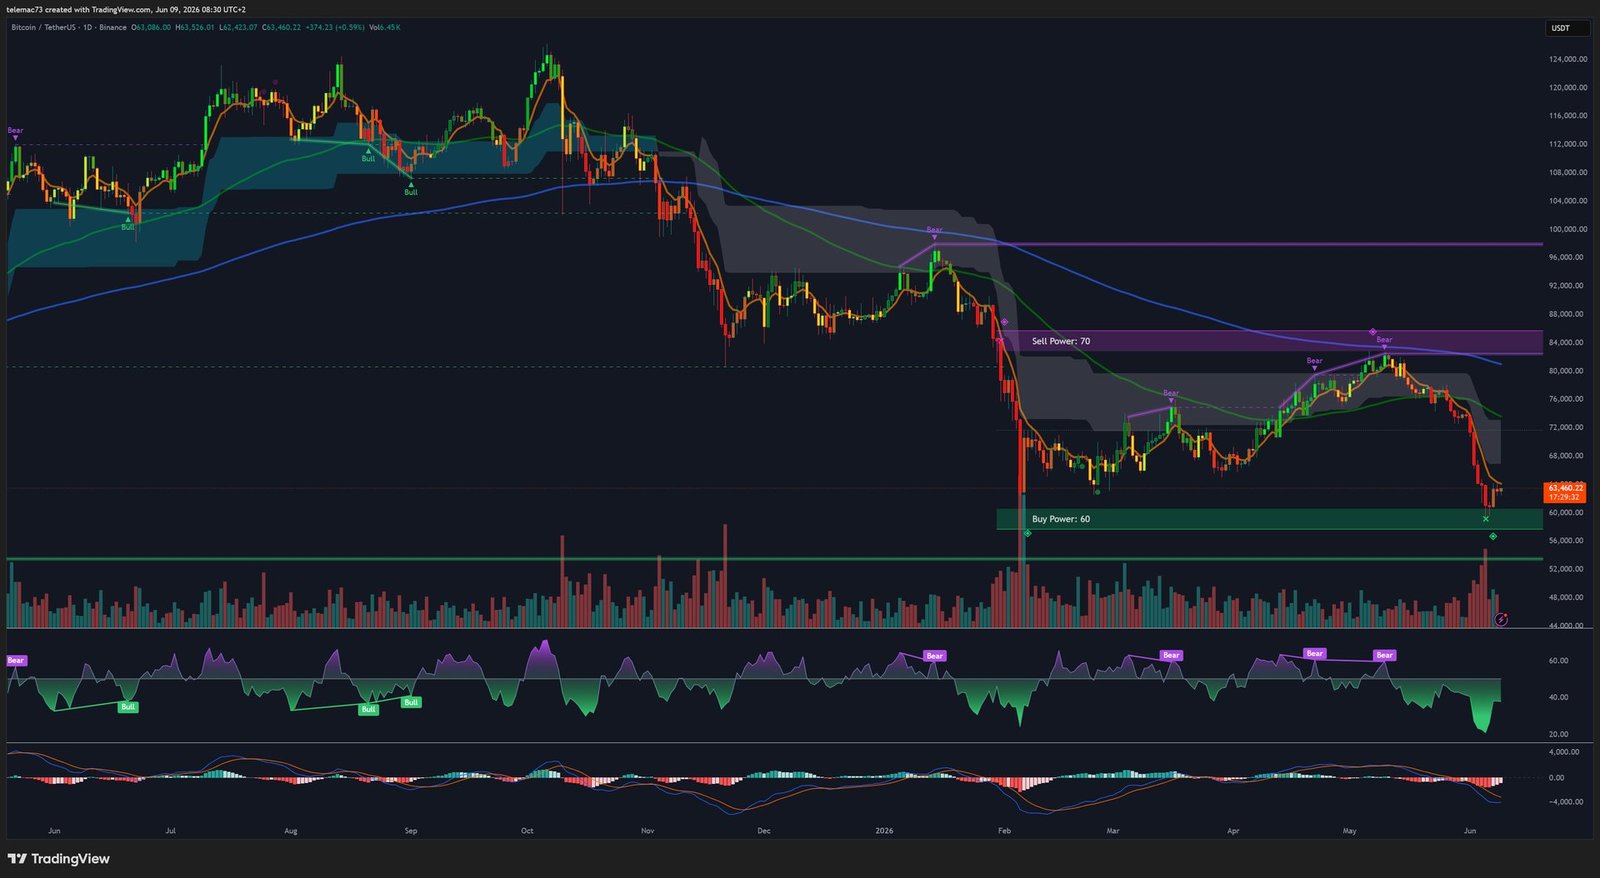
The daily chart reveals two structural institutional zones:
- « Sell Power: 70 » ($68,000 – $72,000): An imposing purple wall materializing major institutional resistance. This is where ETF outflows and portfolio liquidations crystallize graphically.
- « Buy Power: 60 » ($59,000 – $61,000): The ultimate structural support zone. Lower wicks on recent daily candles, sharply rejected upward from this level, testify to the presence of solid residual institutional demand.
Daily oscillators tell a two-act story: the RSI plunged into extreme oversold territory (below 30), signaling the likely imminence of a mean reversion. The MACD displays a Death Cross at altitude, but its red histogram bars are ceasing to expand — a clinical sign of exhaustion in bearish acceleration.
6. 4-Hour Analysis: Bullish Divergence & Momentum Exhaustion
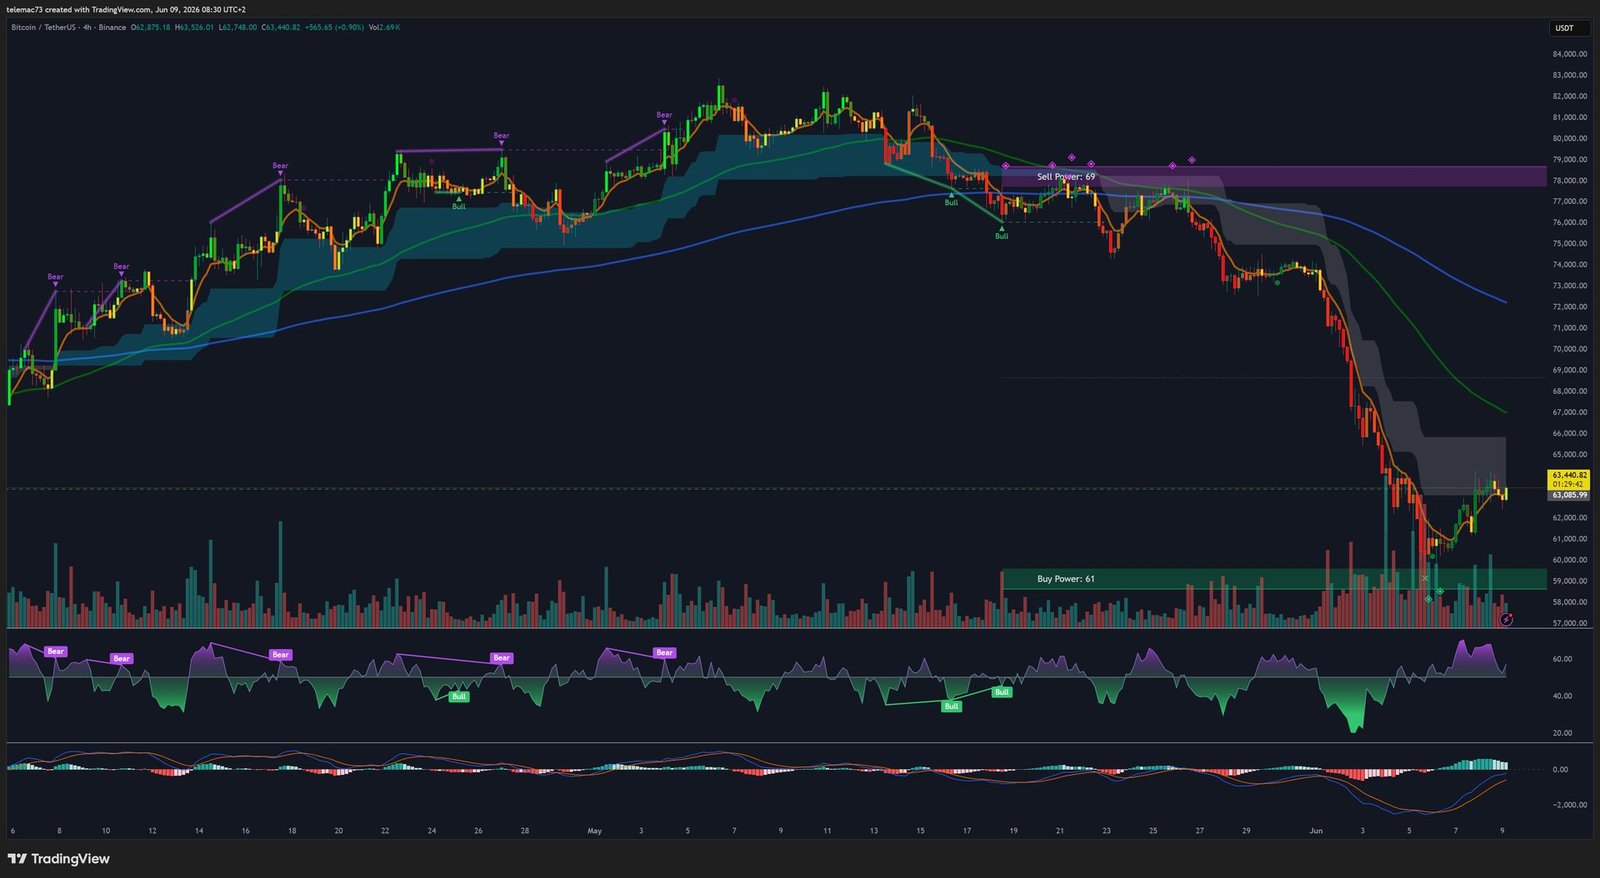
On the 4H chart, price is crushed beneath a now-bearish moving average ribbon (grey/blue tint), following a confirmed Death Cross. Each relief bounce runs directly into the base of this dynamic resistance cloud.
Yet the oscillators are sending the first glimmers of hope:
- 4H RSI: During the second wave down toward $60,000, price made a lower low while the RSI did not follow with the same intensity — a classic bullish divergence signaling the evaporation of selling momentum.
- 4H MACD: Red histogram bars are transitioning toward decreasing pink/green bars. The MACD lines are forming a concave curve — early signs of a nascent bullish crossover. Sellers are losing their grip.
7. 15-Minute Micro-Dynamics: The Coiled Spring
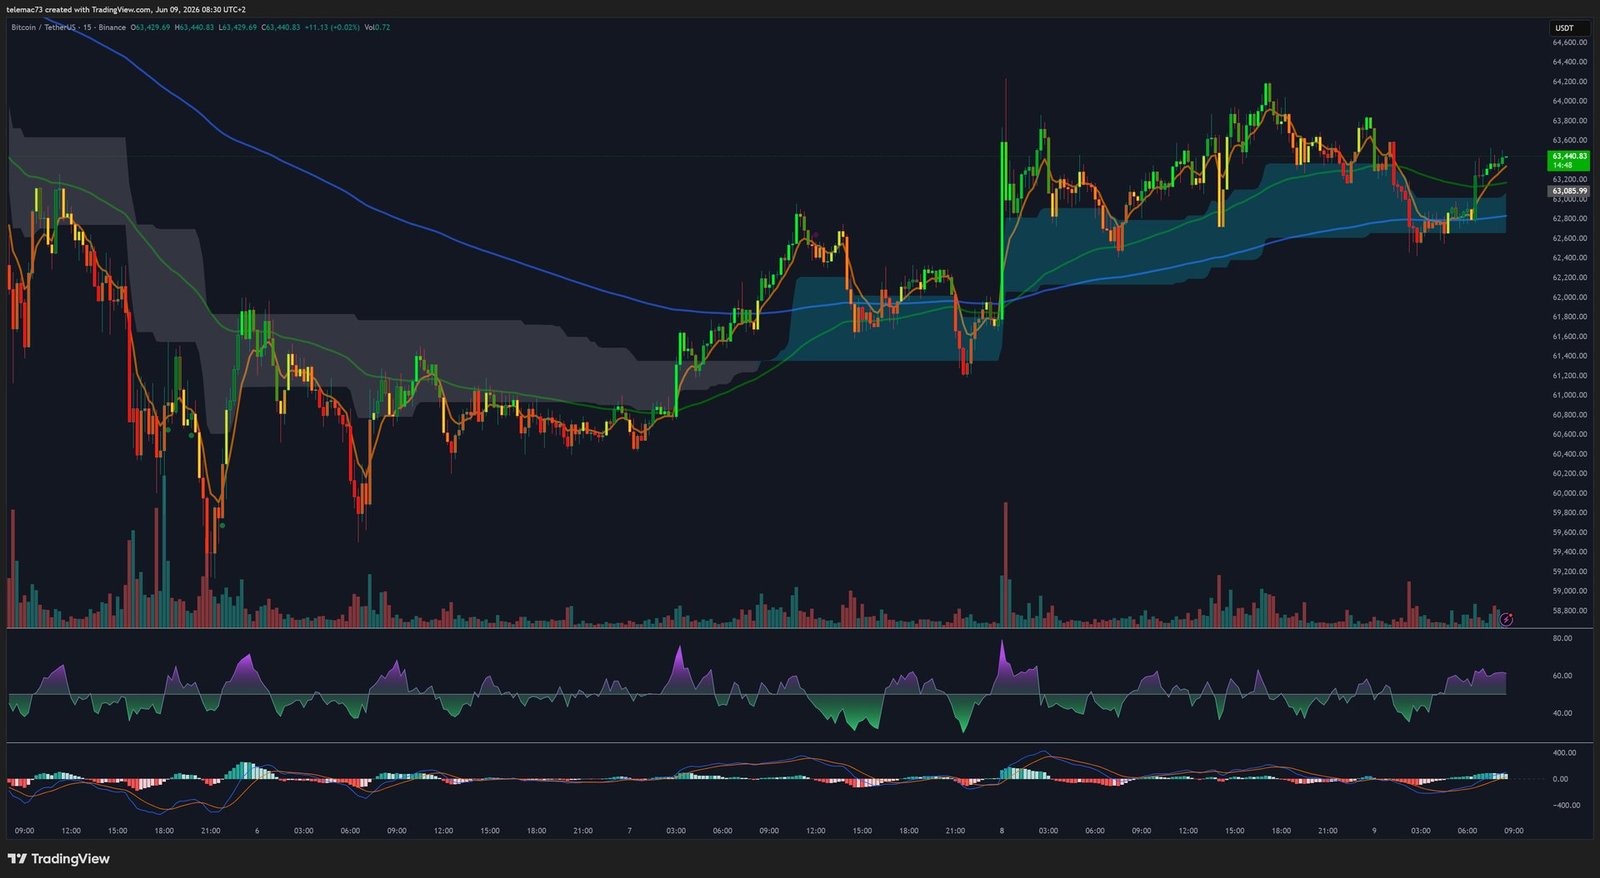
The 15m chart reveals the violence of HFT algorithms during the crash: massive capitulation candles, paroxysmal volume spikes — the unmistakable signature of the $1.77B liquidation event. The subsequent V-shaped recovery trapped late-entry over-leveraged sellers in a swift short squeeze.
Currently ($63,440), price is stabilizing within the moving average ribbons (bullish turquoise tint). The 15m MACD dances around zero with micro-bars alternating green/red — a volatility compression (squeeze) configuration. The market is coiling kinetic energy. Per chartist principles, a low-volatility period inevitably precedes a directional expansion: $65,000 to the upside or $60,000 to the downside.
8. Capital Rotation: What Smart Money Is Actually Doing
One of June 2026’s most revealing observations is the asymmetric and selective nature of this correction. Smart money is not deserting the blockchain — it is re-fragmenting its architecture:
| Asset / Sector | Price Action (June 2026) | Capital Flow Dynamics |
|---|---|---|
| Bitcoin (BTC) | -15%, testing $60k | Massive ETF outflows (-$3.4B) |
| Ethereum (ETH) | -65% from ATH, testing $1,524 | Opportunistic institutional buys (Bitmine +$214M, 126,971 ETH) |
| Legacy Altcoins (ADA, XRP) | Total capitulation (ADA < $0.23) | Complete liquidity exhaustion |
| Emerging Sectors (HYPE, AI) | Uptrend defying macro gravity | Massive net inflows (HYPE ETF +$160M) |
The conclusion is unequivocal: institutional capital is punishing obsolete valuations while rewarding forward-looking narratives. Bitmine aggressively accumulates ETH at the bottom while projects like Hyperliquid absorb the residual liquidity.
9. Key Level Mapping: Supports, Resistances & Pivots
| Level | Price Zone | Analytical Foundation |
|---|---|---|
| Macro Resistance (R3) | $72,000 – $72,840 | Recent intra-week high. Wall to break through to reactivate the secular bull market. |
| Institutional Resistance (R2) | $68,000 – $70,000 | « Sell Power: 70 » zone. Former support turned polarity resistance. |
| Liquidity Resistance (R1) | $64,000 – $65,710 | Incandescent band on Heatmap. Massive short cluster + short squeeze trigger zone. |
| Pivot Zone / POC | $62,900 – $63,500 | Volume Point of Control. 15m Golden Cross. 4H MACD inflection point. |
| Capitulation Support (S1) | $59,000 – $60,215 | « Buy Power: 60 » zone. Floor that absorbed $1.77B in liquidations. The lifeline. |
| Deep Support (S2) | $53,000 – $55,000 | Bear Trap mathematical target if S1 fails. Dormant orders on Coinbase. |
| Abyss Support (S3) | $50,000 | Ultimate psychological threshold. Worst-case systemic deleveraging scenario. |
10. Strategic Synthesis
Bitcoin’s market in June 2026 is not dying — it is evolving and growing in sophistication. The $1.77 billion purge has cleansed the market of excess speculative leverage. Evidence of a defensive floor is accumulating: the $59,000–$61,000 zone vigorously repelled selling assaults, the 4H RSI bullish divergence signals kinetic exhaustion of bearish momentum, and the 15m compression is preparing an imminent directional expansion.
Residual liquidity is now above price ($64,000–$68,000), acting as a magnet for a potential short squeeze. The current paradigm demands precision navigation: any bullish exposure must be conditioned on the inviolate maintenance of $59,000, with value capture targets on an expansion toward $65,000.
⚠️ Disclaimer
This article is written for educational and informational purposes only. It does not constitute investment advice, nor a recommendation to buy or sell any financial or digital assets. Cryptocurrency markets are highly volatile and carry significant risk of capital loss. Please consult a qualified financial advisor before making any investment decisions.